


 |
市场调查报告书
商品编码
1906859
北美货运与物流:市场占有率分析、产业趋势与统计、成长预测(2026-2031)North America Freight And Logistics - Market Share Analysis, Industry Trends & Statistics, Growth Forecasts (2026 - 2031) |
||||||
※ 本网页内容可能与最新版本有所差异。详细情况请与我们联繫。
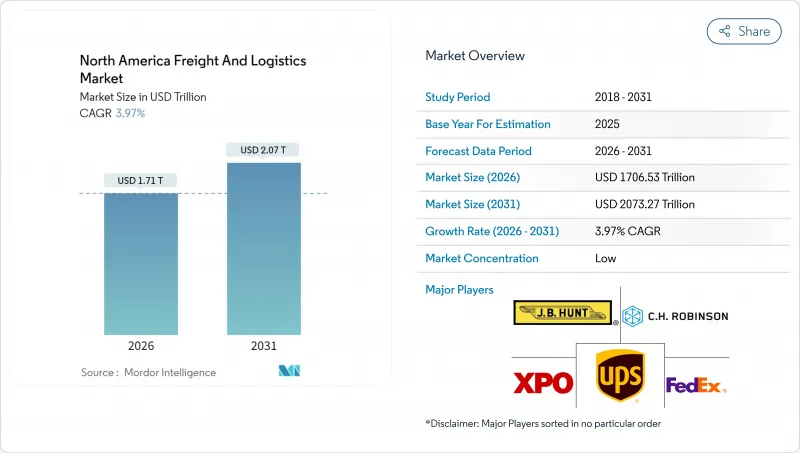
2025年北美货运和物流市场价值为16413.7亿美元,预计到2031年将达到20732.7亿美元,2026年为17065.3亿美元。
预计在预测期(2026-2031 年)内,复合年增长率将达到 3.97%。
透过《美国-墨西哥-加拿大协定》(USMCA)加强贸易一体化、电子商务小包裹量快速增长以及联邦政府资助的基础设施现代化计划,巩固了该走廊的战略重要性并促进了投资流动。预计到2024年,跨境贸易将达到创纪录水平,其中加美国贸易额将达7,800亿美元,美国墨贸易额将达8,078亿美元。加速向墨西哥的近岸外包,加上美国1,100亿美元的交通运输资金投入,正在推动货运走廊的重组和技术主导的效率提升。同时,劳动力短缺和网路安全威胁正在限制运力,推动自动化应用并增加对弹性网路的需求。在此背景下,儘管短期内面临营运方面的挑战,但预计在技术创新的驱动下,北美货运和物流市场将保持稳定成长。
北美货运及物流市场趋势及洞察
电子商务小包裹量加速成长推动了最后一公里配送创新
2024年第二季度,电子商务渗透率达到零售总额的15.6%,每年产生超过240亿个小包裹,超过了传统「最后一公里」运输能力。为了应对这项挑战,企业透过在都市区建立微型仓配中心、试点自动驾驶货车以及利用零工经济快递员等方式,提高了应对尖峰时段(占全年货运量的40%)的灵活性。当日达和隔天达的前景正在催生一个价值120亿美元的城市物流房地产市场,亚马逊在2024年开设150个新的配送站便是最好的例证。美国和加拿大的监管机构已批准了有限的无人机飞行走廊,显示了对替代运输方式的製度支持。随着小包裹密度的增加(与2022年相比成长了35%)加剧了道路拥堵,承运商正在尝试集中式配送模式,以减少车辆停留时间和排放气体。
美墨加协定贸易整合将重塑跨境物流网络
美墨加协定(USMCA)将推动三边贸易额在2024年达到1.6兆美元,货运量年增8.2%。拉雷多和底特律等边境口岸的自动化清关平台可将清关时间缩短高达30%,而墨西哥4,550亿美元的出口额也对高价值零件提出了复杂的逆向物流需求。加拿大太平洋铁路公司和堪萨斯城铁路公司于2024年合併,开通了加拿大港口与墨西哥工业区之间的首条直达单线铁路服务,缩短了运输时间,并最大限度地减少了货物中转次数。完善的数位化贸易法规实现了货物即时追踪,并将高流量边境地区的停留时间缩短至约90分钟。边境两侧对低温运输和汽车物流中心的投资凸显了北美货运和物流市场的战略深度。
劳动力短缺限制了营运能力
截至2024年,北美地区仍有超过8万个商业司机职位和60万个仓库职位空缺,在南加州和德克萨斯三角区等热点地区,离职率超过75%。随着运输公司竞相争取人才,总薪资上涨了15%至20%,但劳动力的平均年龄已超过47岁,引发了人们对长期产能的担忧。 2024年,自动化投资达48亿美元,各公司正在部署机器人分类系统和自动驾驶场内卡车。儘管联邦政府允许年轻司机跨州运输货物,但劳动力短缺问题在2026年之前不太可能显着缓解。
细分市场分析
製造业28.95%的份额反映了对准时制流程和复杂退货流程的根深蒂固的需求。半导体、电动车和医疗设备製造商推动了对受控环境和安全运输的需求。即使近岸外包持续成长,製造商仍在寻求能够整合生产和运输节点并减少缓衝库存的端到端可视性工具。
在全通路普及的推动下,批发和零售业预计将成为成长最快的产业,年复合成长率(CAGR)将达到4.21%(2026-2031年)。零售商正在分散库存,并将门市和线上库存整合,以缩短交货时间。对温控食品物流日益增长的需求,推动了北美货运和物流市场低温运输投资的进一步扩张。随着逆向物流量的成长,能够快速分类、转售或回收退货的承运商将获得更大的市场份额。
到2025年,货运将占北美货运收入的62.58%,再次巩固其在北美货运和物流市场的核心地位。儘管道路运输仍占据主导地位,但随着托运人优先考虑成本和永续性,铁路货柜运输的份额正在逐步提升。在这一领域,利用远端资讯处理技术的预测性维护正在减少非计划性停机时间,并提高交付时间的准确性。自动化试点计画正扩展到长途编队行驶和场内作业的机器人技术,预示着未来十年有人驾驶和无人驾驶资产将逐步融合。
儘管快速配送服务规模目前较小,但由于电子商务的成长,预计2026年至2031年间将以4.4%的复合年增长率成长。密集的都市区网路和演算法路线优化使得75%的美国家庭能够享受当日送达服务。小包裹递送公司正在试行动态定价机制,以根据即时需求调整运力。这些趋势表明,首末端配送领域的创新将决定北美货运和物流市场的竞争优势。
其他福利:
- Excel格式的市场预测(ME)表
- 3个月的分析师支持
目录
第一章 引言
- 研究假设和市场定义
- 调查范围
第二章调查方法
第三章执行摘要
第四章 市场情势
- 市场概览
- 人口统计数据
- 按经济活动分類的GDP分配
- 按经济活动分類的GDP成长
- 通货膨胀
- 经济表现及概况
- 电子商务产业的趋势
- 製造业趋势
- 运输和仓储业GDP
- 出口趋势
- 进口趋势
- 燃油价格
- 卡车运输营运成本
- 卡车运输车队规模(按类型)
- 主要卡车供应商
- 物流绩效
- 透过交通方式分享
- 海运船队运力
- 班轮运输连接
- 停靠港口和演出
- 货运费率趋势
- 货物吨位趋势
- 基础设施
- 法律规范(公路和铁路)
- 加拿大
- 墨西哥
- 美国
- 法规结构(海事和航空)
- 加拿大
- 墨西哥
- 美国
- 价值炼和通路分析
- 市场驱动因素
- 加速电子商务小包裹量
- 透过美国墨加协定(USMCA)实现跨境贸易一体化
- 来自《美国基础设施投资和就业创造法案》的资金筹措
- 製造地近岸外包到墨西哥
- 数位货运市场和API连接
- 温控(低温运输)物流的扩张
- 市场限制
- 驾驶人和仓库工人短缺
- 港口拥挤及铁路运力瓶颈
- 卡车运输业保险费上涨
- 连网车辆的网路安全漏洞
- 市场创新
- 波特五力分析
- 新进入者的威胁
- 买方的议价能力
- 供应商的议价能力
- 替代品的威胁
- 竞争对手之间的竞争
第五章 市场规模与成长预测
- 终端用户产业
- 农业、渔业、林业
- 建造
- 製造业
- 石油天然气、采矿和采石
- 批发和零售
- 其他的
- 物流职能
- 宅配、速递和小包裹(CEP)
- 按目的地类型
- 国内的
- 国际的
- 按目的地类型
- 货运代理
- 透过交通工具
- 航空
- 海路和内河航道
- 其他的
- 透过交通工具
- 货物运输
- 透过交通工具
- 航空
- 管道
- 铁路
- 路
- 海路和内河航道
- 透过交通工具
- 仓储和存储
- 透过温度控制
- 非温控型
- 温度控制
- 透过温度控制
- 其他服务
- 宅配、速递和小包裹(CEP)
- 国家
- 加拿大
- 墨西哥
- 美国
- 北美其他地区
第六章 竞争情势
- 市场集中度
- 关键策略倡议
- 市占率分析
- 公司简介
- AP Moller-Maersk
- AIT Worldwide Logistics
- Americold
- ArcBest
- Arrive Logistics
- Ascent Global Logistics
- Berkshire Hathaway Inc.(Including BNSF Railway Company)
- Brookfield Infrastructure Partners LP(Including Genesee & Wyoming Inc.)
- Burris Logistics
- CH Robinson
- Canada Post Corporation(Including Purolator)
- Canadian National Railway
- Canadian Pacific Railway
- Capstone Logistics LLC
- Congebec
- CSX Corporation
- DHL Group
- DSV A/S(Including DB Schenker)
- Excel Group
- Expeditors International of Washington, Inc.
- Fastfrate Inc.
- FedEx
- Fomento Economico Mexicano, SAB de CV
- GEODIS
- Grupo Mexico
- GXO Logistics, Inc.
- Hub Group Inc.
- JB Hunt Transport, Inc.
- Knight-Swift Transportation Holdings, Inc.
- Kuehne+Nagel
- Landstar System, Inc.
- Lineage, Inc.
- M3 Transport
- Mactrans Logistics
- MODE Global LLC
- NFI Industries
- Nippon Express Holdings
- Norfolk Southern Railway
- Old Dominion Freight Line
- Omni Logistics
- OnTrac
- Patriot Rail Company
- Penske Corporation(including Penske Logistics)
- Polaris Worldwide Logistics
- Ryder System, Inc.
- Schneider National, Inc.
- SF Express(KEX-SF)
- TFI International Inc.
- Total Quality Logistics, LLC
- Transportation Insight Holding
- Traxion
- Uber Technologies Inc.
- Union Pacific Railroad
- United Parcel Service of America, Inc.(UPS)
- Werner Enterprises, Inc.
- XPO, Inc.
第七章 市场机会与未来展望
The North America freight and logistics market was valued at USD 1641.37 billion in 2025 and estimated to grow from USD 1706.53 billion in 2026 to reach USD 2073.27 billion by 2031, at a CAGR of 3.97% during the forecast period (2026-2031).
Robust USMCA-driven trade integration, surging e-commerce parcel volumes, and federally funded infrastructure modernization projects are reinforcing the strategic importance of the corridor and underpinning investment flows. Cross-border trade reached record levels in 2024, with Canada-U.S. commerce hitting USD 780 billion and Mexico-U.S. flows touching USD 807.8 billion. Accelerated near-shoring to Mexico, complemented by USD 110 billion in U.S. transportation funding, is reshaping freight corridors and injecting technology-led efficiencies. At the same time, labor shortages and cybersecurity threats are constraining capacity, spurring automation adoption, and heightening the need for resilient networks. Against this backdrop, the North America freight and logistics market is poised for steady, technology-enabled growth despite short-term operational headwinds.
North America Freight And Logistics Market Trends and Insights
Accelerated E-Commerce Parcel Volumes Drive Last-Mile Innovation
E-commerce penetration reached 15.6% of retail sales in Q2 2024, generating more than 24 billion parcels annually and outstripping legacy last-mile capacity. Operators responded by deploying micro-fulfillment hubs within city limits, piloting autonomous delivery vans and tapping gig-economy couriers to flex capacity during peak periods that now account for 40% of yearly throughput. Same-day and next-day expectations have unlocked a USD 12 billion urban logistics real-estate opportunity, evidenced by the 150 new delivery stations Amazon opened in 2024. Regulators in both the United States and Canada have cleared limited drone corridors, signaling institutional backing for alternative modes. Higher parcel density-up 35% since 2022-has intensified curbside congestion, prompting carriers to test consolidated drop-off models that lower vehicle dwell times and emissions.
USMCA Trade Integration Reshapes Cross-Border Logistics Networks
USMCA enabled USD 1.6 trillion in trilateral trade during 2024, with freight flows rising 8.2% year over year. Automated customs platforms now trim clearance times by up to 30% at crossings such as Laredo and Detroit, while Mexican exports of USD 455 billion are generating complex reverse-logistics needs for high-value components. The 2024 Canadian Pacific Kansas City rail merger established the first single-line service that links Canadian ports directly to Mexican industrial zones, compressing transit times and minimizing handoffs. Enhanced digital trade provisions support real-time cargo tracking, further reducing border dwell times to roughly 90 minutes at high-volume lanes. Investments in cold-chain and automotive logistics centers on both sides of the border highlight the strategic depth of the North America freight and logistics market.
Labor Shortages Constrain Operational Capacity
More than 80,000 commercial driving positions and 600,000 warehouse roles remained unfilled across North America in 2024, with churn surpassing 75% in hot spots such as Southern California and the Texas Triangle. Wage bills climbed 15-20% as carriers competed for talent, yet the workforce median age crept past 47 years, threatening long-term capacity. Automation spend reached USD 4.8 billion in 2024 as firms implemented robotic sortation and autonomous yard trucks. Federal waivers allowing younger drivers to haul interstate freight are in place, but meaningful labor relief is unlikely before 2026.
Other drivers and restraints analyzed in the detailed report include:
- Infrastructure Investment Modernizes Freight Corridors
- Near-shoring Manufacturing Transforms Mexico's Logistics Landscape
- Infrastructure Bottlenecks Limit Growth Potential
For complete list of drivers and restraints, kindly check the Table Of Contents.
Segment Analysis
Manufacturing's 28.95% share signals entrenched just-in-time practices and complex returns flows. Semiconductor, electric-vehicle and medical-device producers are driving requirements for controlled environments and secured transport. Even amid near-shoring, manufacturers are demanding end-to-end visibility tools that integrate production milestones with freight milestones, shrinking buffer inventories.
Wholesale and retail trade, propelled by omnichannel fulfillment, is the fastest mover at a 4.21% CAGR (2026-2031). Retailers are decentralizing inventory into micro-fulfillment sites to cut delivery times while blending store and online stock pools. Temperature-controlled grocery logistics are seeing heightened interest, supporting further cold-chain investment in the North America freight and logistics market. As reverse-logistics volumes rise, carriers that can quickly triage returns for resale or recycling will gain share.
Freight Transport controlled 62.58% of revenue in 2025, reaffirming its backbone role within the North America freight and logistics market. Road haulage dominates this function, yet rail intermodal share is creeping upward as shippers prioritize cost and sustainability. The segment is leveraging telematics for predictive maintenance, trimming unplanned downtime, and tightening delivery windows. Automation pilots now span long-haul platooning and yard-hostler robotics, pointing to a gradual blend of manned and autonomous assets through the decade.
CEP services, while smaller, are expanding at a 4.4% CAGR (2026-2031) thanks to e-commerce. Same-day coverage is now feasible for 75% of U.S. households, underpinned by dense urban networks and algorithmic route optimization. Parcel carriers are experimenting with dynamic pricing engines that match capacity to real-time demand. Combined, these dynamics reinforce that innovation in first- and last-mile delivery will shape competitive positioning across the broader North America freight and logistics market.
The North America Freight and Logistics Market Report is Segmented by Logistics Function (Courier, Express, and Parcel, Freight Forwarding, Freight Transport, Warehousing and Storage, and Other Services), End User Industry (Agriculture, Fishing, and Forestry, Construction, Manufacturing, Wholesale and Retail Trade, and More), and Geography (United States, Canada, and More). The Market Forecasts are Provided in Terms of Value (USD).
List of Companies Covered in this Report:
- A.P. Moller-Maersk
- AIT Worldwide Logistics
- Americold
- ArcBest
- Arrive Logistics
- Ascent Global Logistics
- Berkshire Hathaway Inc. (Including BNSF Railway Company)
- Brookfield Infrastructure Partners L.P. (Including Genesee & Wyoming Inc.)
- Burris Logistics
- C.H. Robinson
- Canada Post Corporation (Including Purolator)
- Canadian National Railway
- Canadian Pacific Railway
- Capstone Logistics LLC
- Congebec
- CSX Corporation
- DHL Group
- DSV A/S (Including DB Schenker)
- Excel Group
- Expeditors International of Washington, Inc.
- Fastfrate Inc.
- FedEx
- Fomento Economico Mexicano, S.A.B. de C.V.
- GEODIS
- Grupo Mexico
- GXO Logistics, Inc.
- Hub Group Inc.
- J.B. Hunt Transport, Inc.
- Knight-Swift Transportation Holdings, Inc.
- Kuehne+Nagel
- Landstar System, Inc.
- Lineage, Inc.
- M3 Transport
- Mactrans Logistics
- MODE Global LLC
- NFI Industries
- Nippon Express Holdings
- Norfolk Southern Railway
- Old Dominion Freight Line
- Omni Logistics
- OnTrac
- Patriot Rail Company
- Penske Corporation (including Penske Logistics)
- Polaris Worldwide Logistics
- Ryder System, Inc.
- Schneider National, Inc.
- SF Express (KEX-SF)
- TFI International Inc.
- Total Quality Logistics, LLC
- Transportation Insight Holding
- Traxion
- Uber Technologies Inc.
- Union Pacific Railroad
- United Parcel Service of America, Inc. (UPS)
- Werner Enterprises, Inc.
- XPO, Inc.
Additional Benefits:
- The market estimate (ME) sheet in Excel format
- 3 months of analyst support
TABLE OF CONTENTS
1 Introduction
- 1.1 Study Assumptions and Market Definition
- 1.2 Scope of the Study
2 Research Methodology
3 Executive Summary
4 Market Landscape
- 4.1 Market Overview
- 4.2 Demographics
- 4.3 GDP Distribution by Economic Activity
- 4.4 GDP Growth by Economic Activity
- 4.5 Inflation
- 4.6 Economic Performance and Profile
- 4.6.1 Trends in E-Commerce Industry
- 4.6.2 Trends in Manufacturing Industry
- 4.7 Transport and Storage Sector GDP
- 4.8 Export Trends
- 4.9 Import Trends
- 4.10 Fuel Price
- 4.11 Trucking Operational Costs
- 4.12 Trucking Fleet Size by Type
- 4.13 Major Truck Suppliers
- 4.14 Logistics Performance
- 4.15 Modal Share
- 4.16 Maritime Fleet Load Carrying Capacity
- 4.17 Liner Shipping Connectivity
- 4.18 Port Calls and Performance
- 4.19 Freight Pricing Trends
- 4.20 Freight Tonnage Trends
- 4.21 Infrastructure
- 4.22 Regulatory Framework (Road and Rail)
- 4.22.1 Canada
- 4.22.2 Mexico
- 4.22.3 United States
- 4.23 Regulatory Framework (Sea and Air)
- 4.23.1 Canada
- 4.23.2 Mexico
- 4.23.3 United States
- 4.24 Value Chain and Distribution Channel Analysis
- 4.25 Market Drivers
- 4.25.1 Accelerated E-Commerce Parcel Volumes
- 4.25.2 USMCA-Driven Cross-Border Trade Integration
- 4.25.3 U.S. Infrastructure Investment and Jobs Act Funding
- 4.25.4 Near-Shoring of Manufacturing to Mexico
- 4.25.5 Digital Freight Marketplaces and API Connectivity
- 4.25.6 Expansion of Temperature-Controlled (Cold-Chain) Logistics
- 4.26 Market Restraints
- 4.26.1 Driver and Warehouse Labor Shortages
- 4.26.2 Port Congestion and Rail Capacity Bottlenecks
- 4.26.3 Rising Trucking-Sector Insurance Premiums
- 4.26.4 Cyber-Security Vulnerabilities in Connected Fleets
- 4.27 Technology Innovations in the Market
- 4.28 Porter's Five Forces Analysis
- 4.28.1 Threat of New Entrants
- 4.28.2 Bargaining Power of Buyers
- 4.28.3 Bargaining Power of Suppliers
- 4.28.4 Threat of Substitutes
- 4.28.5 Competitive Rivalry
5 Market Size and Growth Forecasts (Value, USD)
- 5.1 End User Industry
- 5.1.1 Agriculture, Fishing, and Forestry
- 5.1.2 Construction
- 5.1.3 Manufacturing
- 5.1.4 Oil and Gas, Mining and Quarrying
- 5.1.5 Wholesale and Retail Trade
- 5.1.6 Others
- 5.2 Logistics Function
- 5.2.1 Courier, Express, and Parcel (CEP)
- 5.2.1.1 By Destination Type
- 5.2.1.1.1 Domestic
- 5.2.1.1.2 International
- 5.2.1.1 By Destination Type
- 5.2.2 Freight Forwarding
- 5.2.2.1 By Mode of Transport
- 5.2.2.1.1 Air
- 5.2.2.1.2 Sea and Inland Waterways
- 5.2.2.1.3 Others
- 5.2.2.1 By Mode of Transport
- 5.2.3 Freight Transport
- 5.2.3.1 By Mode of Transport
- 5.2.3.1.1 Air
- 5.2.3.1.2 Pipelines
- 5.2.3.1.3 Rail
- 5.2.3.1.4 Road
- 5.2.3.1.5 Sea and Inland Waterways
- 5.2.3.1 By Mode of Transport
- 5.2.4 Warehousing and Storage
- 5.2.4.1 By Temperature Control
- 5.2.4.1.1 Non-Temperature-Controlled
- 5.2.4.1.2 Temperature-Controlled
- 5.2.4.1 By Temperature Control
- 5.2.5 Other Services
- 5.2.1 Courier, Express, and Parcel (CEP)
- 5.3 Country
- 5.3.1 Canada
- 5.3.2 Mexico
- 5.3.3 United States
- 5.3.4 Rest of North America
6 Competitive Landscape
- 6.1 Market Concentration
- 6.2 Key Strategic Moves
- 6.3 Market Share Analysis
- 6.4 Company Profiles (Includes Global Level Overview, Market Level Overview, Core Segments, Financials as Available, Strategic Information, Market Rank/Share for Key Companies, Products and Services, and Recent Developments)
- 6.4.1 A.P. Moller-Maersk
- 6.4.2 AIT Worldwide Logistics
- 6.4.3 Americold
- 6.4.4 ArcBest
- 6.4.5 Arrive Logistics
- 6.4.6 Ascent Global Logistics
- 6.4.7 Berkshire Hathaway Inc. (Including BNSF Railway Company)
- 6.4.8 Brookfield Infrastructure Partners L.P. (Including Genesee & Wyoming Inc.)
- 6.4.9 Burris Logistics
- 6.4.10 C.H. Robinson
- 6.4.11 Canada Post Corporation (Including Purolator)
- 6.4.12 Canadian National Railway
- 6.4.13 Canadian Pacific Railway
- 6.4.14 Capstone Logistics LLC
- 6.4.15 Congebec
- 6.4.16 CSX Corporation
- 6.4.17 DHL Group
- 6.4.18 DSV A/S (Including DB Schenker)
- 6.4.19 Excel Group
- 6.4.20 Expeditors International of Washington, Inc.
- 6.4.21 Fastfrate Inc.
- 6.4.22 FedEx
- 6.4.23 Fomento Economico Mexicano, S.A.B. de C.V.
- 6.4.24 GEODIS
- 6.4.25 Grupo Mexico
- 6.4.26 GXO Logistics, Inc.
- 6.4.27 Hub Group Inc.
- 6.4.28 J.B. Hunt Transport, Inc.
- 6.4.29 Knight-Swift Transportation Holdings, Inc.
- 6.4.30 Kuehne+Nagel
- 6.4.31 Landstar System, Inc.
- 6.4.32 Lineage, Inc.
- 6.4.33 M3 Transport
- 6.4.34 Mactrans Logistics
- 6.4.35 MODE Global LLC
- 6.4.36 NFI Industries
- 6.4.37 Nippon Express Holdings
- 6.4.38 Norfolk Southern Railway
- 6.4.39 Old Dominion Freight Line
- 6.4.40 Omni Logistics
- 6.4.41 OnTrac
- 6.4.42 Patriot Rail Company
- 6.4.43 Penske Corporation (including Penske Logistics)
- 6.4.44 Polaris Worldwide Logistics
- 6.4.45 Ryder System, Inc.
- 6.4.46 Schneider National, Inc.
- 6.4.47 SF Express (KEX-SF)
- 6.4.48 TFI International Inc.
- 6.4.49 Total Quality Logistics, LLC
- 6.4.50 Transportation Insight Holding
- 6.4.51 Traxion
- 6.4.52 Uber Technologies Inc.
- 6.4.53 Union Pacific Railroad
- 6.4.54 United Parcel Service of America, Inc. (UPS)
- 6.4.55 Werner Enterprises, Inc.
- 6.4.56 XPO, Inc.
7 Market Opportunities and Future Outlook
- 7.1 White-space and Unmet-Need Assessment
 中东和非洲货运物流市场:市场份额分析、行业趋势、统计数据和成长预测(2026-2031 年)
 日本货运物流市场规模、份额、趋势及预测(按类型、最终用户及地区划分),2026-2034年
 货运和物流市场规模、份额和成长分析(按运输方式、服务、最终用户和地区划分)-2025-2032年产业预测中东欧货运与物流:市场占有率分析、产业趋势、统计数据与成长预测(2025-2030 年)新加坡货运与物流:市场份额分析、行业趋势、统计数据和成长预测(2025-2030 年)菲律宾货运与物流:市场份额分析、行业趋势、统计数据和成长预测(2025-2030 年)
 全球货物审核与结算市场预测(2025-2030)
 2032 年碳中和解决方案市场预测:按类型、组件、部署模式、组织规模、技术、最终用户和地区进行的全球分析
 2025年货运和物流全球市场报告
 货运审核与结算市场规模、份额及成长分析(依公司规模、最终用户、应用及地区)-2025 年至 2032 年产业预测