


 |
市场调查报告书
商品编码
1910948
北美电动自行车市场-份额分析、产业趋势与统计、成长预测(2026-2031)North America E-bike - Market Share Analysis, Industry Trends & Statistics, Growth Forecasts (2026 - 2031) |
||||||
※ 本网页内容可能与最新版本有所差异。详细情况请与我们联繫。
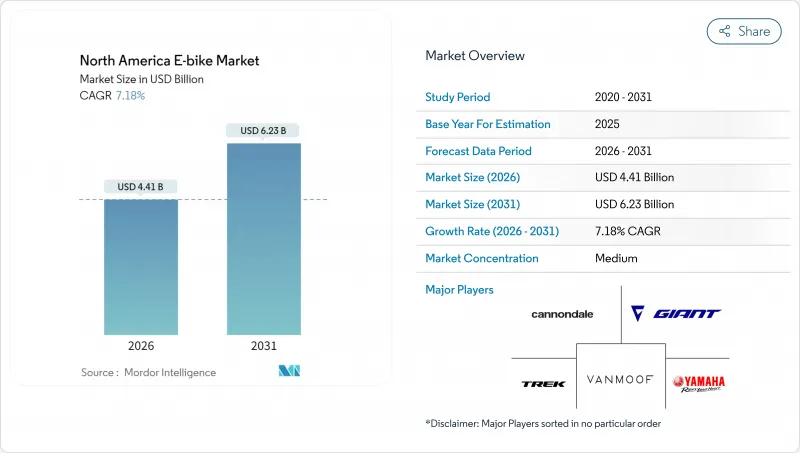
2025 年北美电动自行车市场价值 41.1 亿美元,预计从 2026 年的 44.1 亿美元成长到 2031 年的 62.3 亿美元,在预测期(2026-2031 年)内复合年增长率为 7.18%。
联邦政府的购买激励措施、不断扩大的都市区自行车基础设施以及通勤者偏好的转变,共同推动了自行车需求的稳定成长。受保护自行车道的快速发展和雇主赞助的微型旅行计画的普及,使得目标客户群不再局限于休閒骑行者。联邦和州政府的资金投入降低了前期成本,与公共交通卡相比,已经缩短了投资回收期。
北美电动自行车市场趋势与分析
轻型电动车联邦税额扣抵
《电动自行车法案》扩大了联邦税额扣抵,为符合条件的每辆电动自行车购买者提供高达 1500 美元的直接消费者奖励,从根本上改变了中等收入家庭的价格弹性计算方式。这项政策机制借鉴了成功的电动车推广策略,降低成本,加速了市场渗透,使其超越了早期采用者。这项税额扣抵特别青睐功率低于 750 瓦的助力型电动自行车,这些车型符合现有的联邦机动车定义,同时避免了高功率车型相关的复杂监管规定。该政策的实施与加州、科罗拉多和佛蒙特州的州级奖励计划重迭,累积节省的费用将使电动自行车的价格与公共交通月票的价格相媲美。
企业微型出行车辆的兴起
随着电动自行车被公认为员工通勤、园区交通和最后一公里配送的理想解决方案,企业车队采用电动自行车的速度正在加快,其部署成本远低于传统车队。受都市区配送限制和碳中和倡议的推动,包括亚马逊、UPS 和 DHL 在内的多家大型公司已将其电动货运自行车项目扩展至 2024 年。车队营运商报告称,在人口密集的城市环境中,与基于货车的配送系统相比,电动自行车可节省 40% 至 60% 的成本,同时在交通尖峰时段时段也能实现更优异的配送性能。这种企业级应用正在形成批量采购的趋势,并影响製造商的生产计画和技术开发重点,尤其是在商用级零件和车队管理软体整合方面。
北美自由贸易组织(NAFTA)贸易区锂离子电池供应短缺
北美自由贸易协定(北美自由贸易组织(NAFTA)框架下锂离子电池供应受限,导致成本压力和交货延迟,尤其对那些没有成熟亚洲供应链的电动自行车製造商而言更是如此。贸易政策转向本地采购要求,这与北美电池目前的产能存在衝突,因为北美生产设施主要供应汽车应用领域,而微出行领域的供应有限。这种供需失衡迫使製造商在高成本的本地采购和进口电池可能面临的关税风险之间做出选择,这可能会压缩利润空间并限制产品线的扩展。电池短缺对中阶市场的影响尤其显着,因为成本优化是该市场实现大众化的关键。同时,高端製造商则透过多元化的采购策略来保持柔软性。
细分市场分析
到2025年,脚踏辅助系统将维持78.98%的市场份额,这反映出消费者倾向于使用马达辅助来增强自然的骑乘体验。高速电动辅助自行车将成为成长最快的细分市场,到2031年复合年增长率将达到17.54%,这主要得益于3级法规的扩展以及郊区通勤者对汽车替代方案的需求。油门辅助系统占据一个特殊的市场定位,主要用于无障碍出行和商业配送场景,在这些场景中,即时动力输出具有营运优势。推进方式的演变反映了交通运输电气化的大趋势,其中,脚踏整合系统在使用者控制和能源效率方面优于纯油门系统。
法规结构正在明确不同动力系统之间的区别,北美各地的自行车道和停车法规对辅助自行车给予了优先待遇。高速辅助自行车的成长与专用自行车道基础设施的建设密切相关,使得高速骑乘成为长途通勤的实用且安全之选。
到2025年,都市区用途将占据81.10%的市场份额,而货运/实用型自行车则以20.98%的复合年增长率加速成长,这主要得益于电子商务配送经济模式的转变,它正在改变最后一公里物流的格局。城市用途自行车充分利用了现有的自行车基础设施和消费者的出行意识,而货运用途自行车则开启了以往由汽车主导的全新应用场景。健行/山地自行车凭藉其专业的地形适应能力,迎合了休閒市场的需求,但季节性的使用模式和小众消费群体限制了其成长。这种按用途分類的细分反映了交通途径的替代,而非简单的自行车市场扩张,这表明都市区出行偏好正在发生根本性的转变。
尤其是在人口密集的城市环境中,电动自行车在商业货运领域的应用正在加速成长,因为停车限制和拥塞费使得电动自行车配送系统具有成本优势。随着铁路用地被开发利用以及户外休閒基础设施的投资,健行类应用也越来越受欢迎,但季节性需求限制了其全年成长潜力。
锂离子电池预计在2025年占据92.10%的市场份额,并在2031年之前保持15.98%的复合年增长率,这反映出技术的成熟和供应链的优化,使得大多数应用无需考虑其他化学体系。虽然铅酸电池在价格敏感型细分市场仍有一席之地,但不断缩小的成本差距和性能优势正在推动锂离子电池在所有细分市场中的普及。电池化学体系的标准化实现了零件的互通性,并促进了服务网络的建立,从而形成了生态系统效应,即使供应链存在一些脆弱性,也能增强锂离子电池的优势。
更高的能量密度和更快的充电速度推动了锂离子电池领域的持续投资,製造商专注于优化电池化学成分,而不是其他替代技术。电池管理系统正变得越来越集成,从而实现预测性维护和性能优化,延长运作使用寿命并降低整体拥有成本。
其他福利:
- Excel格式的市场预测(ME)表
- 分析师支持(3个月)
目录
第一章 引言
- 研究假设和市场定义
- 调查范围
第二章调查方法
第三章执行摘要
第四章:主要产业趋势
- 年度自行车销售额
- 平均销售价格和价格范围构成
- 电动自行车及其零件的跨境贸易(进口/出口)
- 电动自行车在自行车总销量中所占的百分比
- 单程通勤距离 5-15 公里的通勤者 (%)
- 自行车和电动式自行车租赁市场规模
- 电动自行车电池组价格
- 电池化学价格比较
- 最后一公里(超本地化)配送量
- 受保护的自行车道(公里)
- 健行和户外活动的参与率
- 电动自行车电池容量(瓦时)
- 都市交通壅塞指数
- 法律规范
- 电动自行车型式认证与认可
- 进出口和贸易法规
- 分类、道路使用和使用者规定
- 电池、充电器和充电安全
第五章 市场情势
- 市场概览
- 市场驱动因素
- 轻型电动车联邦税额扣抵
- 企业微型出行车辆的兴起
- 互联远端资讯处理和OTA更新集成
- 扩大3级(时速28英哩)电动自行车法规
- 利用废弃铁路场址发展旅游走廊
- 电池即服务 (BaaS) 订阅模式
- 市场限制
- 北美自由贸易协定(北美自由贸易组织(NAFTA))地区锂离子电池供应短缺
- 商用电动货车保险费上涨
- 市政限速低于每小时 20 英里
- 持续关注火灾风险
- 价值/价值链分析
- 技术展望
- 波特五力模型
- 新进入者的威胁
- 供应商的议价能力
- 买方的议价能力
- 替代品的威胁
- 竞争对手之间的竞争
第六章 市场规模及成长预测(价值(美元)及销售量(单位))
- 依推进类型
- 脚踏辅助
- 速度踏板
- 附油门辅助
- 透过使用
- 货物/多用途
- 城市/都市区
- 健行/登山
- 依电池类型
- 铅酸电池
- 锂离子电池
- 其他的
- 按下马达安装位置
- 轮毂(前/后)
- 中置马达
- 透过驱动系统
- 链传动
- 皮带传动
- 透过马达输出
- 小于250瓦
- 251~350 W
- 351~500 W
- 501~600 W
- 600瓦或以上
- 价格范围(美元)
- 低于1000
- 1,000~1,499
- 1,500~2,499
- 2,500~3,499
- 3,500~5,999
- 超过6000
- 按销售管道
- 在线的
- 离线
- 按最终用途
- 商业航运
- 零售和商品分销
- 食品和饮料配送
- 服务供应商
- 个人及家庭用途
- 对机构而言
- 其他的
- 商业航运
- 按国家/地区
- 美国
- 加拿大
- 墨西哥
第七章 竞争情势
- 市场集中度
- 策略趋势
- 市占率分析
- 公司简介
- Trek Bicycle Corporation
- Giant Manufacturing Co.
- Rad Power Bikes
- Specialized Bicycle Components
- Cycling Sports Group, Inc.(Cannondale)
- Ride Aventon Inc.
- Yamaha Bicycles
- Bosch eBike Systems
- Shimano Inc.
- Riese and Muller
- VanMoof
- Propella Electric Bikes
- QuietKat(Vista Outdoor)
- Lectric eBikes
- Stromer
- Pedego Electric Bikes
- Bulls Bike USA
- Juiced Bikes
- Velotric
- Magnum Bikes
第八章:市场机会与未来展望
- 评估差距和未满足的需求
第九章:CEO们需要思考的关键策略问题
The North America E-bike market was valued at USD 4.11 billion in 2025 and estimated to grow from USD 4.41 billion in 2026 to reach USD 6.23 billion by 2031, at a CAGR of 7.18% during the forecast period (2026-2031).
The combination of federal purchase incentives, growing urban cycling infrastructure, and changing commuter preferences keeps demand on a steady upward trajectory. Rapid rollout of protected bike lanes and employer-sponsored micromobility programs is widening the addressable customer base beyond core recreational cyclists. Federal and state fiscal measures that lower upfront prices have already shortened payback periods relative to public transit passes.
North America E-bike Market Trends and Insights
Federal Tax Credits for Light Electric Vehicles
Federal tax credit expansion under the E-BIKE Act framework creates direct consumer incentives worth up to USD 1,500 per qualifying electric bicycle purchase, fundamentally altering price elasticity calculations for middle-income households. This policy mechanism mirrors successful electric vehicle adoption strategies, where upfront cost reduction accelerates market penetration beyond early adopter segments. The credit structure particularly benefits pedal-assisted models under 750W, aligning with existing federal motor vehicle definitions while avoiding regulatory complexity associated with higher-powered variants. Implementation timing coincides with state-level incentive programs in California, Colorado, and Vermont, creating cumulative savings that position e-bikes competitively against public transportation monthly passes.
Rising Corporate Micromobility Fleets
Corporate fleet adoption accelerates as companies recognize e-bikes as solutions for employee commuting, campus transportation, and last-mile delivery operations, with deployment costs significantly lower than traditional vehicle fleets. Major corporations, including Amazon, UPS, and DHL, expanded e-cargo bike programs throughout 2024, driven by urban delivery restrictions and carbon neutrality commitments. Fleet operators report 40-60% cost reductions compared to van-based delivery systems in dense urban environments, while achieving superior delivery times during peak traffic periods. This corporate adoption creates bulk purchasing dynamics that influence manufacturer production planning and technology development priorities, particularly for commercial-grade components and fleet management software integration.
Tightening Lithium-Ion Cell Supply in NAFTA Region
Lithium-ion cell supply constraints within NAFTA territories create cost pressures and delivery delays that disproportionately impact e-bike manufacturers without established Asian supply relationships. Trade policy shifts toward regional content requirements conflict with current battery cell production capacity, as North American facilities primarily serve automotive applications with limited availability for micromobility segments. This supply-demand imbalance forces manufacturers to choose between higher-cost regional sourcing and potential tariff exposure on imported cells, creating margin compression that may limit product portfolio expansion. Cell shortage particularly affects mid-range price segments where cost optimization remains critical for mass market adoption, while premium manufacturers maintain flexibility through diversified sourcing strategies.
Other drivers and restraints analyzed in the detailed report include:
- Integration of Connected Telematics and OTA Updates
- Expansion of Class 3 (28 mph) E-Bike Regulations
- Insurance Premium Hikes for Commercial E-Cargo Fleets
For complete list of drivers and restraints, kindly check the Table Of Contents.
Segment Analysis
Pedal-assisted systems maintain a 78.98% market share in 2025, reflecting consumer preference for natural cycling experiences enhanced by motor assistance rather than replaced by it. Speed pedelecs emerge as the fastest-growing segment at 17.54% CAGR through 2031, driven by expanding Class 3 regulations and suburban commuter adoption seeking car-replacement solutions. Throttle-assisted variants occupy a specialized niche, primarily serving accessibility applications and commercial delivery scenarios where instant power delivery provides operational advantages. The propulsion type evolution reflects broader transportation electrification trends, where user control and energy efficiency considerations favor pedal-integrated systems over purely throttle-based alternatives.
Regulatory frameworks increasingly distinguish between propulsion types, with pedal-assisted models receiving preferential treatment in bike lane access and parking regulations across North American jurisdictions. Speed pedelec growth correlates with infrastructure improvements on dedicated cycling corridors, where higher speeds become practical and safe for longer-distance commuting applications.
City/urban applications dominate with 81.10% market share in 2025, yet cargo/utility variants accelerate at 20.98% CAGR as e-commerce delivery economics reshape last-mile logistics calculations. Urban models benefit from established cycling infrastructure and consumer familiarity, while cargo configurations unlock new use cases previously dominated by motorized vehicles. Trekking/mountain segments serve recreational markets with specialized terrain capabilities, though growth remains constrained by seasonal usage patterns and niche consumer bases. This application segmentation reflects transportation mode substitution rather than simple cycling market expansion, indicating fundamental shifts in urban mobility preferences.
Commercial cargo adoption particularly accelerates in dense urban environments where parking restrictions and congestion charges create cost advantages for e-bike delivery systems. Trekking applications gain traction through rail-trail tourism development and outdoor recreation infrastructure investments, though seasonal demand patterns limit year-round growth potential.
Lithium-ion batteries command 92.10% market share in 2025 while maintaining 15.98% CAGR through 2031, reflecting technology maturation and supply chain optimization that eliminates alternative chemistry considerations for most applications. Lead-acid alternatives persist in price-sensitive segments, though declining cost differentials and performance advantages favor lithium-ion adoption across all market tiers. Battery chemistry standardization enables component interoperability and service network development, creating ecosystem effects that reinforce lithium-ion dominance despite supply chain vulnerabilities.
Energy density improvements and charging speed enhancements drive continued lithium-ion investment, with manufacturers focusing on cell chemistry optimization rather than alternative technologies. Battery management system integration becomes increasingly sophisticated, enabling predictive maintenance and performance optimization that extends operational lifecycles while reducing total cost of ownership.
The North America E-Bike Market Report is Segmented by Propulsion Type (Pedal Assisted, and More), Application Type (Cargo/Utility, and More), Battery Type (Li-Ion, and More), Motor Placement (Hub Front/Rear, Mid-Drive), Drive Systems (Chain Drive, Belt Drive), Motor Power (Less Than 250 W, and More), Price Band, Sales Channel, End Use and by Country. The Market Forecasts are Provided in Terms of Value (USD) and Volume (Units).
List of Companies Covered in this Report:
- Trek Bicycle Corporation
- Giant Manufacturing Co.
- Rad Power Bikes
- Specialized Bicycle Components
- Cycling Sports Group, Inc. (Cannondale)
- Ride Aventon Inc.
- Yamaha Bicycles
- Bosch eBike Systems
- Shimano Inc.
- Riese and Muller
- VanMoof
- Propella Electric Bikes
- QuietKat (Vista Outdoor)
- Lectric eBikes
- Stromer
- Pedego Electric Bikes
- Bulls Bike USA
- Juiced Bikes
- Velotric
- Magnum Bikes
Additional Benefits:
- The market estimate (ME) sheet in Excel format
- 3 months of analyst support
TABLE OF CONTENTS
1 Introduction
- 1.1 Study Assumptions and Market Definition
- 1.2 Scope of the Study
2 Research Methodology
3 Executive Summary
4 Key Industry Trends
- 4.1 Annual Bicycle Sales
- 4.2 Average Selling Price and Price-Band Mix
- 4.3 Cross-Border Trade in E-Bikes and Parts (Imports/Exports)
- 4.4 E-Bike Share of Total Bicycle Sales
- 4.5 Commuters with 5 to 15 km One-Way Trips (%)
- 4.6 Bicycle/E-Bike Rental Market Size
- 4.7 E-Bike Battery Pack Price
- 4.8 Battery Chemistry Price Comparison
- 4.9 Last-Mile (Hyper-Local) Delivery Volume
- 4.10 Protected Bicycle Lanes (km)
- 4.11 Trekking/Outdoor Activity Participation
- 4.12 E-Bike Battery Capacity (Wh)
- 4.13 Urban Traffic Congestion Index
- 4.14 Regulatory Framework
- 4.14.1 Homologation and Certification of E-Bicycles
- 4.14.2 Export-Import and Trade Regulation
- 4.14.3 Classification, Road Access and User Rules
- 4.14.4 Battery, Charger and Charging Safety
5 Market Landscape
- 5.1 Market Overview
- 5.2 Market Drivers
- 5.2.1 Federal Tax Credits for Light Electric Vehicles
- 5.2.2 Rising Corporate Micromobility Fleets
- 5.2.3 Integration of Connected Telematics and OTA Updates
- 5.2.4 Expansion of Class 3 (28 mph) E-Bike Regulations
- 5.2.5 Growth of Rail-Trail Tourism Corridors
- 5.2.6 Battery-as-a-Service Subscription Models
- 5.3 Market Restraints
- 5.3.1 Tightening Lithium-Ion Cell Supply in NAFTA Region
- 5.3.2 Insurance Premium Hikes for Commercial E-Cargo Fleets
- 5.3.3 Municipal Speed-Limit Caps below 20 mph
- 5.3.4 Persistent Perception of Fire-Hazard Risk
- 5.4 Value/Supply-Chain Analysis
- 5.5 Technological Outlook
- 5.6 Porter's Five Forces
- 5.6.1 Threat of New Entrants
- 5.6.2 Bargaining Power of Suppliers
- 5.6.3 Bargaining Power of Buyers
- 5.6.4 Threat of Substitutes
- 5.6.5 Competitive Rivalry
6 Market Size and Growth Forecasts (Value (USD) and Volume (Units))
- 6.1 By Propulsion Type
- 6.1.1 Pedal Assisted
- 6.1.2 Speed Pedelec
- 6.1.3 Throttle Assisted
- 6.2 By Application Type
- 6.2.1 Cargo/Utility
- 6.2.2 City/Urban
- 6.2.3 Trekking/Mountain
- 6.3 By Battery Type
- 6.3.1 Lead Acid Battery
- 6.3.2 Lithium-ion Battery
- 6.3.3 Others
- 6.4 By Motor Placement
- 6.4.1 Hub (front/rear)
- 6.4.2 Mid-drive
- 6.5 By Drive Systems
- 6.5.1 Chain Drive
- 6.5.2 Belt Drive
- 6.6 By Motor Power
- 6.6.1 Less than 250 W
- 6.6.2 251 to 350 W
- 6.6.3 351 to 500 W
- 6.6.4 501 to 600 W
- 6.6.5 More than 600 W
- 6.7 By Price Band (USD)
- 6.7.1 Up to 1,000
- 6.7.2 1,000 to 1,499
- 6.7.3 1,500 to 2,499
- 6.7.4 2,500 to 3,499
- 6.7.5 3,500 to 5,999
- 6.7.6 Above 6,000
- 6.8 By Sales Channel
- 6.8.1 Online
- 6.8.2 Offline
- 6.9 By End Use
- 6.9.1 Commercial Delivery
- 6.9.1.1 Retail and Goods Delivery
- 6.9.1.2 Food and Beverage Delivery
- 6.9.2 Service Providers
- 6.9.3 Personal and Family Use
- 6.9.4 Institutional
- 6.9.5 Others
- 6.9.1 Commercial Delivery
- 6.10 By Country
- 6.10.1 United States
- 6.10.2 Canada
- 6.10.3 Mexico
7 Competitive Landscape
- 7.1 Market Concentration
- 7.2 Strategic Moves
- 7.3 Market Share Analysis
- 7.4 Company Profiles (Includes Global level Overview, Market level overview, Core Segments, Financials as available, Strategic Information, Market Rank/Share for key companies, Products and Services, and Recent Developments)
- 7.4.1 Trek Bicycle Corporation
- 7.4.2 Giant Manufacturing Co.
- 7.4.3 Rad Power Bikes
- 7.4.4 Specialized Bicycle Components
- 7.4.5 Cycling Sports Group, Inc. (Cannondale)
- 7.4.6 Ride Aventon Inc.
- 7.4.7 Yamaha Bicycles
- 7.4.8 Bosch eBike Systems
- 7.4.9 Shimano Inc.
- 7.4.10 Riese and Muller
- 7.4.11 VanMoof
- 7.4.12 Propella Electric Bikes
- 7.4.13 QuietKat (Vista Outdoor)
- 7.4.14 Lectric eBikes
- 7.4.15 Stromer
- 7.4.16 Pedego Electric Bikes
- 7.4.17 Bulls Bike USA
- 7.4.18 Juiced Bikes
- 7.4.19 Velotric
- 7.4.20 Magnum Bikes
8 Market Opportunities and Future Outlook
- 8.1 White-Space and Unmet-Need Assessment
9 Key Strategic Questions for E-Bike CEOs
 电动自行车市场分析及预测(至2035年):依类型、产品类型、技术、组件、应用、最终用户、功能、安装类型及模式划分
 电动自行车市场规模、份额和趋势分析报告:按驱动系统、电池类型、最终用途、地区和细分市场预测(2026-2033 年)
 电动自行车市场-全球产业规模、份额、趋势、机会及预测(按电池、类型、车架材料、地区和竞争格局划分,2021-2031年)
 小型电动自行车打气筒市场按产品类型、应用、通路通路、销售管道和电源划分-2026年至2032年全球预测电动自行车计量市场按产品类型、电池容量、马达类型和分销管道划分 - 全球预测 2026-2032电动越野摩托车市场:按车辆类型、动力系统、电池类型、最终用户、销售管道、价格范围划分,全球预测(2026-2032年)脚踏辅助自行车电池市场:按自行车类型、电池化学成分、电池容量、销售管道、应用和最终用户划分-2026-2032年全球预测
 德国电动自行车:市场占有率分析、产业趋势与统计、成长预测(2026-2031)欧洲电动自行车市场-份额分析、产业趋势、统计数据和成长预测(2026-2031)电动自行车:市场占有率分析、产业趋势与统计、成长预测(2026-2031)