


 |
市场调查报告书
商品编码
1911744
电动自行车:市场占有率分析、产业趋势与统计、成长预测(2026-2031)E-Bike - Market Share Analysis, Industry Trends & Statistics, Growth Forecasts (2026 - 2031) |
||||||
※ 本网页内容可能与最新版本有所差异。详细情况请与我们联繫。
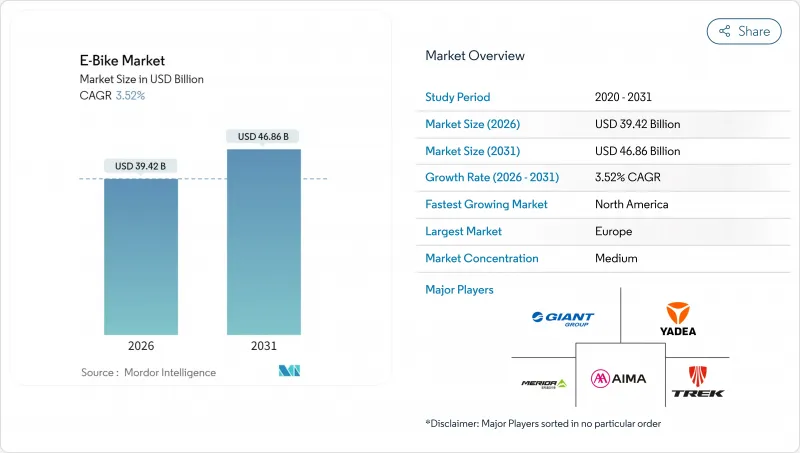
预计到 2026 年,电动自行车市场价值将达到 394.2 亿美元,高于 2025 年的 380.8 亿美元。
预计到 2031 年将达到 468.6 亿美元,2026 年至 2031 年的复合年增长率为 3.52%。
这种稳定扩张反映了自行车市场从早期采用阶段向主流应用阶段的转变,主要得益于企业租赁计划的推动,这些计划允许员工透过工资扣除的方式租用自行车。市场需求正转向价格在3500至5999美元之间的高阶车型,该价格区间成长最为迅速。同时,诸如法国4,000欧元(约4,622美元)的补贴和波兰3亿波币(约8,100万美元)的补贴计画等定向补贴政策,持续扩大目标客群。电池技术仍然是关键,锂离子电池仍占据市场主导地位,但钠离子电池和固体电池正在兴起,以降低对中国原料供应的依赖风险。
全球电动自行车市场趋势与洞察
都市区拥塞推动了微出行
在一线城市,停车位价格高达3万美元,因此,对于5-15公里的短程通勤(占都市区出行总量的40%)而言,电动自行车是一种经济实惠的选择。伦敦超低排放区(ULEZ)的扩大以及7,000英镑(约9,319美元)的车辆报废补贴,促使快递公司纷纷采用电动自行车。同时,亚马逊和谷歌等公司也为电动自行车提供月租补贴,以缓解停车难题并实现永续性目标。
锂离子电池的能量密度和成本降低
自2010年以来,锂离子电池组的价格已大幅下降,续航里程超过100公里的电动自行车售价现已低于2,000美元。快速充电设计可在30分钟内充电至80%,为高运转率的商业车队部署铺平了道路。钠离子电池原型可望在成本降低30%的情况下实现相近的循环寿命,而固态电池技术蓝图的目标是到2028年将能量密度提高一倍。
电池起火和更严格的安全标准
2023年,纽约市共发生187起电动车火灾,四年损失高达5.186亿美元。加州SB 1271法案和UL 2849标准要求使用认证电池组,这将使每辆车的成本增加200至500美元。为了符合相关法规,製造商正在加大对温度控管技术和远距离诊断系统的投入。
细分市场分析
预计到2025年,助力型自行车将占据78.90%的市场份额,这主要得益于欧盟法规将其归类为自行车的有利条件。速度辅助型自行车(最高时速可达45公里/小时)正以4.02%的复合年增长率成长,这主要受人口密集城市通勤者对类似汽车出行速度的需求驱动。
製造商正在将人工智慧演算法整合到马达控制器中,以便根据地形和骑乘习惯优化功率输出。禧玛诺即将发布的自动变速传动系统就是一个很好的例子,它展示了供应商如何将高扭矩马达与智慧变速箱相结合,以更好地吸引都市区白领。
由于城市自行车通勤轻鬆便捷,到 2025 年将占据 76.05% 的市场。同时,随着旅游业者越来越多地将电动辅助车辆作为标准配置,旅行/山地车型将继续以 3.65% 的复合年增长率成长。
业者认为,更广泛的使用者群体、年龄较大的骑乘者以及不同体能水平的群体是关键的成长要素,随着步道法规的演变,预计这群人将进一步渗透到国家公园和度假区。
到了2025年,锂离子电池将占据电动自行车市场98.41%的份额,这充分体现其成本竞争力和高能量密度。 「其他」类别(包括钠离子电池和早期固态电池原型)正以4.32%的复合年增长率成长,因为各品牌都在寻求分散原料风险。
为了降低对中国加工环节的依赖,原始设备製造商(OEM)正同时购买方形和圆柱形电池。如果钠离子电池在2027年之前实现价格竞争力,这种电池技术可望从传统电池组中夺取两位数的市场份额。
区域分析
到2025年,欧洲将占全球电动自行车市场收入的54.80%。光是德国一国,电动自行车保有量就将达到1,570万辆,2024年销量预计为210万辆,主要得益于多名员工的薪资扣除计画。荷兰各年龄层的电动自行车普及率已接近饱和,而法国为低收入者提供的4,000欧元(约4,622美元)补贴则持续吸引新用户。完善的自行车道网路和以自行车为先的城市规划将使欧洲保持可持续的竞争优势。
北美虽然目前规模较小,但却是成长最快的地区,年复合成长率达7.19%。加州和纽约州提供的最高可达1,750美元的州政府补贴,加上企业补贴,正在刺激被压抑的需求。加拿大正在投资4亿加币(约2.86亿美元)建设基础设施,连接电动自行车道和充电桩,为通勤者和外送骑手打造端到端的车队。
亚太地区市场构成多元化。中国是美国电动自行车进口的主要供应国,并在2024年取得了显着的出口收入。印度在2024年实现了电动两轮车的广泛普及,儘管轻型机踏车仍然超过助力车型。日本和韩国专注于高科技产品,瞄准高端市场,而澳洲则利用生态旅游路线来推动健行的需求。各地区的法规和收入水准决定了销售管道、定价和规格策略的差异。
其他福利:
- Excel格式的市场预测(ME)表
- 3个月的分析师支持
目录
第一章 引言
- 研究假设和市场定义
- 调查范围
第二章调查方法
第三章执行摘要
第四章:主要产业趋势
- 年度自行车销售额
- 平均销售价格和价格范围构成
- 电动自行车及其零件的跨境贸易(进口/出口)
- 电动自行车占自行车总销量的百分比
- 单程通勤距离为 5-15 公里的通勤者比例 (%)
- 自行车/电动式自行车租赁市场规模
- 电动自行车电池组价格
- 电池化学价格比较
- 最后一公里(超本地化)配送量
- 受保护的自行车道(公里)
- 健行和户外活动的参与率
- 电动自行车电池容量(瓦时)
- 都市交通壅塞指数
- 法律规范
- 电动自行车型式认证与认可
- 进出口和贸易法规
- 分类、道路使用和使用者规定
- 电池、充电器和充电安全
第五章 市场情势
- 市场概览
- 市场驱动因素
- 都市区拥塞推动了微出行
- 锂离子电池能量密度与成本降低趋势
- 政府激励措施和采购补贴
- 企业员工电动自行车福利计划
- 货运电动自行车保险费折扣
- 电动自行车旅游路线的成长
- 市场限制
- 电池起火和更严格的安全标准
- 与传统自行车相比,初始成本较高
- 发展中地区充电基础设施不足
- 关键矿产供应波动性
- 价值/供应链分析
- 监管环境
- 技术展望
- 波特五力模型
- 新进入者的威胁
- 供应商的议价能力
- 买方的议价能力
- 替代品的威胁
- 竞争对手之间的竞争
第六章 市场规模及成长预测(价值及数量)
- 依推进类型
- 踏板辅助
- 速度踏板
- 油门辅助
- 按应用程式类型
- 货物/多用途
- 城镇/城市
- 健行/登山
- 依电池类型
- 铅酸电池
- 锂离子电池
- 其他的
- 按下马达安装位置
- 轮毂(前/后)
- 中置马达
- 透过驱动系统
- 链传动
- 皮带传动
- 透过马达输出
- 小于250瓦
- 251~350 W
- 351~500 W
- 501~600 W
- 600瓦或以上
- 按价格范围
- 不到1000美元
- 1,000-1,499 美元
- 1500-2499美元
- 2,500-3,499 美元
- 3,500 美元至 5,999 美元
- 超过6000美元
- 按销售管道
- 在线的
- 离线
- 按最终用途
- 商业航运
- 零售和商品分销
- 食品和饮料配送
- 服务供应商
- 个人和家庭用途
- 公共利益
- 其他的
- 商业航运
- 按地区
- 北美洲
- 美国
- 加拿大
- 北美其他地区
- 南美洲
- 阿根廷
- 巴西
- 南美洲其他地区
- 欧洲
- 德国
- 英国
- 法国
- 义大利
- 西班牙
- 荷兰
- 奥地利
- 瑞典
- 瑞士
- 其他欧洲
- 亚太地区
- 中国
- 印度
- 日本
- 韩国
- 澳洲
- 纽西兰
- 亚太其他地区
- 中东和非洲
- 沙乌地阿拉伯
- 阿拉伯聯合大公国
- 南非
- 其他中东和非洲地区
- 北美洲
第七章 竞争情势
- 市场集中度
- 策略趋势
- 市占率分析
- 公司简介
- Aima Technology Group Co., Ltd.
- Canyon Bicycles GmbH
- Fritzmeier Systems GmbH & Co. KG(M1 Sporttechnik)
- Giant Manufacturing Co., Ltd.
- Jiangsu Xinri E-Vehicle Co., Ltd.
- Luyuan Electric Vehicle Co., Ltd.
- Merida Industry Co., Ltd.
- Myvelo Co., Ltd.
- Rad Power Bikes Inc.
- Riese & Muller GmbH
- Pon Holdings BV
- Samchuly Bicycle
- Specialized Bicycle Components, Inc.
- Dongguan Tailing Electric Vehicle Co., Ltd
- Tianjin Fuji-Ta Bicycle Co., Ltd.
- Trek Bicycle Corporation
- VanMoof BV
- Yadea Group Holdings Ltd.
- Yamaha Motor Co., Ltd.
第八章:市场机会与未来展望
第九章:CEO们需要思考的关键策略问题
e-bike market size in 2026 is estimated at USD 39.42 billion, growing from 2025 value of USD 38.08 billion with 2031 projections showing USD 46.86 billion, growing at 3.52% CAGR over 2026-2031.
The measured expansion reflects the transition from early adoption to mainstream use as corporate leasing schemes now give employees access to salary-sacrifice bikes. Demand is tilting toward premium models priced USD 3,500-5,999, the fastest-growing band, while targeted subsidies-France's EUR 4,000 (~USD 4,622) incentive and Poland's PLN 300 million (~USD 81 million) program-continue to widen the addressable base. Battery technology remains a cornerstone; lithium-ion captures a major share, yet sodium-ion and solid-state chemistries are lining up to ease China-centric raw-material risk.
Global E-Bike Market Trends and Insights
Urban Congestion Driving Micro-Mobility
Parking spaces in tier-1 cities cost as high as USD 30,000, making e-bikes a cost-efficient commute tool over 5-15 km trips-the distance that accounts for 40% of urban journeys. London's ULEZ expansion, plus GBP 7,000 (~USD 9,319) scrappage grants, has accelerated uptake among couriers, while companies such as Amazon and Google subsidize monthly e-bike subscriptions to ease parking stress and hit sustainability targets .
Li-ion Battery Energy-Density and Cost Declines
Lithium-ion pack prices have declined significantly since 2010, moving 100+ km range bikes under the USD 2,000 mark. Fast-charge designs now reach 80% in 30 minutes, opening doors for high-utilization commercial fleets. Sodium-ion prototypes promise similar cycle life at 30% reduced cost, while solid-state roadmaps target 2X energy density by 2028.
Battery-Fire Incidents and Stricter Safety Norms
NYC recorded 187 e-mobility fires in 2023, lifting four-year costs to USD 518.6 million. California's SB 1271 and the UL 2849 standard now require certified packs, adding USD 200-500 per unit. Manufacturers are investing in thermal management and remote diagnostics to keep pace.
Other drivers and restraints analyzed in the detailed report include:
- Government Incentives and Purchase Subsidies
- Corporate Employee E-Bike Benefit Programs
- High Upfront Cost vs. Conventional Bikes
For complete list of drivers and restraints, kindly check the Table Of Contents.
Segment Analysis
The market size for pedal-assist models reached a commanding 78.90% share in 2025, benefiting from favorable EU regulations that classify them as bicycles. Speed-pedelec variants, offering assistance up to 45 km/h, are charting a 4.02% CAGR as commuters seek car-like travel times in dense cities.
Manufacturers are layering AI algorithms onto motor controllers to optimize output by terrain and rider habits. Shimano's forthcoming automatic-shift drivetrain illustrates how suppliers bundle smart gearboxes with high-torque motors, strengthening their appeal among urban professionals.
City/urban bikes generated 76.05% of the market share in 2025 as urban riders opted for sweat-free commuting. Trekking/mountain models, however, are advancing at 3.65% CAGR, spurred by tour operators that now default to e-assisted fleets.
Operators see expanded demographics, older cyclists and mixed-fitness groups, as key growth levers. As trail access rules evolve, the segment is poised for further penetration into national parks and resort destinations.
Lithium-ion cells controlled 98.41% of the e-bike market share in 2025, underlining cost leadership and energy density. The "Others" bucket, housing sodium-ion and early solid-state prototypes, is growing at 4.32% CAGR as brands hedge raw-material exposure.
OEMs are dual-sourcing prismatic and cylindrical formats to mitigate China-centric processing. Should sodium-ion hit expected price parity by 2027, the chemistry could siphon double-digit share from legacy packs.
The Global E-Bike Market Report is Segmented by Propulsion Type (Pedal Assisted, Speed Pedelec, and More), Application Type (Cargo/Utility, City/Urban, and More), Battery Type (Lead Acid Battery, Lithium-Ion Battery, and More), Motor Placement (Hub (Front/Rear), Mid-Drive), Drive Systems, Motor Power, Price Band, Sales Channel, End Use, and Geography. The Market Forecasts are Provided in Terms of Value (USD) and Volume (Units).
Geography Analysis
Europe retained 54.80% of the 2025 e-bike market revenue. Germany alone has 15.7 million units in circulation and sold 2.1 million in 2024, helped by salary-sacrifice programs covering several workers . The Netherlands shows saturation traits, with e-bikes normalized across age groups, while France's EUR 4,000 (~USD 4,622) low-income grant keeps funneling new buyers. Continuous path networks and bicycle-first urban planning remain Europe's durable competitive edge.
North America, though smaller today, is the quickest-growing region at 7.19% CAGR. State rebates of up to USD 1,750 in California and New York, alongside corporate stipends, are unlocking latent demand. Canada's CAD 400 million (~USD 286 million) infrastructure rollout links e-bike lanes to charging nodes, creating end-to-end fleets for commuters and delivery riders alike.
Asia-Pacific reflects a tapestry of conditions. China supplies a major share of e-bike imports in the United States and posted notable export receipts in 2024. India crossed a significant electric two-wheeler mark in 2024, though mopeds still outweigh pedal-assist formats. Japan and South Korea cater to premium, tech-heavy niches, while Australia leans on eco-tourism routes to lift trekking sales. Localized regulation and income profiles dictate tailored channel, price, and specification strategies.
- Aima Technology Group Co., Ltd.
- Canyon Bicycles GmbH
- Fritzmeier Systems GmbH & Co. KG (M1 Sporttechnik)
- Giant Manufacturing Co., Ltd.
- Jiangsu Xinri E-Vehicle Co., Ltd.
- Luyuan Electric Vehicle Co., Ltd.
- Merida Industry Co., Ltd.
- Myvelo Co., Ltd.
- Rad Power Bikes Inc.
- Riese & Muller GmbH
- Pon Holdings B.V.
- Samchuly Bicycle
- Specialized Bicycle Components, Inc.
- Dongguan Tailing Electric Vehicle Co., Ltd
- Tianjin Fuji-Ta Bicycle Co., Ltd.
- Trek Bicycle Corporation
- VanMoof BV
- Yadea Group Holdings Ltd.
- Yamaha Motor Co., Ltd.
Additional Benefits:
- The market estimate (ME) sheet in Excel format
- 3 months of analyst support
TABLE OF CONTENTS
1 Introduction
- 1.1 Study Assumptions & Market Definition
- 1.2 Scope of the Study
2 Research Methodology
3 Executive Summary
4 Key Industry Trends
- 4.1 Annual Bicycle Sales
- 4.2 Average Selling Price & Price-Band Mix
- 4.3 Cross-Border Trade in E-Bikes & Parts (Imports/Exports)
- 4.4 E-Bike Share of Total Bicycle Sales
- 4.5 Commuters with 5-15 km One-Way Trips (%)
- 4.6 Bicycle/E-Bike Rental Market Size
- 4.7 E-Bike Battery Pack Price
- 4.8 Battery Chemistry Price Comparison
- 4.9 Last-Mile (Hyper-Local) Delivery Volume
- 4.10 Protected Bicycle Lanes (km)
- 4.11 Trekking/Outdoor Activity Participation
- 4.12 E-Bike Battery Capacity (Wh)
- 4.13 Urban Traffic Congestion Index
- 4.14 Regulatory Framework
- 4.14.1 Homologation and Certification of E-Bicycles
- 4.14.2 Export-Import and Trade Regulation
- 4.14.3 Classification, Road Access and User Rules
- 4.14.4 Battery, Charger and Charging Safety
5 Market Landscape
- 5.1 Market Overview
- 5.2 Market Drivers
- 5.2.1 Urban Congestion Driving Micro-Mobility
- 5.2.2 Li-ion Battery Energy-Density and Cost Declines
- 5.2.3 Government Incentives and Purchase Subsidies
- 5.2.4 Corporate Employee E-Bike Benefit Programs
- 5.2.5 Insurance Discounts for Cargo E-Bikes
- 5.2.6 Growth of E-Bike Tourism Routes
- 5.3 Market Restraints
- 5.3.1 Battery-Fire Incidents and Stricter Safety Norms
- 5.3.2 High Upfront Cost vs. Conventional Bikes
- 5.3.3 Limited Charging Infra in Developing Regions
- 5.3.4 Critical-Mineral Supply Volatility
- 5.4 Value / Supply-Chain Analysis
- 5.5 Regulatory Landscape
- 5.6 Technological Outlook
- 5.7 Porter's Five Forces
- 5.7.1 Threat of New Entrants
- 5.7.2 Bargaining Power of Suppliers
- 5.7.3 Bargaining Power of Buyers
- 5.7.4 Threat of Substitutes
- 5.7.5 Competitive Rivalry
6 Market Size & Growth Forecasts (Value (USD) and Volume (Units))
- 6.1 By Propulsion Type
- 6.1.1 Pedal Assisted
- 6.1.2 Speed Pedelec
- 6.1.3 Throttle Assisted
- 6.2 By Application Type
- 6.2.1 Cargo/Utility
- 6.2.2 City/Urban
- 6.2.3 Trekking/Mountain
- 6.3 By Battery Type
- 6.3.1 Lead Acid Battery
- 6.3.2 Lithium-ion Battery
- 6.3.3 Others
- 6.4 By Motor Placement
- 6.4.1 Hub (Front/Rear)
- 6.4.2 Mid-Drive
- 6.5 By Drive Systems
- 6.5.1 Chain Drive
- 6.5.2 Belt Drive
- 6.6 By Motor Power
- 6.6.1 Below 250 W
- 6.6.2 251-350 W
- 6.6.3 351-500 W
- 6.6.4 501-600 W
- 6.6.5 Above 600 W
- 6.7 By Price Band
- 6.7.1 Up to USD 1,000
- 6.7.2 USD 1,000-1,499
- 6.7.3 USD 1,500-2,499
- 6.7.4 USD 2,500-3,499
- 6.7.5 USD 3,500-5,999
- 6.7.6 Above USD 6,000
- 6.8 By Sales Channel
- 6.8.1 Online
- 6.8.2 Offline
- 6.9 By End Use
- 6.9.1 Commercial Delivery
- 6.9.1.1 Retail and Goods Delivery
- 6.9.1.2 Food and Beverage Delivery
- 6.9.2 Service Providers
- 6.9.3 Personal and Family Use
- 6.9.4 Institutional
- 6.9.5 Others
- 6.9.1 Commercial Delivery
- 6.10 By Geography
- 6.10.1 North America
- 6.10.1.1 United States
- 6.10.1.2 Canada
- 6.10.1.3 Rest of North America
- 6.10.2 South America
- 6.10.2.1 Argentina
- 6.10.2.2 Brazil
- 6.10.2.3 Rest of South America
- 6.10.3 Europe
- 6.10.3.1 Germany
- 6.10.3.2 United Kingdom
- 6.10.3.3 France
- 6.10.3.4 Italy
- 6.10.3.5 Spain
- 6.10.3.6 Netherlands
- 6.10.3.7 Austria
- 6.10.3.8 Sweden
- 6.10.3.9 Switzerland
- 6.10.3.10 Rest of Europe
- 6.10.4 Asia-Pacific
- 6.10.4.1 China
- 6.10.4.2 India
- 6.10.4.3 Japan
- 6.10.4.4 South Korea
- 6.10.4.5 Australia
- 6.10.4.6 New Zealand
- 6.10.4.7 Rest of Asia-Pacific
- 6.10.5 Middle East and Africa
- 6.10.5.1 Saudi Arabia
- 6.10.5.2 United Arab Emirates
- 6.10.5.3 South Africa
- 6.10.5.4 Rest of the Middle East and Africa
- 6.10.1 North America
7 Competitive Landscape
- 7.1 Market Concentration
- 7.2 Strategic Moves
- 7.3 Market Share Analysis
- 7.4 Company Profiles (Includes Global Level Overview, Market Level Overview, Core Segments, Financials as Available, Strategic Information, Market Rank/Share for Key Companies, Products and Services, SWOT Analysis, and Recent Developments)
- 7.4.1 Aima Technology Group Co., Ltd.
- 7.4.2 Canyon Bicycles GmbH
- 7.4.3 Fritzmeier Systems GmbH & Co. KG (M1 Sporttechnik)
- 7.4.4 Giant Manufacturing Co., Ltd.
- 7.4.5 Jiangsu Xinri E-Vehicle Co., Ltd.
- 7.4.6 Luyuan Electric Vehicle Co., Ltd.
- 7.4.7 Merida Industry Co., Ltd.
- 7.4.8 Myvelo Co., Ltd.
- 7.4.9 Rad Power Bikes Inc.
- 7.4.10 Riese & Muller GmbH
- 7.4.11 Pon Holdings B.V.
- 7.4.12 Samchuly Bicycle
- 7.4.13 Specialized Bicycle Components, Inc.
- 7.4.14 Dongguan Tailing Electric Vehicle Co., Ltd
- 7.4.15 Tianjin Fuji-Ta Bicycle Co., Ltd.
- 7.4.16 Trek Bicycle Corporation
- 7.4.17 VanMoof BV
- 7.4.18 Yadea Group Holdings Ltd.
- 7.4.19 Yamaha Motor Co., Ltd.
8 Market Opportunities & Future Outlook
9 Key Strategic Questions for E-Bikes CEOs
 电动自行车市场分析及预测(至2035年):依类型、产品类型、技术、组件、应用、最终用户、功能、安装类型及模式划分
 电动自行车市场规模、份额和趋势分析报告:按驱动系统、电池类型、最终用途、地区和细分市场预测(2026-2033 年)
 电动自行车市场-全球产业规模、份额、趋势、机会及预测(按电池、类型、车架材料、地区和竞争格局划分,2021-2031年)
 小型电动自行车打气筒市场按产品类型、应用、通路通路、销售管道和电源划分-2026年至2032年全球预测电动自行车计量市场按产品类型、电池容量、马达类型和分销管道划分 - 全球预测 2026-2032电动越野摩托车市场:按车辆类型、动力系统、电池类型、最终用户、销售管道、价格范围划分,全球预测(2026-2032年)脚踏辅助自行车电池市场:按自行车类型、电池化学成分、电池容量、销售管道、应用和最终用户划分-2026-2032年全球预测
 北美电动自行车市场-份额分析、产业趋势与统计、成长预测(2026-2031)德国电动自行车:市场占有率分析、产业趋势与统计、成长预测(2026-2031)欧洲电动自行车市场-份额分析、产业趋势、统计数据和成长预测(2026-2031)