


 |
市场调查报告书
商品编码
1911419
北美公路货运市场:市场占有率分析、产业趋势与统计、成长预测(2026-2031 年)North America Road Freight Transport - Market Share Analysis, Industry Trends & Statistics, Growth Forecasts (2026 - 2031) |
||||||
※ 本网页内容可能与最新版本有所差异。详细情况请与我们联繫。
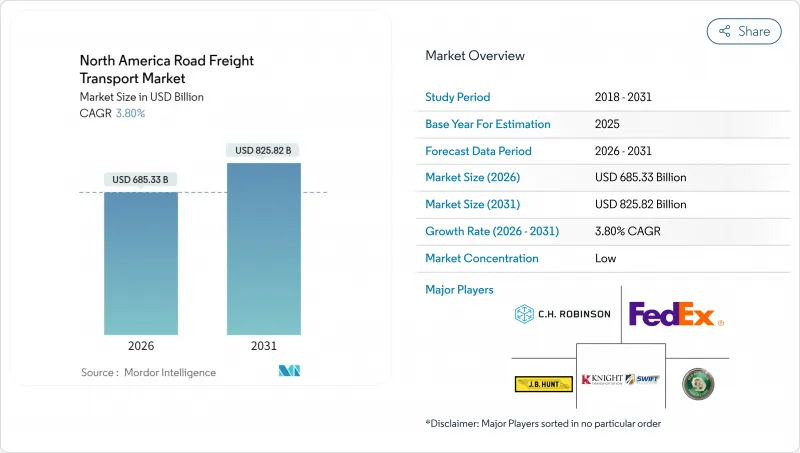
2025年北美公路货运市场价值为6,602.4亿美元,预计从2026年的6,853.3亿美元成长到2031年的8,258.2亿美元,在预测期(2026-2031年)内复合年增长率为3.80%。
北美公路货运市场正处于稳定发展阶段,这得益于该行业的韧性、政策支持的基础设施建设以及不断增长的电子商务量。墨西哥近岸外包、美国墨加协定(USMCA)推动的跨境贸易以及库存多元化正在重塑货运路线,使其更加短途、频繁。儘管托运人出于成本效益考量仍然选择整车运输(FTL)服务,但零担运输(LTL)服务的结构性增长反映出对灵活运力和货物整合的需求日益增长。随着寻求规模的承运商不断收购专业营运商,竞争依然激烈。同时,自动驾驶试点计画和零排放动力系统的广泛应用预示着技术主导的生产力飞跃。监管趋势(特别是温室气体排放限制和修订后的轴荷规定)带来了小规模承运商难以承受的合规成本,推动了产业整合。
北美公路货运市场趋势与洞察
电子商务最后一公里配送快速成长
随着零售商将库存转移到更靠近消费者的地方以履行当日送达的承诺,预计到2024年,短途货运(100英里以内)将以每年20%的速度增长。大都会圈集中的需求加剧了货运站的运力紧张,并导致能够遵守都市区法规的司机竞争日益激烈。食品和药品电商通路的蓬勃发展推动了对温控货物的投资,承运商也不断扩大其冷藏车队规模。路线优化演算法优先考虑停靠点密度而非距离,这使得拥有都市区经验的本地营运商更具优势。有关送货时间限制和零排放区的地方性法规正在促使电池电动货车在最后一公里配送路线上得到早期应用。
政府基础设施奖励策略
《基础设施投资与就业法案》拨款1,100亿美元用于公路和桥樑建设,透过增加车道和消除瓶颈路段来缩短运输时间并提高卡车运输效率。明尼苏达州已确定22处货运瓶颈路段,导致卡车每天每英里延误超过4小时。伊利诺伊州、德克萨斯州和加利福尼亚州也面临类似的挑战。 2025年至2028年间完工的计划将提升I-35和I-95等主要公路的通行能力,但施工绕行可能会暂时减少交通流量。路面品质的提升将降低维护成本并延长拖车的使用寿命,从而降低整体拥有成本。
驾驶人和工资上涨
预计到2024年,由于退休人数超过新颁发的商业驾驶执照数量,卡车司机将出现8万个缺口。卡车运输公司调查显示,两位数的薪资成长、留任奖金和柔软性的工作时间是成本上升的主要驱动因素。由于额外的认证要求,危险品、超大件货物和冷藏运输等特殊领域面临更严重的司机短缺问题。生活方式因素和驾驶时间限制阻碍了年轻司机进入该行业,迫使卡车运输公司投资于驾驶辅助技术和拖车分离系统,以减少等待时间。
细分市场分析
预计到2025年,製造业将占据北美公路货运市场最大份额,占总收入的31.68%。金属、机械和汽车零件将推动出口货运量的成长,而进口原料的流动则维持着稳定的货车週转率。由于全通路库存策略和微型仓配中心的扩张,北美公路货运市场中与批发和零售业相关的市场规模预计将以更快的速度成长。
批发商和零售商更频繁地补充库存,每次补货量也更小,这推动了零担货运(LTL)的成长,预计2026年至2031年,零担货运的复合年增长率将达到4.33%。建筑材料运输受益于奖励策略的计划,而石油和天然气货物的运输则随大宗商品週期波动。可再生能源组件(涡轮叶片、太阳能板、电池组)属于「其他」类别,需要专用设备和护送车辆。
到2025年,国内货运收入将占总收入的62.30%,这反映了公司在美国和加拿大境内广泛的分销网络。儘管经济情势波动,北美公路货运市场仍保持强劲,稳定的区域合约保障了车辆的运转率,并降低了海关风险。
国际货运虽然规模较小,但预计从2026年到2031年将以4.38%的复合年增长率成长。美国墨加协定(USMCA)缩短了边境停留时间并实现了单据采购的标准化,这吸引了托运人对单一发票跨境解决方案的兴趣。主要承运商正透过提供双语客户服务和保税仓库来把握这一成长机会。
到2025年,整车运输(FTL)收入将占总收入的79.35%,凸显了托运人对快速门到门配送和减少装卸环节的重视。季节性需求高峰,尤其是在零售假日高峰期,将导致整车运输运力紧张,从而为更高的现货价格和与柴油价格相关的合约重新谈判创造机会。虽然零担运输(LTL)在北美公路货运市场中所占份额较小,但预计其成长速度将更快,2026年至2031年的复合年增长率(CAGR)将达到4.18%,这主要得益于电子商务退货以及中小企业的运输需求。
区域零担运输专家正大力投资于转运中心自动化和API连接,以便为客户提供即时价格比较和货物追踪服务。 Knight-Swift的目标是在2026年前建立覆盖全国的零担运输网络,这表明资产密集的传统货运公司正在向更均衡的收入来源转型。
其他福利:
- Excel格式的市场预测(ME)表
- 3个月的分析师支持
目录
第一章 引言
- 研究假设和市场定义
- 调查范围
第二章调查方法
第三章执行摘要
第四章 市场情势
- 市场概览
- 按经济活动分類的GDP分配
- 按经济活动分類的GDP成长
- 经济表现及概况
- 电子商务产业的趋势
- 製造业趋势
- 运输和仓储业GDP
- 物流绩效
- 道路长度
- 出口趋势
- 进口趋势
- 燃油价格趋势
- 卡车运输营运成本
- 卡车运输车队规模(按类型)
- 主要卡车供应商
- 公路货运量趋势
- 公路货运价格趋势
- 按交通方式分享
- 通货膨胀
- 法律规范
- 价值炼和通路分析
- 市场驱动因素
- 电子商务最后一公里配送快速成长
- 政府基础设施奖励策略
- 美墨加协定将增加跨境货运量
- 墨西哥近岸外包
- 引进自动驾驶卡车走廊
- 氢燃料卡车普及势头强劲
- 市场限制
- 驾驶人和工资上涨压力
- 燃油价格波动
- 更严格的轴荷/温室气体 (GHG) 法规
- 模式转换
- 市场创新
- 波特五力分析
- 新进入者的威胁
- 买方的议价能力
- 供应商的议价能力
- 替代品的威胁
- 竞争对手之间的竞争
第五章 市场规模与成长预测
- 终端用户产业
- 农业、林业和渔业
- 建造
- 製造业
- 石油天然气、采矿和采石
- 批发和零售
- 其他的
- 目的地
- 国内的
- 国际的
- 卡车装载规范
- 整车运输 (FTL)
- 低于100%的运费(零担运输)
- 货柜运输
- 货柜运输
- 非货柜运输
- 距离
- 长途
- 短程交通
- 货物类型
- 液体货物
- 固体货物
- 温度控制
- 非温控型
- 温度控制
- 国家
- 美国
- 加拿大
- 墨西哥
- 北美其他地区
第六章 竞争情势
- 市场集中度
- 关键策略倡议
- 市占率分析
- 公司简介
- AP Moller-Maersk
- ArcBest
- CH Robinson
- Canada Cartage
- CMA CGM Group(including CEVA Logistics)
- DHL Group
- DSV A/S(De Sammensluttede Vognmaend af Air and Sea)
- FedEx
- JB Hunt Transport, Inc.
- Knight-Swift Transportation Holdings Inc.
- Landstar System Inc.
- Old Dominion Freight Line
- Penske
- Ryder System, Inc.
- Schneider National, Inc.
- Transportes Marva
- Traxion
- United Parcel Service of America, Inc.(UPS)
- Werner Enterprises Inc.
- XPO, Inc.
第七章 市场机会与未来展望
The North America road freight transport market was valued at USD 660.24 billion in 2025 and estimated to grow from USD 685.33 billion in 2026 to reach USD 825.82 billion by 2031, at a CAGR of 3.80% during the forecast period (2026-2031).
This trajectory positions the North America road freight transport market as a steady growth environment sustained by industrial resilience, policy-backed infrastructure upgrades, and rising e-commerce volumes. Nearshoring to Mexico, USMCA-enabled cross-border trade, and inventory decentralization are reshaping freight flows toward shorter-haul, higher-frequency lanes. Shippers continue to favor Full-Truck-Load (FTL) services for cost efficiency, yet the structural rise of Less-than-Truck-Load (LTL) reflects mounting demand for flexible capacity and shipment consolidation. Competitive intensity remains elevated as scale-oriented carriers acquire specialized providers, while widespread adoption of autonomous driving pilots and zero-emission powertrains signals a technology-driven productivity leap. Regulatory trends-most notably greenhouse-gas limits and axle-weight revisions-create compliance costs that smaller fleets struggle to absorb, reinforcing consolidation momentum.
North America Road Freight Transport Market Trends and Insights
E-commerce Last-Mile Boom
Short-haul freight under 100 miles grew 20% annually through 2024 as retailers moved stock closer to consumers to meet same-day delivery promises. Dense metropolitan demand strains terminal capacity and intensifies competition for drivers who can navigate urban restrictions. Grocery and pharmaceutical e-commerce channels push temperature-controlled freight investment, prompting carriers to expand refrigerated fleets. Route-optimization algorithms focus on stop density rather than distance, advantaging regional specialists with urban expertise. Local ordinances on delivery time windows and zero-emission zones accelerate early adoption of battery-electric vans for final-mile routes.
Government Infrastructure Stimulus
The Infrastructure Investment and Jobs Act earmarks USD 110 billion for highways and bridges, unlocking lane additions and bottleneck removals that lower transit times and boost truck productivity. Minnesota identified 22 freight chokepoints causing over 4 hours of daily truck delay per mile; similar pain points exist in Illinois, Texas, and California. Project completions scheduled between 2025-2028 will expand capacity on key corridors such as I-35 and I-95, although construction detours may temporarily suppress throughput. Better pavement quality reduces maintenance expenses, extending tractor-trailer life cycles and lowering the total cost of ownership.
Driver Shortage and Wage Inflation
Retirements outpace new Commercial Driver's License entrants, leaving fleets short by an estimated 80,000 drivers in 2024. Carrier surveys cite double-digit pay increases, retention bonuses, and schedule flexibility as key cost escalators. Specialized segments-hazmat, oversized, and refrigerated-face steeper shortages due to extra certification hurdles. Lifestyle factors and hours-of-service limits deter younger recruits, compelling fleets to invest in driver-assist technology and drop-trailer programs to reduce waiting times.
Other drivers and restraints analyzed in the detailed report include:
- USMCA-Fueled Cross-Border Volumes
- Near-Shoring Shift to Mexico
- Fuel-Price Volatility
For complete list of drivers and restraints, kindly check the Table Of Contents.
Segment Analysis
Manufacturing generated 31.68% of 2025 revenue, the highest slice of the North America road freight transport market share. Metals, machinery, and automotive parts dominate outbound lane volume, while inbound raw-material flows maintain steady trailer turns. The North America road freight transport market size tied to wholesale and retail trade is poised for faster expansion, aided by omnichannel inventory strategies and micro-fulfillment buildouts.
Wholesale and retail traders reorder stock more frequently and in smaller quantities, fueling LTL shipment growth, and are projected to grow at a CAGR of 4.33% between 2026-2031. Construction freight absorbs a meaningful uplift from stimulus-funded projects, whereas oil-and-gas cargoes fluctuate with commodity cycles. Renewable-energy components-turbine blades, solar panels, and battery packs-enter the "Others" bucket and demand specialized equipment and escorts.
Domestic hauls represented 62.30% of 2025 turnover, reflecting extensive intra-U.S. and intra-Canada distribution networks. Stable regional contracts anchor fleet utilization and limit customs risk, keeping the North America road freight transport market robust during economic swings.
International volumes, while smaller, eye a 4.38% CAGR between 2026-2031. Lower border dwell times and harmonized documentation under USMCA attract shippers seeking one-bill cross-border solutions. Large carriers embed bilingual customer service and bonded warehousing to capitalize on the upswing.
FTL held 79.35% of 2025 sales, underscoring shippers' preference for door-to-door speed and limited handling. Seasonality spikes, notably retail holiday peaks, tighten FTL capacity, pushing spot rates upward and opening openings for contract renegotiations tethered to diesel indexation. The North America road freight transport market size captured by LTL is smaller but should grow faster with a CAGR of 4.18% between 2026-2031 on the back of e-commerce returns and SME shipping needs.
Regional LTL specialists invest heavily in cross-dock automation and API connectivity so customers can rate-shop and track in real time. Knight-Swift's ambition to build a national LTL grid by 2026 illustrates how asset-heavy truckload incumbents diversify toward more balanced revenue streams.
The North America Road Freight Transport Market Report is Segmented by End User Industry (Manufacturing, and More), Destination (Domestic and International), Truckload Specification (FTL and LTL), Distance (Long and Short Haul), Goods Configuration (Fluid Goods and Solid Goods), Temperature Control (Non-Temperature and Temperature Controlled), Containerization, and Country. The Market Forecasts are Provided in Terms of Value (USD).
List of Companies Covered in this Report:
- A.P. Moller - Maersk
- ArcBest
- C.H. Robinson
- Canada Cartage
- CMA CGM Group (including CEVA Logistics)
- DHL Group
- DSV A/S (De Sammensluttede Vognmaend af Air and Sea)
- FedEx
- J.B. Hunt Transport, Inc.
- Knight-Swift Transportation Holdings Inc.
- Landstar System Inc.
- Old Dominion Freight Line
- Penske
- Ryder System, Inc.
- Schneider National, Inc.
- Transportes Marva
- Traxion
- United Parcel Service of America, Inc. (UPS)
- Werner Enterprises Inc.
- XPO, Inc.
Additional Benefits:
- The market estimate (ME) sheet in Excel format
- 3 months of analyst support
TABLE OF CONTENTS
1 Introduction
- 1.1 Study Assumptions and Market Definition
- 1.2 Scope of the Study
2 Research Methodology
3 Executive Summary
4 Market Landscape
- 4.1 Market Overview
- 4.2 GDP Distribution by Economic Activity
- 4.3 GDP Growth by Economic Activity
- 4.4 Economic Performance and Profile
- 4.4.1 Trends in E-Commerce Industry
- 4.4.2 Trends in Manufacturing Industry
- 4.5 Transport and Storage Sector GDP
- 4.6 Logistics Performance
- 4.7 Length of Roads
- 4.8 Export Trends
- 4.9 Import Trends
- 4.10 Fuel Pricing Trends
- 4.11 Trucking Operational Costs
- 4.12 Trucking Fleet Size by Type
- 4.13 Major Truck Suppliers
- 4.14 Road Freight Tonnage Trends
- 4.15 Road Freight Pricing Trends
- 4.16 Modal Share
- 4.17 Inflation
- 4.18 Regulatory Framework
- 4.19 Value Chain and Distribution Channel Analysis
- 4.20 Market Drivers
- 4.20.1 E-Commerce Last-Mile Boom
- 4.20.2 Government Infrastructure Stimulus
- 4.20.3 USMCA-Fuelled Cross-Border Volumes
- 4.20.4 Near-Shoring Shift to Mexico
- 4.20.5 Autonomous-Truck Corridor Roll-Outs
- 4.20.6 Hydrogen-Truck Adoption Momentum
- 4.21 Market Restraints
- 4.21.1 Driver Shortage and Wage Inflation
- 4.21.2 Fuel-Price Volatility
- 4.21.3 Stricter Axle-Weight/GHG Rules
- 4.21.4 Modal Shift to Rail-Intermodal
- 4.22 Technology Innovations in the Market
- 4.23 Porter's Five Forces Analysis
- 4.23.1 Threat of New Entrants
- 4.23.2 Bargaining Power of Buyers
- 4.23.3 Bargaining Power of Suppliers
- 4.23.4 Threat of Substitutes
- 4.23.5 Competitive Rivalry
5 Market Size and Growth Forecasts (Value, USD)
- 5.1 End User Industry
- 5.1.1 Agriculture, Fishing, and Forestry
- 5.1.2 Construction
- 5.1.3 Manufacturing
- 5.1.4 Oil and Gas, Mining and Quarrying
- 5.1.5 Wholesale and Retail Trade
- 5.1.6 Others
- 5.2 Destination
- 5.2.1 Domestic
- 5.2.2 International
- 5.3 Truckload Specification
- 5.3.1 Full-Truck-Load (FTL)
- 5.3.2 Less than-Truck-Load (LTL)
- 5.4 Containerization
- 5.4.1 Containerized
- 5.4.2 Non-Containerized
- 5.5 Distance
- 5.5.1 Long Haul
- 5.5.2 Short Haul
- 5.6 Goods Configuration
- 5.6.1 Fluid Goods
- 5.6.2 Solid Goods
- 5.7 Temperature Control
- 5.7.1 Non-Temperature Controlled
- 5.7.2 Temperature Controlled
- 5.8 Country
- 5.8.1 United States
- 5.8.2 Canada
- 5.8.3 Mexico
- 5.8.4 Rest of North America
6 Competitive Landscape
- 6.1 Market Concentration
- 6.2 Key Strategic Moves
- 6.3 Market Share Analysis
- 6.4 Company Profiles (Includes Global Level Overview, Market Level Overview, Core Segments, Financials as Available, Strategic Information, Market Rank/Share for Key Companies, Products and Services, and Recent Developments)
- 6.4.1 A.P. Moller - Maersk
- 6.4.2 ArcBest
- 6.4.3 C.H. Robinson
- 6.4.4 Canada Cartage
- 6.4.5 CMA CGM Group (including CEVA Logistics)
- 6.4.6 DHL Group
- 6.4.7 DSV A/S (De Sammensluttede Vognmaend af Air and Sea)
- 6.4.8 FedEx
- 6.4.9 J.B. Hunt Transport, Inc.
- 6.4.10 Knight-Swift Transportation Holdings Inc.
- 6.4.11 Landstar System Inc.
- 6.4.12 Old Dominion Freight Line
- 6.4.13 Penske
- 6.4.14 Ryder System, Inc.
- 6.4.15 Schneider National, Inc.
- 6.4.16 Transportes Marva
- 6.4.17 Traxion
- 6.4.18 United Parcel Service of America, Inc. (UPS)
- 6.4.19 Werner Enterprises Inc.
- 6.4.20 XPO, Inc.
7 Market Opportunities and Future Outlook
- 7.1 White-Space and Unmet-Need Assessment
 2026-2030年全球公路货运市场
 2026年全球公路货运市场报告
 陆上货运市场:2026-2032年全球市场预测(依服务类型、货物类型、所有权、车辆类型及最终用途划分)
 公路货运服务市场机会、成长驱动因素、产业趋势分析、预测(2026-2035年)
 美国公路货运:市场份额分析、行业趋势和统计数据、成长预测(2026-2031 年)越南公路货运:市场占有率分析、产业趋势与统计、成长预测(2026-2031)义大利公路货运:市场占有率分析、产业趋势与统计、成长预测(2026-2031 年)印度公路货运:市场占有率分析、产业趋势与统计、成长预测(2026-2031)
 日本公路货运市场报告(依产品类型、目的地、整车规格、货柜化、距离、温控、最终用户和地区划分,2026-2034年)日本公路货运:市场占有率分析、产业趋势与统计、成长预测(2025-2030 年)