

 |
市场调查报告书
商品编码
1911727
马来西亚行动通讯业者(MNO)市场占有率分析、产业趋势与统计、成长预测(2026-2031)Malaysia Telecom MNO - Market Share Analysis, Industry Trends & Statistics, Growth Forecasts (2026 - 2031) |
||||||
※ 本网页内容可能与最新版本有所差异。详细情况请与我们联繫。
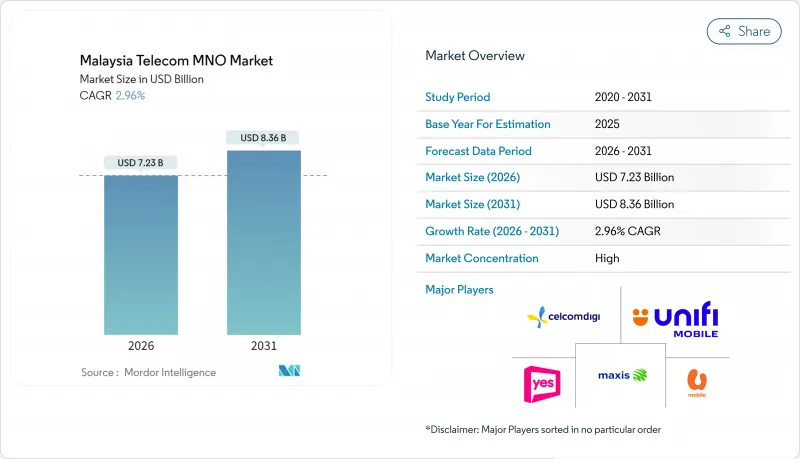
预计到 2025 年,马来西亚行动通讯业者(MNO) 市值将达到 70.2 亿美元,到 2026 年将成长至 72.3 亿美元,到 2031 年将成长至 83.6 亿美元,在预测期(2026-2031 年)内将成长至 2.96%。
这一稳定成长主要受三大关键趋势驱动:向双网路5G架构转型、大规模光纤部署以及企业数位化进程的推进。通讯业者正果断地摒弃传统的以语音为中心的经营模式,转而优先发展数据优先战略,将全国范围的5G覆盖范围与云端运算、内容和边缘运算领域的伙伴关係相结合。诸如JENDELA和国家光纤化与连接计划等政府项目,透过保障基地台升级和回程传输光纤的成本,显着降低了所需资本支出的风险,使营运商能够将资金重新分配到更高价值的企业提案中。同时,无限资料方案套餐的价格战持续挤压消费者的利润空间,迫使通讯业者寻求高商机,例如私有5G、物联网和固网行动融合(FMC)。在此背景下,马来西亚的行动网路营运商(MNO)市场正从规模竞争演变为以网路切片、人工智慧驱动的自动化和产业专用的解决方案等差异化能力决定竞争优势的格局。
马来西亚电信行动网路营运商市场趋势与洞察
利用 JENDELA 和双网机型扩展 5G 覆盖范围
从单一发网络向竞争性双网络结构的转型将重塑各通讯业者的基础设施经济格局。 Digital National计画在2024年12月前达到80.2%的人口覆盖率,而U Mobile建置第二张全国性网路的义务将引入冗余机制,从而降低批发资费并提升服务品质。 U Mobile与中国移动国际合作,承诺在18个月内部署5000至7000个5G基地台。这项积极的部署计画将加快部署速度,同时缓解垄断瓶颈带来的担忧。双网路部署也将释放频谱资源用于私有5G切片,从而支援对延迟敏感的应用,例如工业领域的机器视觉检测和自动化物料搬运。单一来源限制的消除将为马来西亚电信行动网路营运商(MNO)市场参与企业提供更多空间,使其能够在差异化5G收费系统和服务等级协定(SLA)方面进行创新,而不仅仅依赖价格竞争。
人均行动数据消费量增加和ARPU值上升
在4K影片串流、云端游戏和人工智慧增强型行动应用程式的推动下,预计每月数据使用量将从2024年的21.6GB飙升至2029年的51.9GB。为了抓住这一成长机会,通讯业者正逐步淘汰限速的「无限流量」套餐,转而推出分级5G套餐,以实现不限速带来的收益。 OTT合作,例如Astro与Netflix和Disney+Hotstar的捆绑销售,建立了一个强大的内容生态系统,有助于提高客户留存率并降低客户解约率。然而,通讯业者正努力寻求微妙的平衡。目前所有网路均提供的价格低于马币的无限资料方案,如果速度差异化不足,则可能危及ARPU(每位用户平均收入)的成长潜力。成功的关键在于引导用户升级到高速套餐,同时将边缘託管游戏和超高清体育赛事串流等专属服务功能保留给价格更高的套餐用户。
无限资料方案价格竞争加剧,对利润率带来压力。
价格低于马币的无限流量套餐设定了最低价格门槛,在5G资本支出达到高峰之际,这给营运商的盈利带来了压力。 U Mobile仅限週末使用的5G预付套餐(马币)和CelcomDigi同价位的3Mbps套餐迫使竞争对手推出类似促销活动。由此造成的利润率压力显着。当无限流量包含在基础费用中时,速度加价就不存在了。虽然在约200GB流量使用后会实施公平使用限制,这有助于缓解网路拥堵,但客户越来越倾向于将速度降低视为违约行为,导致用户流失率上升,并在社群媒体上引发强烈抗议。为了恢復收入来源,通讯业者目前正将重心转向企业订阅、内容包和金融科技相关服务,这些领域的需求弹性较低,且用户支付意愿较高。
细分市场分析
到2025年,数据和网路服务将占马来西亚行动网路营运商(MNO)市场份额的53.62%,并在2031年之前以2.99%的复合年增长率成长。超高清串流媒体、下一代人工智慧智慧型手机和云端游戏带来的流量成长正推动营运商升级回程传输并部署营运商级边缘节点。语音服务将继续占马来西亚MNO市场份额的19.18%,这主要得益于漫游需求的復苏和麵向企业的整合通讯捆绑销售,但其复合年增长率将落后于数据主导型业务,仅为2.70%。通讯、附加价值服务和批发传输服务总合将占总收入的16.04%,复合年增长率为2.98%,这主要得益于超大规模资料中心营运商不断增长的频宽需求。
物联网和机器对机器(M2M)业务仅占总收入的5.05%,但其复合年增长率(CAGR)高达3.11%,主要得益于工业4.0蓝图和JENDELA走廊内的智慧城市试点计画。随着製造业企业转向依赖密集感测器网路的预测维修系统,预计物联网模组在马来西亚行动网路营运商(MNO)通讯业者的规模将进一步扩大。 OTT和付费电视服务占总营收的6.11%,成长率为3.05%。 Astro与Netflix和Disney+Hotstar的直接收费合作,正是通讯业者透过内容聚合提高每用户平均收入(ARPU)的例证。
马来西亚电信行动网路营运商(MNO)市场按服务类型(语音服务、数据/互联网服务、通讯服务、物联网/机器对机器通讯服务、OTT/付费电视服务等)和最终用户(企业、消费者)进行细分。市场预测以价值(美元)和用户数量(用户数)为单位。
其他福利:
- Excel格式的市场预测(ME)表
- 3个月的分析师支持
目录
第一章 引言
- 研究假设和市场定义
- 调查范围
第二章调查方法
第三章执行摘要
第四章 市场情势
- 市场概览
- 监理与政策框架
- 频谱环境与竞争格局
- 通讯业生态系统
- 宏观经济与外在因素
- 波特五力分析
- 竞争对手之间的竞争
- 新进入者的威胁
- 供应商的议价能力
- 买方的议价能力
- 替代品的威胁
- 领先行动网路营运商的关键绩效指标(2020-2025)
- 独立行动用户和渗透率
- 行动网路使用者数量和普及率
- 按接入技术分類的SIM卡连线数和渗透率
- 蜂巢式物联网/M2M连接
- 宽频连线(移动/固定)
- ARPU(每位用户平均收入)
- 用户平均每月数据使用量(GB/月)
- 市场驱动因素
- 利用 JENDELA 和双网机型扩展 5G 覆盖范围
- 人均行动数据消费量和ARPU值均有所成长
- 政府主导的光纤部署计画(NFCP,JENDELA)
- 製造业丛集对专用5G和物联网解决方案的需求
- 通讯业者和OTT内容商品搭售付费电视和数据提升销售
- 透过游客和移民的eSIM套餐增加预付收入
- 市场限制
- 无限资料方案的价格竞争日益激烈,对利润率带来压力。
- 高昂的频谱使用费和普遍服务义务(USO)税费正给现金流带来压力。
- 巴生谷地区以外的光纤回程传输瓶颈
- 关于卖出DNB股份的政策不确定性
- 技术展望
- 电信业主要经营模式分析
- 定价模型和定价分析
第五章 市场规模与成长预测
- 通信总收入和每位用户平均收入
- 服务类型
- 语音服务
- 数据和网际网路服务
- 通讯服务
- 物联网和机器对机器服务
- OTT和付费电视服务
- 其他服务(附加价值服务、漫游/国际服务、企业/批发服务等)
- 最终用户
- 公司
- 一般消费者
第六章 竞争情势
- 市场集中度
- 主要供应商的策略性倡议与投资,2023-2025 年
- 2024年行动网路营运商市场占有率分析
- Product Benchmarking Analysis for mobile network services
- MNO snapshot(subscribers, churn rate, ARPU, etc.)
- 行动网路营运商公司简介*
- CelcomDigi
- Maxis
- U Mobile
- Yes(YTL Communications)
- Unifi Mobile(Telekom Malaysia)
第七章 市场机会与未来展望
The Malaysia Telecom MNO Market was valued at USD 7.02 billion in 2025 and estimated to grow from USD 7.23 billion in 2026 to reach USD 8.36 billion by 2031, at a CAGR of 2.96% during the forecast period (2026-2031).
The transition to a dual-network 5G regime, large-scale fiber build-outs, and rising enterprise digitization are the three forces most responsible for this steady uplift. Operators have moved decisively away from legacy voice-centric business models, prioritizing data-first strategies that blend nationwide 5G coverage with partnerships in cloud, content, and edge computing. Government programs such as JENDELA and the National Fiberisation and Connectivity Plan have de-risked much of the required capital outlay by underwriting tower upgrades and backhaul fiber, enabling operators to redeploy cash toward value-added enterprise propositions. At the same time, price-led competition in unlimited data plans continues to compress consumer margins, compelling carriers to chase higher-yield opportunities in private 5G, IoT, and fixed-mobile convergence. Against this backdrop, the Malaysia telecom MNO market is evolving from a scale game to one where differentiated capabilities in network slicing, AI-driven automation, and vertical-specific solutions define competitive advantage.
Malaysia Telecom MNO Market Trends and Insights
5G Coverage Expansion Under JENDELA & Dual-Network Model
The leap from a single wholesale network to a competitive dual-network structure rewrites infrastructure economics for every carrier. Digital Nasional Berhad achieved 80.2% population coverage by December 2024, and U Mobile's mandate to erect a second nationwide grid introduces redundancy that should narrow wholesale fees and improve quality of service. U Mobile pledges 5,000-7,000 5G sites within 18 months in partnership with China Mobile International, an aggressive schedule that accelerates adoption while mitigating the prior fear of a bottlenecked monopoly. The dual-track rollout also unlocks spectrum for private 5G slices, positioning industrial zones for latency-sensitive applications such as machine-vision inspection and autonomous material handling. By removing single-supplier constraints, Malaysia telecom MNO market participants gain room to innovate on differentiated 5G tariffs and service-level agreements rather than competing solely on price.
Rising Per-Capita Mobile Data Consumption & ARPU Uplift
Monthly data usage is projected to jump from 21.6 GB in 2024 to 51.9 GB by 2029, propelled by 4K video streaming, cloud gaming, and AI-enhanced mobile apps. To capture this surge, carriers are phasing out throttled "unlimited" offers in favor of tiered 5G packages that monetize uncapped speeds. OTT alliances, typified by Astro's bundle with Netflix and Disney+Hotstar, deliver sticky content ecosystems that lengthen tenure and combat churn. Operators nevertheless navigate a delicate balance; unlimited data plans below RM 50, now common across all networks, threaten to dilute potential ARPU gains if speed-based differentiation is poorly executed. Success hinges on migrating subscribers to premium speed tiers while reserving exclusive service features-such as edge-hosted gaming or UHD sports streams-for higher-priced plans.
Aggressive Unlimited-Data Price Wars Compressing Margins
Unlimited plans under RM 50 have set a low watermark that squeezes profitability just as 5G capex peaks. U Mobile's prepaid offer with 5G-enabled weekends at RM 25 and CelcomDigi's 3 Mbps plan at the same price have forced every carrier to replicate similar promotions. The resulting margin squeeze is stark: speed-based premiums vanish when baseline tariffs include uncapped data. Fair-usage throttling helps to limit network congestion after roughly 200 GB of use, yet customers increasingly view speed reductions as broken promises, risking churn and social-media backlash. To restore economics, operators now pivot toward enterprise contracts, content bundling and fintech adjacencies where elasticity is lower and willingness to pay is higher.
Other drivers and restraints analyzed in the detailed report include:
- Government-Backed Fiber Rollout Programs (NFCP, JENDELA)
- Manufacturing Clusters' Demand for Private 5G & IoT Solutions
- High Spectrum Fees & USO Levies Straining Cash Flow
For complete list of drivers and restraints, kindly check the Table Of Contents.
Segment Analysis
Data and internet services captured 53.62% of Malaysia telecom MNO market share in 2025, running ahead at a 2.99% CAGR through 2031. Growing traffic from UHD streaming, Gen-AI smartphones, and cloud gaming drives operators to upscale backhaul and deploy carrier-grade edge nodes. Voice remains a 19.18% slice of Malaysia telecom MNO market size, cushioned by roaming recovery and unified-communications bundles sold into enterprise accounts, yet its 2.70% CAGR lags data-led verticals. Messaging, value-added services, and wholesale transit combine for 16.04% of revenue and post a 2.98% growth clip, buoyed by rising demand for bandwidth from hyperscale datacenter operators.
IoT & M2M stands at only 5.05% of total receipts but records the highest 3.11% CAGR, propelled by Industry 4.0 roadmaps and smart-city pilots within JENDELA corridors. The Malaysia telecom MNO market size for IoT modules is forecast to expand as manufacturing supervisors switch to predictive maintenance systems that rely on high-density sensor grids. OTT and Pay-TV services contribute 6.11% of revenue on a 3.05% trajectory; Astro's direct billing partnerships with Netflix and Disney+Hotstar illustrate how carriers secure incremental ARPU via content aggregation.
The Malaysia Telecom MNO Market is Segmented by Service Type (Voice Services, Data and Internet Services, Messaging Services, Iot and M2M Services, OTT and PayTV Services, and More), and End User (Enterprises, and Consumers). The Market Forecasts are Provided in Terms of Value (USD) and Volume (Subscribers).
List of Companies Covered in this Report:
- CelcomDigi
- Maxis
- U Mobile
- Yes (YTL Communications)
- Unifi Mobile (Telekom Malaysia)
Additional Benefits:
- The market estimate (ME) sheet in Excel format
- 3 months of analyst support
TABLE OF CONTENTS
1 INTRODUCTION
- 1.1 Study Assumptions and Market Definition
- 1.2 Scope of the Study
2 RESEARCH METHODOLOGY
3 EXECUTIVE SUMMARY
4 MARKET LANDSCAPE
- 4.1 Market Overview
- 4.2 Regulatory and Policy Framework
- 4.3 Spectrum Landscape & Competitive Holdings
- 4.4 Telecom Industry Ecosystem
- 4.5 Macroeconomic & External Drivers
- 4.6 Porter's Five Forces Analysis
- 4.6.1 Competitive Rivalry
- 4.6.2 Threat of New Entrants
- 4.6.3 Bargaining Power of Suppliers
- 4.6.4 Bargaining Power of Buyers
- 4.6.5 Threat of Substitutes
- 4.7 Key MNO KPIs (2020-2025)
- 4.7.1 Unique Mobile Subscribers & Penetration Rate
- 4.7.2 Mobile Internet Users & Penetration Rate
- 4.7.3 SIM Connections by Access Technology & Penetration
- 4.7.4 Cellular IoT / M2M Connections
- 4.7.5 Broadband Connections (Mobile & Fixed)
- 4.7.6 ARPU (Average Revenue Per User)
- 4.7.7 Average Data Usage per Subscription (GB/month)
- 4.8 Market Drivers
- 4.8.1 5G coverage expansion under JENDELA & dual-network model
- 4.8.2 Rising per-capita mobile data consumption & ARPU uplift
- 4.8.3 Government-backed fibre rollout programmes (NFCP, JENDELA)
- 4.8.4 Manufacturing clusters' demand for private 5G & IoT solutions
- 4.8.5 Telco-OTT content bundling boosting Pay-TV & data upsell
- 4.8.6 e-SIM tourist & migrant plans adding incremental prepaid revenue
- 4.9 Market Restraints
- 4.9.1 Aggressive unlimited-data price wars compressing margins
- 4.9.2 High spectrum fees & USO levies straining cash flow
- 4.9.3 Fibre backhaul bottlenecks outside Klang Valley
- 4.9.4 Policy uncertainty over DNB stake divestment
- 4.10 Technological Outlook
- 4.11 Analysis of key business models in Telecom Sector
- 4.12 Analysis of Pricing Models and Pricing
5 MARKET SIZE & GROWTH FORECASTS (VALUE)
- 5.1 Overall Telecom Revenue and ARPU
- 5.2 Service Type
- 5.2.1 Voice Services
- 5.2.2 Data and Internet Services
- 5.2.3 Messaging Services
- 5.2.4 IoT and M2M Services
- 5.2.5 OTT and PayTV Services
- 5.2.6 Other Services (VAS, Roaming & International Services, Enterprise & Wholesale Services, etc.)
- 5.3 End-user
- 5.3.1 Enterprises
- 5.3.2 Consumer
6 COMPETITIVE LANDSCAPE
- 6.1 Market Concentration
- 6.2 Strategic Moves and Investments by key vendors, 2023-2025
- 6.3 Market share analysis for MNOs, 2024
- 6.4 Product Benchmarking Analysis for mobile network services
- 6.5 MNO snapshot (subscribers, churn rate, ARPU, etc.)
- 6.6 Company Profiles* of MNOs (Includes Business Overview | Service Portfolio | Financials | Business Strategy and Recent Developments | SWOT Analysis)
- 6.6.1 CelcomDigi
- 6.6.2 Maxis
- 6.6.3 U Mobile
- 6.6.4 Yes (YTL Communications)
- 6.6.5 Unifi Mobile (Telekom Malaysia)
7 MARKET OPPORTUNITIES & FUTURE OUTLOOK
- 7.1 White-space & Unmet-Need Assessment
 2026-2030年全球虚拟行动服务业者(MVNO)服务市场
 中东和非洲行动通讯业者(MNO):市场份额分析、产业趋势、统计数据和成长预测(2026-2031 年)义大利电信行动网路业者:市场占有率分析、产业趋势与统计、成长预测(2026-2031 年)德国行动通讯业者(MNO):市场占有率分析、产业趋势与统计、成长预测(2026-2031 年)
 5G MVNO市场:2025-2032年全球预测(按套餐类型、最终用户、设备类型、分销管道、垂直行业、定价模式和网路类型划分)行动虚拟网路营运商 (MVNO) 市场:2025-2032 年全球预测(按服务类型、分销管道、费率方案、最终用户产业和应用划分)
 2025年全球虚拟行动服务业者(MVNO)市场报告虚拟行动服务业者(MVNO):市场占有率分析、产业趋势、统计数据和成长预测(2025-2030 年)
 全球物联网虚拟行动服务业者(MVNO)市场
 虚拟行动服务业者市场规模、份额、趋势分析报告:按类型、营运模式、服务、合约、最终用途、地区和细分市场预测,2025 年至 2030 年