


 |
市场调查报告书
商品编码
1906199
中东和非洲行动通讯业者(MNO):市场份额分析、产业趋势、统计数据和成长预测(2026-2031 年)Middle East And Africa Telecom MNO - Market Share Analysis, Industry Trends & Statistics, Growth Forecasts (2026 - 2031) |
||||||
※ 本网页内容可能与最新版本有所差异。详细情况请与我们联繫。
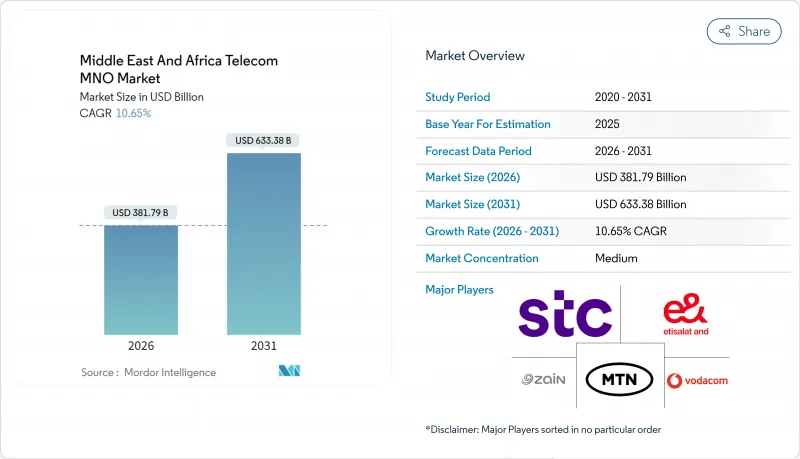
预计到 2026 年,中东和非洲的行动通讯业者(MNO) 市场规模将达到 3,817.9 亿美元。
预计该产业规模将从 2025 年的 3,450.4 亿美元成长到 2031 年的 6,333.8 亿美元,2026 年至 2031 年的复合年增长率为 10.65%。
5G的快速部署、光纤回程回程传输的扩展以及智慧型手机普及率的不断提高,共同推动该地区保持结构性高速成长。投资热情依然高涨,埃及斥资1.5亿美元获得了首批5G牌照,沙乌地阿拉伯则计划在2025年将5G固定无线接入(FWA)覆盖率提升至78%。摩洛哥计划投资4.75亿美元,力争2025年底实现25%的5G覆盖率,凸显了其对次世代接取的重视。来自低地球轨道(LEO)卫星宽频的竞争压力以及红海海底光缆走廊週边的地缘政治风险预计将抑制市场情绪,但企业数位化和行动支付带来的每用户平均收入(ARPU)成长将部分抵消这些影响。
中东和非洲行动通讯业者(MNO) 市场趋势与洞察
影片类应用程式推动行动数据流量爆炸性成长
随着用户从语音通话和简讯转向高清串流媒体,影片消费正在重塑通讯业者的收入结构。沿岸地区的简讯收入预计将从2013年的43亿美元下降到2018年的32亿美元,而同期行动数据流量却增加了180%。营运商正透过增加5G小型基地台的密度来应对这项变化。预计到2030年,中东和北非地区的小型基地台市场规模将达到4.1254亿美元(复合年增长率为40.9%)。固定无线存取(FWA)订阅每月费用约为70美元,无需铺设新的光纤即可实现家庭串流媒体流量的货币化。网路负责人目前正在权衡大规模MIMO升级的成本与高阶用户日益增长的Gigabit方案付费意愿。在撒哈拉以南非洲地区,预计到2030年,每位用户每月的数据使用量将成长两倍,达到14GB,这需要同时对频谱和回程传输进行投资。
支援频谱竞标将加速4G和5G部署
海湾和北非的监管机构目前优先考虑的是覆盖目标,而不是一次性竞标费用。沙乌地阿拉伯的《2025-2027年频谱展望》为非地面电波网路和固定无线存取(FWA)分配了新的频谱,并透过简化的许可製度显着缩短了营运商的产品上市时间。南非的《2025年国家无线电频率规划》(草案)也同样为专用私有网路预留了频谱,以促进工业5G的发展。阿联酋目前已运作7,000个5G基地台,并计画在2025年部署500个园区专用网路。巴林、约旦、科威特和沙乌地阿拉伯同时关闭2G/3G网路将释放低频宽频谱用于5G,并进一步提高频谱效率。这些措施将加速遍远地区宽频的普及,并降低每比特传输成本,这对于维持中东和非洲行动通讯业者(MNO)的收入基础至关重要。
激烈的市场竞争和强制性的SIM卡註册制度抑制了ARPU值的成长。
强制性生物识别SIM卡註册增加了合规成本,而新进业者则在肯亚和加纳等市场引发了价格战。通货膨胀雪上加霜,进一步削弱了消费者的购买力,监管机构为了保护家庭预算,限制了资费上涨。营运商正透过内容包和会员应用程式来应对,但法规环境的碎片化导致实施不均衡,限制了中东和非洲电信行动网路营运商市场的获利能力。
细分市场分析
资料通讯和互联网套餐将成为中东和非洲电信行动网路营运商 (MNO) 市场最大的收入驱动力,到 2025 年将占总收入的 39.35%。物联网/机器对机器 (IoT/M2M) 业务将特别突出,到 2031 年,其在中东和非洲电信 MNO 市场规模中的复合年增长率 (CAGR) 将达到 10.74%。随着 OTT 平台逐渐占据市场主导地位,语音和通讯的份额将合计低于 25%。为此,通讯业者将透过影片服务免流量和与付费电视捆绑销售等方式来客户维繫。边缘运算节点和 API 的商业化将成为补充资料方案的新收入来源。
在预测期内,应用即服务(AppaaS)模式将依赖5G独立组网,从而在游戏和远端医疗领域实现低延迟应用。漫游和批发流量曾经呈现週期性波动,但随着非洲内部贸易的成长,这些流量将趋于稳定。平均数据价格将继续下降,但强劲的流量弹性将抵消这一趋势,从而支撑中东和北非地区行动网路营运商(MNO)市场规模的扩张。
中东和非洲电信行动网路营运商 (MNO) 市场按服务类型(语音服务、数据/互联网服务、通讯服务、物联网/机器对机器 (IoT/M2M) 服务、OTT/付费电视服务及其他服务)、最终用户(企业、消费者)和地区进行细分。市场预测以价值(美元)和用户数)为单位。
其他福利:
- Excel格式的市场预测(ME)表
- 3个月的分析师支持
目录
第一章 引言
- 研究假设和市场定义
- 调查范围
第二章调查方法
第三章执行摘要
第四章 市场情势
- 市场概览
- 监理与政策框架
- 频谱环境和竞争性拥有情形
- 电信业生态系统
- 宏观经济与外在因素
- 波特五力分析
- 竞争对手之间的竞争
- 新进入者的威胁
- 供应商的议价能力
- 买方的议价能力
- 替代品的威胁
- 领先行动网路营运商的关键绩效指标(2020-2025)
- 独立行动用户和渗透率
- 行动网路使用者数量和普及率
- 按接取技术和渗透率分類的SIM卡连线数
- 蜂巢式物联网/M2M连接
- 宽频连线(移动和固定)
- ARPU(每位用户平均收入)
- 用户平均每月数据使用量(GB/月)
- 市场驱动因素
- 影片类应用程式推动行动数据流量爆炸性成长
- 支援性的频谱竞标加速了4G和5G的部署。
- 企业数位化推动了对物联网/机器对机器(IoT/M2M)连接的需求
- 撒哈拉以南非洲地区由青年主导的智慧型手机普及
- 跨境行动支付互通性提升了每位用户平均收入 (ARPU)。
- 面向大型企划和智慧城市的专用 5G 网路切片
- 市场限制
- 激烈的市场竞争和SIM卡註册要求会抑制ARPU值。
- 地缘政治不稳定延缓了基础建设投资
- 低地球轨道卫星宽频成为农村地区的替代方案
- 非洲内陆国家光纤回程传输短缺
- 技术展望
- 电信业主要经营模式分析
- 定价模式和定价分析
第五章 市场规模及成长预测(价值及数量)
- 通信总收入和每位用户平均收入
- 服务类型
- 语音服务
- 数据和网际网路服务
- 通讯服务
- 物联网和机器对机器服务
- OTT和付费电视服务
- 其他服务(附加价值服务、漫游服务、企业/批发服务等)
- 最终用户
- 公司
- 消费者
- 地区
- 中东
- 沙乌地阿拉伯
- 阿拉伯聯合大公国
- 其他中东国家(卡达、科威特、巴林、阿曼、约旦、伊拉克、黎巴嫩、以色列等)
- 非洲
- 南非
- 奈及利亚
- 其他非洲国家(埃及、摩洛哥、阿尔及利亚、突尼西亚、迦纳、坦尚尼亚、塞内加尔、衣索比亚、乌干达、肯亚等)
- 中东
第六章 竞争情势
- 市场集中度
- 主要供应商的策略与投资动向(2023-2025)
- 2024年行动通讯业者(MNO)市占率分析
- Product Benchmarking Analysis for mobile network services
- MNO snapshot(subscribers, churn rate, ARPU, etc.)
- 行动通讯业者(MNO)公司简介*
- e&(Etisalat Group)
- STC Group
- Ooredoo Group
- Zain Group
- MTN Group
- Vodacom Group
- Orange Middle East and Africa
- Airtel Africa
- Safaricom PLC
- Maroc Telecom SA
- Telecom Egypt(WE)
- Globacom Limited(Glo Mobile)
- 9mobile(EMTS)
- Telkom SA SOC Limited
- Cell C
- Omantel
- Batelco(Beyon Group)
- du(EITC)
- Sudan Telecom Group Limited(Sudatel)
- Ethio Telecom
- AXIAN Telecom
- Econet Wireless Zimbabwe
- MTC Namibia
第七章 市场机会与未来展望
Middle East And Africa Telecom MNO Market size in 2026 is estimated at USD 381.79 billion, growing from 2025 value of USD 345.04 billion with 2031 projections showing USD 633.38 billion, growing at 10.65% CAGR over 2026-2031.
Rapid 5G deployments, expanding fiber backhaul, and rising smartphone penetration combine to keep the region on a structurally high-growth trajectory. Investment intensity remains elevated: Egypt paid USD 150 million for its first 5G license, while Saudi Arabia pushed 5G Fixed Wireless Access (FWA) to 78% population coverage in 2025. Morocco committed USD 475 million to reach 25% 5G coverage by end-2025, underscoring a broad policy focus on next-generation access. Competitive pressure from low-earth-orbit (LEO) satellite broadband and geopolitical risks around the Red Sea cable corridor temper sentiment, but are offset by enterprise digitalization and mobile-money-driven ARPU gains.
Middle East And Africa Telecom MNO Market Trends and Insights
Explosive growth in mobile data traffic from video-centric apps
Video viewing reshapes operator revenue architecture as users pivot from voice and SMS to high-definition streaming. SMS revenue in the Gulf fell from USD 4.3 billion in 2013 to a projected USD 3.2 billion in 2018, while mobile data volumes rose 180% in the same span . Operators respond by densifying 5G small cells; the MENA small-cell market is projected to reach USD 412.54 million by 2030, a 40.9% CAGR . FWA subscriptions, priced near USD 70 each month, monetize in-home streaming traffic without fresh fiber builds. Network planners now weigh the cost of massive-MIMO upgrades against the rising willingness of premium users to pay for gigabit packages. In Sub-Saharan Africa, monthly data usage is forecast to triple to 14 GB per user by 2030, demanding parallel investment in both spectrum and backhaul.
Accelerated 4G and 5G roll-outs enabled by supportive spectrum auctions
Regulators across the Gulf and North Africa now favor coverage targets over windfall auction fees. Saudi Arabia's 2025-2027 Spectrum Outlook sets aside new bands for non-terrestrial networks and FWA via light licensing, slashing time-to-market for operators. South Africa's draft 2025 National Radio Frequency Plan similarly carves out dedicated private-network spectrum that encourages industrial 5G . The UAE already operates 7,000 5G sites, with a policy aiming for 500 on-campus private networks by 2025. Concurrent 2G/3G switch-offs in Bahrain, Jordan, Kuwait, and Saudi Arabia release low-band spectrum for 5G, further boosting spectral efficiency. The collective result is faster rural broadband coverage and lower per-bit delivery cost, crucial for sustaining the Middle East and Africa telecom MNO market's profit pool.
Aggressive price competition and SIM registration curbing ARPU
Mandatory biometric SIM registration raises compliance costs even as new entrants trigger price wars in markets like Kenya and Ghana. Inflation adds a second squeeze by eroding consumer spend capacity, while regulators cap tariff hikes to protect households. Operators counter with content bundles and loyalty apps, but execution is uneven in fragmented regulatory environments, restraining monetization in the Middle East and Africa telecom MNO market.
Other drivers and restraints analyzed in the detailed report include:
- Enterprise digitization fueling IoT/M2M connectivity demand
- Youth-driven smartphone adoption across Sub-Saharan Africa
- Geopolitical instability delaying infrastructure investment
For complete list of drivers and restraints, kindly check the Table Of Contents.
Segment Analysis
Data and Internet plans accounted for 39.35% of 2025 revenue, making them the single largest contributor to the Middle East and Africa telecom MNO market. IoT/M2M is the standout, expanding at a CAGR of 10.74% in the Middle East and Africa telecom MNO market size by 2031. Voice and messaging together will slip below 25% as OTT platforms cannibalize usage. Operators respond by zero-rating video services and bundling PayTV to sustain stickiness. Edge computing nodes and API monetization emerge as adjacent revenue streams that complement data plans.
Over the forecast horizon, Apps-as-a-Service models will lean on 5G standalone cores, opening low-latency use cases in gaming and telemedicine. Roaming and wholesale traffic, once cyclical, stabilize as intra-Africa trade flows broaden. Average data pricing will continue its southward drift but remain offset by strong volume elasticity, supporting the Middle East and Africa telecom MNO market size expansion.
The Middle East and Africa Telecom MNO Market is Segmented by Service Type (Voice Services, Data and Internet Services, Messaging Services, Iot and M2M Services, OTT and PayTV Services, and Other Services), End User (Enterprises, Consumer), and Geography. The Market Forecasts are Provided in Terms of Value (USD) and Volume (Subscribers).
List of Companies Covered in this Report:
- e& (Etisalat Group)
- STC Group
- Ooredoo Group
- Zain Group
- MTN Group
- Vodacom Group
- Orange Middle East and Africa
- Airtel Africa
- Safaricom PLC
- Maroc Telecom SA
- Telecom Egypt (WE)
- Globacom Limited (Glo Mobile)
- 9mobile (EMTS)
- Telkom SA SOC Limited
- Cell C
- Omantel
- Batelco (Beyon Group)
- du (EITC)
- Sudan Telecom Group Limited (Sudatel)
- Ethio Telecom
- AXIAN Telecom
- Econet Wireless Zimbabwe
- MTC Namibia
Additional Benefits:
- The market estimate (ME) sheet in Excel format
- 3 months of analyst support
TABLE OF CONTENTS
1 INTRODUCTION
- 1.1 Study Assumptions and Market Definition
- 1.2 Scope of the Study
2 RESEARCH METHODOLOGY
3 EXECUTIVE SUMMARY
4 MARKET LANDSCAPE
- 4.1 Market Overview
- 4.2 Regulatory and Policy Framework
- 4.3 Spectrum Landscape and Competitive Holdings
- 4.4 Telecom Industry Ecosystem
- 4.5 Macroeconomic and External Drivers
- 4.6 Porter's Five Forces Analysis
- 4.6.1 Competitive Rivalry
- 4.6.2 Threat of New Entrants
- 4.6.3 Bargaining Power of Suppliers
- 4.6.4 Bargaining Power of Buyers
- 4.6.5 Threat of Substitutes
- 4.7 Key MNO KPIs (2020-2025)
- 4.7.1 Unique Mobile Subscribers and Penetration Rate
- 4.7.2 Mobile Internet Users and Penetration Rate
- 4.7.3 SIM Connections by Access Technology and Penetration
- 4.7.4 Cellular IoT / M2M Connections
- 4.7.5 Broadband Connections (Mobile and Fixed)
- 4.7.6 ARPU (Average Revenue Per User)
- 4.7.7 Average Data Usage per Subscription (GB/month)
- 4.8 Market Drivers
- 4.8.1 Explosive growth in mobile data traffic from video-centric apps
- 4.8.2 Accelerated 4G and 5G roll-outs enabled by supportive spectrum auctions
- 4.8.3 Enterprise digitization fueling IoT/M2M connectivity demand
- 4.8.4 Youth-driven smartphone adoption across Sub-Saharan Africa
- 4.8.5 Cross-border mobile-money interoperability boosting ARPU
- 4.8.6 Private 5G network slicing for mega-projects and smart cities
- 4.9 Market Restraints
- 4.9.1 Aggressive price competition and SIM registration curbing ARPU
- 4.9.2 Geopolitical instability delaying infrastructure investment
- 4.9.3 LEO satellite broadband emerging as rural substitute
- 4.9.4 Limited fiber backhaul in land-locked African nations
- 4.10 Technological Outlook
- 4.11 Analysis of key business models in Telecom Sector
- 4.12 Analysis of Pricing Models and Pricing
5 MARKET SIZE AND GROWTH FORECASTS (VALUE AND VOLUME)
- 5.1 Overall Telecom Revenue and ARPU
- 5.2 Service Type
- 5.2.1 Voice Services
- 5.2.2 Data and Internet Services
- 5.2.3 Messaging Services
- 5.2.4 IoT and M2M Services
- 5.2.5 OTT and PayTV Services
- 5.2.6 Other Services (VAS, Roaming, Enterprise and Wholesale, etc.)
- 5.3 End-user
- 5.3.1 Enterprises
- 5.3.2 Consumer
- 5.4 Geography
- 5.4.1 Middle East
- 5.4.1.1 Saudi Arabia
- 5.4.1.2 United Arab Emirates
- 5.4.1.3 Rest of the Middle East (Qatar, Kuwait, Bahrain, Oman, Jordan, Iraq, Lebanon, Israel, and Others)
- 5.4.2 Africa
- 5.4.2.1 South Africa
- 5.4.2.2 Nigeria
- 5.4.2.3 Rest of Africa (Egypt, Morocco, Algeria, Tunisia, Ghana, Tanzania, Senegal, Ethiopia, Uganda, Kenya, and Others)
- 5.4.1 Middle East
6 COMPETITIVE LANDSCAPE
- 6.1 Market Concentration
- 6.2 Strategic Moves and Investments by key vendors, 2023-2025
- 6.3 Market share analysis for MNOs, 2024
- 6.4 Product Benchmarking Analysis for mobile network services
- 6.5 MNO snapshot (subscribers, churn rate, ARPU, etc.)
- 6.6 Company Profiles* of MNOs (Includes Business Overview | Service Portfolio | Financials | Business Strategy and Recent Developments | SWOT Analysis)
- 6.6.1 e& (Etisalat Group)
- 6.6.2 STC Group
- 6.6.3 Ooredoo Group
- 6.6.4 Zain Group
- 6.6.5 MTN Group
- 6.6.6 Vodacom Group
- 6.6.7 Orange Middle East and Africa
- 6.6.8 Airtel Africa
- 6.6.9 Safaricom PLC
- 6.6.10 Maroc Telecom SA
- 6.6.11 Telecom Egypt (WE)
- 6.6.12 Globacom Limited (Glo Mobile)
- 6.6.13 9mobile (EMTS)
- 6.6.14 Telkom SA SOC Limited
- 6.6.15 Cell C
- 6.6.16 Omantel
- 6.6.17 Batelco (Beyon Group)
- 6.6.18 du (EITC)
- 6.6.19 Sudan Telecom Group Limited (Sudatel)
- 6.6.20 Ethio Telecom
- 6.6.21 AXIAN Telecom
- 6.6.22 Econet Wireless Zimbabwe
- 6.6.23 MTC Namibia
7 MARKET OPPORTUNITIES AND FUTURE OUTLOOK
- 7.1 White-space and Unmet-Need Assessment
 行动虚拟网路营运商 (MVNO) 市场:2026-2032 年全球市场预测(按服务类型、费率方案、销售管道、最终用户产业和应用程式划分)5G MVNO市场:按套餐类型、最终用户、设备类型、销售管道、产业和网路类型划分-2026-2032年全球市场预测
 2026年全球行动虚拟网路营运商(MVNO)市场报告
 行动虚拟网路营运商 (MVNO) 市场规模、份额、趋势和预测:按类型、商业模式、服务类型、用户数量和地区划分,2026-2034 年
 行动虚拟网路营运商 (MVNO) 市场分析及预测(至 2035 年):按类型、产品类型、服务、技术、组件、应用、部署类型、最终用户、解决方案和功能划分
 东协行动虚拟网路营运商(MVNO):市场占有率分析、产业趋势与统计、成长预测(2026-2031)亚太地区行动虚拟网路营运商(MVNO):市场占有率分析、产业趋势与统计、成长预测(2026-2031)新加坡电信行动网路业者:市场占有率分析、产业趋势与统计、成长预测(2026-2031)泰国电信行动网路营运商:市场占有率分析、产业趋势与统计数据、成长预测(2026-2031)美国电信行动网路营运商:市场占有率分析、产业趋势与统计数据、成长预测(2026-2031 年)