


 |
市场调查报告书
商品编码
1934695
美国金融科技市场:市场占有率分析、产业趋势与统计及成长预测(2026-2031年)United States Fintech - Market Share Analysis, Industry Trends & Statistics, Growth Forecasts (2026 - 2031) |
||||||
※ 本网页内容可能与最新版本有所差异。详细情况请与我们联繫。
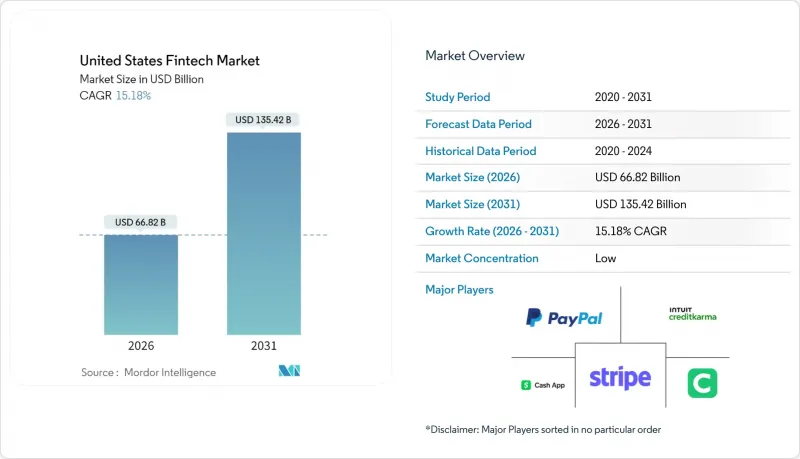
预计到 2026 年,美国金融科技市场规模将达到 668.2 亿美元,高于 2025 年的 580.1 亿美元。
预计到 2031 年将达到 1,354.2 亿美元,2026 年至 2031 年的复合年增长率为 15.18%。
全国即时支付基础设施、广泛应用的嵌入式金融以及人工智慧驱动的风险管理工具的结合,正在重塑客户预期,并迫使现有金融机构进行现代化转型。儘管创业投资已开始从2024年的低迷期中復苏,但监管机构对银行与金融科技公司合作的审查依然严格,影响着新产品的上市速度。从地区来看,美国金融科技市场持续受惠于西部地区的科技生态系统,而南部地区则由于营运成本低廉和州政府的支持政策,成长速度最快。市场竞争适中,没有一家企业的市占率超过两位数,这为垂直整合的专业机构和区域银行平台的发展留下了空间。
美国金融科技市场趋势与洞察
即时支付的引入将加速数位化进程。
截至2024年8月,FedNow的参与银行已从最初的35家扩展到1300多家金融机构,这表明公共基础设施可以克服网路效应障碍。其50万美元的交易限额吸引了先前依赖电汇的商业交易。同时,清算所的RTP网路在2024年第三季处理了8,700万笔支付,总额达690亿美元,较上一季成长约17%。金融科技公司正利用这项基础设施,透过提供即时帐单支付和预支薪资等服务来扩大其每日有效用户群。然而,多种即时支付方案的激增带来了互通性挑战,这使得能够为社区银行简化支付流程的编配平台更具优势。
引进基于垂直产业SaaS平台的嵌入式金融
随着支付和贷款成为内建功能,垂直产业软体供应商的收入成长了3-4倍,其策略重点也从授权转向交易经济效益。银行即服务 (BaaS)仲介业者正在填补监管空白,但美国货币监理署 (OCC) 和联邦存款保险公司 (FDIC) 于2024年7月发布的新指南增加了发起银行的实质审查成本。像 Temenos 这样的现有核心银行系统供应商已收购美国 BaaS 营运商的少数股权,以加快产品上市速度,而不是从零开始建立技术堆迭。德宾修正条款的互换费率上限激励小规模的区域性银行与 SaaS 平台合作,在分散其与发卡机构关係的同时,拓宽其服务范围。 ISO 20022 资料标准将进一步增强这些垂直整合生态系中内建的对帐模组和动态定价功能。
联邦和州级法规的碎片化增加了合规负担。
金融科技公司必须遵守美国50个州的汇款监管规定以及重迭的联邦监管,这增加了法律成本并延缓了产品发布。 2024年7月,美国货币监理署(OCC)和联邦存款保险公司(FDIC)联合发布的指导意见对银行即服务(BaaS)银行施加了更严格的供应商管理规则,导致一些金融科技发起人暂停新客户註册,以加强其内部控制。早期Start-Ups可能需要将营运预算的20%用于反洗钱/了解你的客户(AML/KYC)要求,这限制了其进行创新尝试,并有利于资金雄厚的现有企业。消费者金融保护局(CFPB)可能就诈骗损失责任分配采取的行动,进一步增加了不确定性。所有这些因素综合起来,可能会限制美国金融科技市场在短期内的扩张。
细分市场分析
到2025年,数位支付将占美国金融科技市场的46.78%,反映出银行卡、电子钱包和帐户间转帐等支付方式在广大消费者和商家中的广泛应用。儘管目前规模较小,但受分店经营模式降低服务成本以及提案免手续费储蓄帐户等因素的推动,预计到2031年,新银行业务将以21.05%的复合年增长率增长。因此,美国新银行金融科技市场的规模预计将显着扩大,即使在资本市场趋紧的情况下,也能吸引投资者的目光。
交叉销售正在扩张:支付SaaS供应商正在整合短期贷款和财务管理工具,将多种服务整合到单一工作流程中。数位贷款和融资保持着26.92%的健康市场份额,这主要得益于人工智慧筛选,它可以更快地审查信用记录不良的借款人。由于股本监管的限制,保险科技的市场份额保持在7.36%,但基于使用量的汽车保险和嵌入式旅游保险表明,它们已与支付管道整合。数位投资占比4.89%,在高盛退出纯粹的智能投顾业务后,该领域正在整合。现有企业正在利用全通路分销来保住资产。这种重迭表明,所有提案最终都在争夺美国金融科技市场的份额。
其他福利:
- Excel格式的市场预测(ME)表
- 分析师支持(3个月)
目录
第一章 引言
- 研究假设和市场定义
- 调查范围
第二章调查方法
第三章执行摘要
第四章 市场情势
- 市场概览
- 市场驱动因素
- 即时支付(FedNow、RTP)的引入将有助于加速数位化。
- 垂直SaaS平台中嵌入式金融的普遍性
- 行动钱包和非接触式支付在各年龄层的普及
- 透过基于人工智慧/机器学习的信用和诈欺检测模型改善风险经济学
- 「金融基础设施即程式码」开放原始码堆迭显着缩短了产品上市时间
- 美国兆丰银行试行代币化存款和可程式设计货币
- 市场限制
- 联邦和州级法规的碎片化增加了合规负担。
- 即时支付系统中的诈骗和网路安全成本飙升
- 从2022年起,资金筹措和估值压缩将持续存在
- 加强OCC/FDIC对发起银行附属机构的监管
- 价值/供应链分析
- 监管环境
- 技术展望
- 波特五力模型
- 新进入者的威胁
- 供应商的议价能力
- 买方的议价能力
- 替代品的威胁
- 竞争对手之间的竞争
第五章 市场规模与成长预测
- 透过服务提案
- 数位支付
- 数字借贷和资金筹措
- 数位投资
- 保险科技
- 新银行
- 最终用户
- 零售
- 公司
- 透过使用者介面
- 行动应用
- 网页/浏览器
- POS/物联网设备
- 按地区
- 东北
- 中西部
- 南部
- 西
第六章 竞争情势
- 市场集中度
- 策略趋势
- 市占率分析
- 公司简介
- PayPal
- Stripe
- Block(Square & Cash App)
- Intuit(QuickBooks/Credit Karma)
- Chime
- SoFi
- Affirm
- Coinbase
- Robinhood
- Fiserv
- FIS
- Plaid
- Adyen
- Wise
- Klarna
- Varo Bank
- Upgrade
- Marqeta
- Navy Federal Credit Union(digital lending)
- Green Dot
第七章 市场机会与未来展望
The United States fintech market size in 2026 is estimated at USD 66.82 billion, growing from 2025 value of USD 58.01 billion with 2031 projections showing USD 135.42 billion, growing at 15.18% CAGR over 2026-2031.
A combination of nationwide real-time payment infrastructure, embedded finance adoption, and artificial-intelligence-driven risk tools is reshaping customer expectations and forcing incumbents to modernize. Venture capital investment has begun to recover from the 2024 trough, yet regulatory scrutiny of bank-fintech partnerships remains intense, influencing how quickly new products reach the market. Regionally, the United States fintech market continues to benefit from the West's technology ecosystem, even as the South records the fastest growth due to lower operating costs and supportive state policies. Competitive intensity is moderate because no single firm exceeds a double-digit share, leaving space for vertical specialists and community-bank-backed platforms to thrive.
United States Fintech Market Trends and Insights
Real-Time Payments Rollout Accelerates Digital Adoption
FedNow expanded from 35 launch banks to more than 1,300 institutions by August 2024, illustrating how public infrastructure can overcome network-effect barriers. The USD 500,000 transaction ceiling attracts commercial flows that once relied on wires. Concurrently, The Clearing House's RTP network processed 87 million transfers worth USD 69 billion in Q3 2024, growing about 17% quarter-over-quarter. Fintech providers leverage these rails to offer instant bill pay and earned-wage access, boosting daily active users. Yet the proliferation of multiple instant-payment schemes raises interoperability challenges that favor orchestration platforms able to abstract settlement complexity for community banks.
Embedded Finance Uptake by Vertical SaaS Platforms
Vertical software vendors now generate three-to-four times more revenue once payments and lending become embedded features, shifting their strategic focus from licensing fees to transaction economics. Banking-as-a-Service (BaaS) intermediaries fill regulatory gaps, though new OCC and FDIC guidance issued in July 2024 elevates due-diligence costs for sponsor banks. Established core-banking providers such as Temenos took minority stakes in U.S. BaaS players to accelerate time-to-market instead of rebuilding tech stacks from scratch. Interchange caps under the Durbin Amendment incentivize smaller community banks to partner with SaaS platforms, fragmenting issuer relationships but broadening service reach. ISO 20022 data standards further enhance reconciliation and dynamic pricing modules embedded within these vertical ecosystems.
Fragmented Federal & State Regulation Raises Compliance Burden
Fintech firms must navigate 50 state money-transmitter regimes plus overlapping federal oversight, which increases legal costs and lengthens product launches. The July 2024 OCC-FDIC guidance imposed stronger vendor-management rules on BaaS banks, prompting several fintech sponsors to pause onboarding while they upgrade controls. Early-stage startups may spend 20% of operating budgets on AML/KYC requirements, limiting experimentation and favoring well-capitalized incumbents. Potential CFPB action on liability sharing for scam losses adds another layer of uncertainty. Collectively, these factors moderate the near-term expansion pace of the United States fintech market.
Other drivers and restraints analyzed in the detailed report include:
- Mobile Wallet & Contactless Penetration Across Demographics
- AI/ML-Driven Credit & Fraud Models Improve Risk Economics
- Escalating Fraud & Cybersecurity Costs in Real-Time Rails
For complete list of drivers and restraints, kindly check the Table Of Contents.
Segment Analysis
Digital Payments controlled 46.78% of the United States fintech market in 2025, reflecting broad consumer and merchant acceptance across cards, wallets, and account-to-account rails. Neobanking, while smaller, is projected to grow at a 21.05% CAGR through 2031, underpinned by branch-free models that reduce cost-to-serve and enable fee-free checking propositions. The United States fintech market size for Neobanking is therefore expected to widen considerably, attracting investors despite tighter capital markets.
Cross-selling is increasing: payment-facilitating SaaS vendors now embed short-term lending and treasury tools, weaving multiple propositions into a single workflow. Digital Lending & Financing maintains a healthy 26.92% share, aided by AI underwriting that speeds decisions for thin-file borrowers. Insurtech accounts for only 7.36% because of capital adequacy rules, yet its usage-based auto and embedded travel policies illustrate convergence with payment channels. Digital Investments, at 4.89%, is consolidating after Goldman Sachs exited pure robo-advice; incumbents leverage omnichannel distribution to hold assets. These overlaps illustrate how every proposition ultimately competes for wallet share within the United States fintech market.
The United States Fintech Market Report is Segmented by Service Proposition (Digital Payments, Digital Lending & Financing, Digital Investments, Insurtech, Neobanking), End-User (Retail, Businesses), User Interface (Mobile Applications, Web/Browser, POS/IoT Devices), and Geography (Northeast, Midwest, South, West). The Market Forecasts are Provided in Terms of Value (USD).
List of Companies Covered in this Report:
- PayPal
- Stripe
- Block (Square & Cash App)
- Intuit (QuickBooks / Credit Karma)
- Chime
- SoFi
- Affirm
- Coinbase
- Robinhood
- Fiserv
- FIS
- Plaid
- Adyen
- Wise
- Klarna
- Varo Bank
- Upgrade
- Marqeta
- Navy Federal Credit Union (digital lending)
- Green Dot
Additional Benefits:
- The market estimate (ME) sheet in Excel format
- 3 months of analyst support
TABLE OF CONTENTS
1 Introduction
- 1.1 Study Assumptions & Market Definition
- 1.2 Scope of the Study
2 Research Methodology
3 Executive Summary
4 Market Landscape
- 4.1 Market Overview
- 4.2 Market Drivers
- 4.2.1 Real-time payments (FedNow, RTP) rollout accelerates digital adoption
- 4.2.2 Embedded finance uptake by vertical SaaS platforms
- 4.2.3 Mobile wallet & contactless penetration across demographics
- 4.2.4 AI/ML-driven credit & fraud models improve risk economics
- 4.2.5 "Fin-infra-as-code" open-source stacks slash go-to-market time
- 4.2.6 Tokenised deposits & programmable money pilots by U.S. megabanks
- 4.3 Market Restraints
- 4.3.1 Fragmented federal & state regulation raises compliance burden
- 4.3.2 Escalating fraud & cybersecurity costs in real-time rails
- 4.3.3 Funding pull-back & valuation compression post-2022
- 4.3.4 Heightened OCC/FDIC scrutiny of sponsor-bank partnerships
- 4.4 Value / Supply-Chain Analysis
- 4.5 Regulatory Landscape
- 4.6 Technological Outlook
- 4.7 Porter's Five Forces
- 4.7.1 Threat of New Entrants
- 4.7.2 Bargaining Power of Suppliers
- 4.7.3 Bargaining Power of Buyers
- 4.7.4 Threat of Substitutes
- 4.7.5 Competitive Rivalry
5 Market Size & Growth Forecasts
- 5.1 By Service Proposition
- 5.1.1 Digital Payments
- 5.1.2 Digital Lending & Financing
- 5.1.3 Digital Investments
- 5.1.4 Insurtech
- 5.1.5 Neobanking
- 5.2 By End-User
- 5.2.1 Retail
- 5.2.2 Businesses
- 5.3 By User Interface
- 5.3.1 Mobile Applications
- 5.3.2 Web / Browser
- 5.3.3 POS / IoT Devices
- 5.4 By Geography
- 5.4.1 Northeast
- 5.4.2 Midwest
- 5.4.3 South
- 5.4.4 West
6 Competitive Landscape
- 6.1 Market Concentration
- 6.2 Strategic Moves
- 6.3 Market Share Analysis
- 6.4 Company Profiles (includes Global level Overview, Market level overview, Core Segments, Financials as available, Strategic Information, Market Rank/Share, Products & Services, Recent Developments)
- 6.4.1 PayPal
- 6.4.2 Stripe
- 6.4.3 Block (Square & Cash App)
- 6.4.4 Intuit (QuickBooks / Credit Karma)
- 6.4.5 Chime
- 6.4.6 SoFi
- 6.4.7 Affirm
- 6.4.8 Coinbase
- 6.4.9 Robinhood
- 6.4.10 Fiserv
- 6.4.11 FIS
- 6.4.12 Plaid
- 6.4.13 Adyen
- 6.4.14 Wise
- 6.4.15 Klarna
- 6.4.16 Varo Bank
- 6.4.17 Upgrade
- 6.4.18 Marqeta
- 6.4.19 Navy Federal Credit Union (digital lending)
- 6.4.20 Green Dot
7 Market Opportunities & Future Outlook
- 7.1 SME real-time treasury & payables orchestration platforms
- 7.2 Shared synthetic-identity sandbox for secure bank-fintech data exchange
 金融科技市场:2026-2032年全球市场预测(按支付方式、部署模式、企业规模、技术、最终用户和应用划分)金融科技即服务市场:依产品类型、部署模式、组织规模及最终用户划分-2026-2032年全球预测
 金融科技市场商业分析及预测(至2035年):类型、产品类型、服务、技术、组件、应用、部署模式、最终用户、解决方案
 2026年金融科技多重云端全球市场报告
 金融科技市场规模、份额、趋势和预测:按部署类型、技术、应用、最终用户和地区划分,2026-2034 年
 2026-2030年全球金融科技市场金融科技市场分析及预测(至2035年):依类型、产品类型、服务、技术、组件、应用、部署类型、最终用户及功能划分
 英国金融科技:市场占有率分析、产业趋势与统计、成长预测(2026-2031)
 全球金融科技即服务 (FaaS) 市场规模、份额、趋势和成长分析报告,2026-2034 年金融科技市场规模、份额、成长及全球产业分析:按类型、应用和地区划分,并预测至2026-2034年