


 |
市场调查报告书
商品编码
1939591
美国货运和物流:市场份额分析、行业趋势和统计数据、成长预测(2026-2031 年)United States Freight And Logistics - Market Share Analysis, Industry Trends & Statistics, Growth Forecasts (2026 - 2031) |
||||||
※ 本网页内容可能与最新版本有所差异。详细情况请与我们联繫。
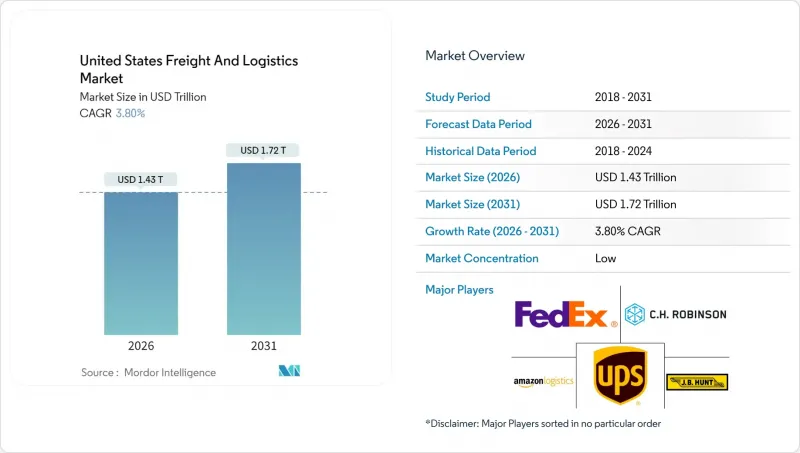
美国货运和物流市场预计将从 2025 年的 13810.9 亿美元增长到 2026 年的 14335.8 亿美元,到 2031 年达到 17246 亿美元,2026 年至 2031 年的复合年增长率为 3.8%。
这种温和的成长轨迹反映了一个日益成熟且富有韧性的产业格局,该格局由电子商务履约、近岸外包主导的製造业流动以及技术的快速应用所塑造。托运人正从资产密集型模式转向数位化协调的网络,从而实现运力优化和跨运输方式的即时可视性。 《联邦基础设施投资与就业法案》(IIJA) 为公路、铁路和港口提供的资金支持了网路的长期可靠性,而零排放卡车试验则标誌着向永续交通的转型正在加速。大型併购正在重塑全球货运能力,而区域专业公司则在最后一公里配送和温控服务领域开闢了利基市场,加剧了竞争。
美国货运及物流市场趋势及洞察
B2C电子商务小包裹量爆炸性成长
2024年国内小包裹量成长,推动了高频短程运输的需求。亚马逊与联邦快递于2025年2月达成合作,共同开展超大包裹递送业务,进一步强化了分散式履约模式,模糊了零售商和承运商之间的界线。消费者期望当日达和隔日达服务,迫使企业在淡季确保运力。区域性和末端配送专家正在扩大市场份额,而随着高端空运被陆运取代,现有企业面临利润压力。向直接面向消费者通路的转变,正将货运方式从托盘运输转向小型包裹,重塑路线密度和资产利用率要求。
以回流主导的国内製造业货物流
《晶片製造和生产法案》(CHIPS Act)和《通货膨胀控制法案》(Control of Inflation Act)共提供2,800亿美元的激励措施,正在加速供应链的在地化进程。半导体、汽车和製药计划正将货运需求集中在五大湖区和东南走廊。随着国内运输距离的缩短,对时效性零件的卡车运输依赖性日益增强,而对有限的长途运输能力的竞争也日益激烈。儘管铁路和港口扩建仍在继续,但由于製造业回流导致货运量增加,现有网路正面临巨大压力,从而导致製造业密集运输路线的运费上涨。各州层级的奖励措施正在鼓励加强区域货运枢纽建设,进一步凸显了多模态的重要性。
长途司机日益短缺和薪资上涨
2024年,大型运输公司仍将面临离职率的困境,老化劳动力和生活方式的考量阻碍了新员工的加入。招聘奖金、增加居家时间以及扩大福利待遇提高了员工的薪资水平。然而,电子记录设备(ELD)的强制使用和驾驶员工时限制,即使车辆充足,也降低了有效运输能力。女性和年轻人的劳动参与率仍然很低,导致劳动力持续短缺。儘管学徒计画和车队现代化改善了招募环境,但仍不足以弥补劳动力缺口。
细分市场分析
到2025年,製造业将占美国货运和物流市场的28.54%,这主要得益于零件流入量的增加以及由于回流激励政策而带来的成品分销增长。该行业倾向于采用兼顾成本和週期时间的多模态解决方案,其中高价值电子产品和药品依赖加急配送服务。儘管批发和零售业的规模较小,但随着全通路零售不断拓展微型仓配点和提高小包裹配送密度,其在2026年至2031年间的复合年增长率将达到4.05%,成为成长最快的产业。由于公共基础设施支出,建筑和物流业将保持稳定,而石油、天然气、采矿和采石业则会受到大宗商品价格和能源政策变化的影响,出现波动。
农业、渔业和林业维持着稳定的散装和冷藏货物需求,但季节性波动需要灵活的运输能力。可再生能源组件、医疗设备和资料中心设备等新兴产业需要专业的处理和合规的监管,这增加了对具备行业知识的操作人员的需求。各行各业的供应链都在日益区域化,导致区域卡车运输路线的货运量增加。在增长型地区,对司机和仓储工人的竞争也日益激烈。
到2025年,货运将占美国货运和物流市场份额的62.85%,主要由卡车运输、铁路运输和多式联运网络组成,为大宗货物和製造业供应链提供支援。儘管规模较小,但小包裹递送(CEP)预计将在2026年至2031年间实现最高的复合年增长率(CAGR),达到4.38%,这主要得益于电子商务小包裹密度集中在大都会圈履约中心附近。国内小包裹递送服务将维持76.05%的市场份额,而国际小小包裹运输量则因跨境电子商务需求以及简化的最低限额海关规则而不断增长。仓储需求强劲,到2025年,非温控设施将占总容量的92.05%。由于药品和生鲜食品物流的需求,温控设施的面积正在加速。
营运商正模糊功能边界,并透过整合运输、仓储和附加价值服务来获取更大的市场份额。数位化编配平台支援跨设施网路的即时模式选择和库存调整。快速运输业者正在实施自动化分类系统和人工智慧驱动的路线最佳化,以应对劳动力短缺问题。在货运领域,零排放卡车试验和由国际工业发展联盟(IIJA)资助的走廊开发项目正在改变车队结构并提升区域效率。服务融合使全端式服务提供者能够掌握结构性变革带来的机会,而专注于速度、合规性和产品完整性的细分领域专家则蓬勃发展。
其他福利:
- Excel格式的市场预测(ME)表
- 分析师支持(3个月)
目录
第一章 引言
- 研究假设和市场定义
- 调查范围
第二章调查方法
第三章执行摘要
第四章 市场情势
- 市场概览
- 人口统计数据
- 按经济活动分類的GDP分配
- 按经济活动分類的GDP成长
- 通货膨胀
- 经济表现和公司概况
- 电子商务产业的趋势
- 製造业趋势
- 运输和仓储业的GDP
- 出口趋势
- 进口趋势
- 燃油价格
- 卡车运输营运成本
- 卡车运输车队规模(按类型)
- 主要卡车供应商
- 物流绩效
- 按交通方式分享
- 海运船队运力
- 班轮运输连接
- 停靠港口和演出
- 货运费率趋势
- 货物吨位趋势
- 基础设施
- 法规结构(公路和铁路)
- 法规结构(海事和航空)
- 价值炼和通路分析
- 市场驱动因素
- B2C电子商务小包裹处理量呈爆炸性成长
- 由于製造业回流,国内製造业货运趋势
- 中型托运人中第三方/第四方物流外包业务的扩张
- 联邦基础设施投资和就业法案(IIJA)资金
- 数位化货运市场和基于API的运力聚合
- 零排放卡车走廊试点计画(氢燃料/纯电动汽车)
- 市场限制
- 长途司机严重短缺,但薪资不断上涨
- 港口、铁路枢纽和都市区壅塞造成的瓶颈
- 网路风险保险和合规成本飙升
- 「核弹级」陪审团裁决导致汽车保险价格飙升
- 市场创新
- 波特五力分析
- 新进入者的威胁
- 替代品的威胁
- 供应商的议价能力
- 买方的议价能力
- 竞争对手之间的竞争
第五章 市场规模与成长预测
- 终端用户产业
- 农业、渔业、林业
- 建设业
- 製造业
- 石油天然气、采矿和采石
- 批发和零售
- 其他的
- 物流职能
- 快递、快捷邮件和小包裹(CEP)
- 按目的地
- 国内的
- 国际的
- 按目的地
- 货运代理
- 透过交通工具
- 航空
- 海路和内河航道
- 其他的
- 透过交通工具
- 货物运输
- 透过交通工具
- 航空
- 管道
- 铁路
- 路
- 海路和内河航道
- 透过交通工具
- 仓储
- 透过温度控制
- 非温控型
- 温度控制
- 透过温度控制
- 其他服务
- 快递、快捷邮件和小包裹(CEP)
第六章 竞争情势
- 市场集中度
- 关键策略倡议
- 市占率分析
- 公司简介
- Amazon Logistics
- CH Robinson
- DHL Group
- DSV A/S(Including DB Schenker)
- Expeditors International of Washington, Inc.
- FedEx
- GXO Logistics, Inc.
- JB Hunt Transport, Inc.
- Kuehne+Nagel
- Landstar System, Inc.
- Lineage, Inc.
- AP Moller-Maersk
- NFI Industries
- Old Dominion Freight Line
- Penske Corporation, Inc.
- Ryder System, Inc.
- Schneider National, Inc.
- SEKO Logistics
- United Parcel Service of America, Inc.(UPS)
- XPO, Inc.
第七章 市场机会与未来展望
The United States freight and logistics market is expected to grow from USD 1,381.09 billion in 2025 to USD 1,433.58 billion in 2026 and is forecast to reach USD 1,724.6 billion by 2031 at 3.8% CAGR over 2026-2031.
This moderate trajectory reflects a maturing yet resilient landscape shaped by e-commerce fulfillment, nearshoring-driven manufacturing flows, and rapid technology adoption. Shippers shift from asset-heavy to digitally orchestrated networks, unlocking capacity optimization and real-time visibility across modes. Federal Infrastructure Investment and Jobs Act (IIJA) funds earmarked for roads, rail, and ports underpin long-term network reliability, while zero-emission truck pilots signal an accelerating transition toward sustainable transport. Competitive intensity tightens as large mergers reshape global forwarding capabilities, even as regional specialists carve niche positions around last-mile and temperature-controlled services.
United States Freight And Logistics Market Trends and Insights
Explosive B2C E-Commerce Parcel Volumes
Domestic parcel shipments increased in 2024, intensifying demand for high-frequency, short-haul movements. Amazon's February 2025 collaboration with FedEx on large packages reinforces distributed fulfillment models that blur lines between retailers and carriers. Consumers expect same-day and next-day delivery, compelling providers to hold reserve capacity during off-peak periods. Regional carriers and last-mile specialists gain share as incumbents manage margin pressure from the groundification of formerly premium air services. The shift toward direct-to-consumer channels reroutes freight from palletized to parcel flows, reshaping lane density and asset utilization requirements.
Reshoring-Driven Domestic Manufacturing Freight Flows
Supply-chain localization accelerates, supported by the CHIPS Act and the Inflation Reduction Act incentives totaling USD 280 billion. Semiconductor, automotive, and pharmaceutical projects concentrate freight demand in the Great Lakes and Southeast corridors. Shorter domestic routes increase reliance on trucking for time-critical components while competing for limited long-haul capacity. Rate premiums emerge on dense manufacturing lanes as reshored volumes stress existing networks, despite ongoing rail and port expansions. State-level incentives amplify regional freight nodes, reinforcing multimodal connectivity priorities.
Acute Long-Haul Driver Shortage and Wage Inflation
Large carriers continued battling elevated turnover in 2024 as an aging workforce and lifestyle concerns deter new entrants. Wage packages climbed as fleets offered signing bonuses, improved home time, and benefit enhancements. Electronic Logging Device mandates and hours-of-service limits reduce effective capacity even when equipment is available. Female and younger worker participation remains low, keeping the labor pool tight. Apprenticeship programs and modernized fleet amenities improve recruitment optics but have yet to close the gap.
Other drivers and restraints analyzed in the detailed report include:
- Expansion of 3PL/4PL Outsourcing Across Mid-Market Shippers
- Infrastructure Investment and Jobs Act (IIJA) Funding
- Port, Rail-Ramp and Urban Congestion Bottlenecks
For complete list of drivers and restraints, kindly check the Table Of Contents.
Segment Analysis
Manufacturing contributed 28.54% to the United States freight and logistics market size in 2025 as component inflows and finished-goods distribution multiplied with reshoring incentives. The sector favors multimodal solutions that balance cost and cycle-time, with high-value electronics and pharmaceuticals leaning on expedited services. Wholesale and retail trade, though smaller, posts the fastest 4.05% CAGR (2026-2031) as omnichannel retailing scales micro-fulfillment nodes and parcel density. Construction logistics remain steady on public infrastructure outlays, while oil, gas, mining, and quarrying see volatility tied to commodity pricing and energy policy transitions.
Agriculture, fishing, and forestry maintain a stable baseline of bulk and refrigerated moves, though seasonal variability drives flexible capacity requirements. Emerging verticals, renewable energy components, healthcare devices, and data-center equipment demand specialized handling and regulatory compliance, favoring providers with sector expertise. Across industries, supply-chain localization shifts more volume onto regional trucking lanes, intensifying competition for drivers and warehouse labor in growth corridors.
Freight transport captured 62.85% of the United States freight and logistics market share in 2025, anchored by trucking, rail, and intermodal networks that serve bulk commodities and manufacturing supply chains. CEP, while smaller, posted the strongest 4.38% CAGR (2026-2031) outlook, fueled by e-commerce parcel density clustering around metropolitan fulfillment hubs. Domestic CEP services held 76.05% share, though international small-parcel flows rise on Cross-Border e-commerce demand, supported by simplified de minimis clearance rules. Warehousing and storage demand remains robust, with non-temperature facilities comprising 92.05% of capacity in 2025, yet temperature-controlled square footage expands faster on pharmaceuticals and fresh-food logistics.
Providers blur functional lines as integrated offerings combine transportation, warehousing, and value-added services to capture deeper wallet share. Digital orchestration platforms enable real-time mode selection and inventory balancing across facility networks. CEP operators deploy automated sortation and AI-driven route optimization to offset labor constraints. In freight transport, zero-emission truck pilots and IIJA-funded corridor upgrades will alter fleet mix and regional efficiencies. The convergence of services positions full-stack providers to capitalize on secular shifts while niche specialists succeed by focusing on speed, compliance, or product integrity.
The United States Freight and Logistics Market Report is Segmented by End User Industry (Agriculture, Fishing, and Forestry, Construction, Manufacturing, Oil and Gas, Mining and Quarrying, Wholesale and Retail Trade, and Others) and by Logistics Function (Courier, Express, and Parcel (CEP), Freight Forwarding, Freight Transport, Warehousing and Storage, and Other Services). The Market Forecasts are Provided in Terms of Value (USD).
List of Companies Covered in this Report:
- Amazon Logistics
- C.H. Robinson
- DHL Group
- DSV A/S (Including DB Schenker)
- Expeditors International of Washington, Inc.
- FedEx
- GXO Logistics, Inc.
- J.B. Hunt Transport, Inc.
- Kuehne+Nagel
- Landstar System, Inc.
- Lineage, Inc.
- A.P. Moller - Maersk
- NFI Industries
- Old Dominion Freight Line
- Penske Corporation, Inc.
- Ryder System, Inc.
- Schneider National, Inc.
- SEKO Logistics
- United Parcel Service of America, Inc. (UPS)
- XPO, Inc.
Additional Benefits:
- The market estimate (ME) sheet in Excel format
- 3 months of analyst support
TABLE OF CONTENTS
1 Introduction
- 1.1 Study Assumptions and Market Definition
- 1.2 Scope of the Study
2 Research Methodology
3 Executive Summary
4 Market Landscape
- 4.1 Market Overview
- 4.2 Demographics
- 4.3 GDP Distribution by Economic Activity
- 4.4 GDP Growth by Economic Activity
- 4.5 Inflation
- 4.6 Economic Performance and Profile
- 4.6.1 Trends in E-Commerce Industry
- 4.6.2 Trends in Manufacturing Industry
- 4.7 Transport and Storage Sector GDP
- 4.8 Export Trends
- 4.9 Import Trends
- 4.10 Fuel Price
- 4.11 Trucking Operational Costs
- 4.12 Trucking Fleet Size by Type
- 4.13 Major Truck Suppliers
- 4.14 Logistics Performance
- 4.15 Modal Share
- 4.16 Maritime Fleet Load Carrying Capacity
- 4.17 Liner Shipping Connectivity
- 4.18 Port Calls and Performance
- 4.19 Freight Pricing Trends
- 4.20 Freight Tonnage Trends
- 4.21 Infrastructure
- 4.22 Regulatory Framework (Road and Rail)
- 4.23 Regulatory Framework (Sea and Air)
- 4.24 Value Chain and Distribution Channel Analysis
- 4.25 Market Drivers
- 4.25.1 Explosive B2C E-Commerce Parcel Volumes
- 4.25.2 Reshoring-Driven Domestic Manufacturing Freight Flows
- 4.25.3 Expansion of 3PL/4PL Outsourcing Across Mid-Market Shippers
- 4.25.4 Federal Infrastructure Investment and Jobs Act (IIJA) Funding
- 4.25.5 Digital Freight Marketplaces and API-Based Capacity Aggregation
- 4.25.6 Zero-Emission Truck Corridor Pilots (Hydrogen / BEV)
- 4.26 Market Restraints
- 4.26.1 Acute Long-Haul Driver Shortage and Wage Inflation
- 4.26.2 Port, Rail-Ramp and Urban Congestion Bottlenecks
- 4.26.3 Escalating Cyber-Risk Insurance and Compliance Costs
- 4.26.4 "Nuclear" Jury Verdicts Driving Motor-Carrier Insurance Spikes
- 4.27 Technology Innovations in the Market
- 4.28 Porter's Five Forces Analysis
- 4.28.1 Threat of New Entrants
- 4.28.2 Threat of Substitutes
- 4.28.3 Bargaining Power of Suppliers
- 4.28.4 Bargaining Power of Buyers
- 4.28.5 Competitive Rivalry
5 Market Size and Growth Forecasts (Value, USD)
- 5.1 End User Industry
- 5.1.1 Agriculture, Fishing, and Forestry
- 5.1.2 Construction
- 5.1.3 Manufacturing
- 5.1.4 Oil and Gas, Mining and Quarrying
- 5.1.5 Wholesale and Retail Trade
- 5.1.6 Others
- 5.2 Logistics Function
- 5.2.1 Courier, Express, and Parcel (CEP)
- 5.2.1.1 By Destination Type
- 5.2.1.1.1 Domestic
- 5.2.1.1.2 International
- 5.2.1.1 By Destination Type
- 5.2.2 Freight Forwarding
- 5.2.2.1 By Mode of Transport
- 5.2.2.1.1 Air
- 5.2.2.1.2 Sea and Inland Waterways
- 5.2.2.1.3 Others
- 5.2.2.1 By Mode of Transport
- 5.2.3 Freight Transport
- 5.2.3.1 By Mode of Transport
- 5.2.3.1.1 Air
- 5.2.3.1.2 Pipelines
- 5.2.3.1.3 Rail
- 5.2.3.1.4 Road
- 5.2.3.1.5 Sea and Inland Waterways
- 5.2.3.1 By Mode of Transport
- 5.2.4 Warehousing and Storage
- 5.2.4.1 By Temperature Control
- 5.2.4.1.1 Non-Temperature Controlled
- 5.2.4.1.2 Temperature Controlled
- 5.2.4.1 By Temperature Control
- 5.2.5 Other Services
- 5.2.1 Courier, Express, and Parcel (CEP)
6 Competitive Landscape
- 6.1 Market Concentration
- 6.2 Key Strategic Moves
- 6.3 Market Share Analysis
- 6.4 Company Profiles (Includes Global Level Overview, Market Level Overview, Core Segments, Financials as Available, Strategic Information, Market Rank/Share for Key Companies, Products and Services, and Recent Developments)
- 6.4.1 Amazon Logistics
- 6.4.2 C.H. Robinson
- 6.4.3 DHL Group
- 6.4.4 DSV A/S (Including DB Schenker)
- 6.4.5 Expeditors International of Washington, Inc.
- 6.4.6 FedEx
- 6.4.7 GXO Logistics, Inc.
- 6.4.8 J.B. Hunt Transport, Inc.
- 6.4.9 Kuehne+Nagel
- 6.4.10 Landstar System, Inc.
- 6.4.11 Lineage, Inc.
- 6.4.12 A.P. Moller - Maersk
- 6.4.13 NFI Industries
- 6.4.14 Old Dominion Freight Line
- 6.4.15 Penske Corporation, Inc.
- 6.4.16 Ryder System, Inc.
- 6.4.17 Schneider National, Inc.
- 6.4.18 SEKO Logistics
- 6.4.19 United Parcel Service of America, Inc. (UPS)
- 6.4.20 XPO, Inc.
7 Market Opportunities and Future Outlook
- 7.1 White-Space and Unmet-Need Assessment
 2026年全球货车市场报告2026年全球货运和物流市场报告2026年全球零碳运输市场报告
 货运及物流市场分析及预测(至2035年):依类型、产品类型、服务、技术、组件、应用、流程、最终使用者及运输方式划分
 2026-2030年全球货物审核与支付市场
 东协货运与物流:市场占有率分析、产业趋势与统计、成长预测(2026-2031)中东欧货运与物流:市场占有率分析、产业趋势与统计、成长预测(2026-2031 年)亚太地区货运与物流:市场占有率分析、产业趋势与统计、成长预测(2026-2031)南美货运与物流:市场占有率分析、产业趋势与统计、成长预测(2026-2031)泰国货运与物流:市场占有率分析、产业趋势与统计、成长预测(2026-2031)