


 |
市场调查报告书
商品编码
1939007
亚太地区货运与物流:市场占有率分析、产业趋势与统计、成长预测(2026-2031)Asia Pacific Freight And Logistics - Market Share Analysis, Industry Trends & Statistics, Growth Forecasts (2026 - 2031) |
||||||
※ 本网页内容可能与最新版本有所差异。详细情况请与我们联繫。
预计到 2026 年,亚太地区货运和物流市场规模将达到 28,683.6 亿美元。
这意味着从 2025 年的 2,6,983.8 亿美元成长到 2031 年的 3,8,875.8 亿美元,2026 年至 2031 年的复合年增长率为 6.27%。
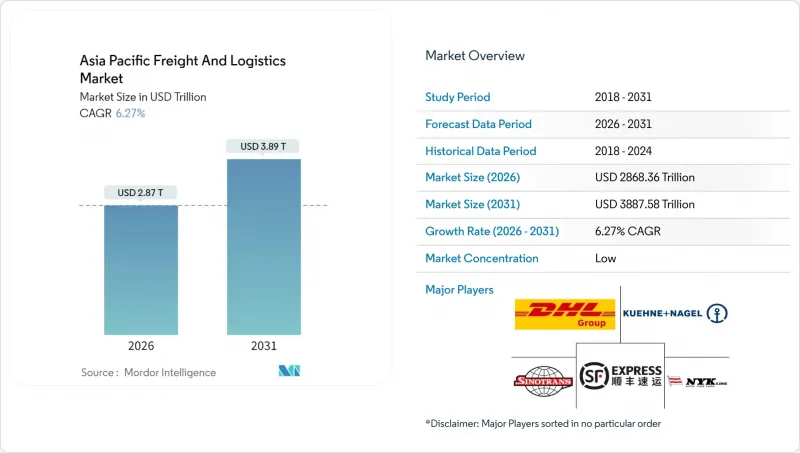
强劲的区域内贸易、全球供应链的重组以及政策主导的基础设施建设,可望推动亚太货运物流市场的持续成长。製造业向东南亚的转移以及跨境电子商务交易量的成长,正在重塑运输路线的密度和服务组合,同时降低对传统东西向干线的依赖。同时,大型公共部门计划释放港口、公路和铁路网络的潜力,增强亚太货运物流市场的长期竞争力。日益严峻的气候和安全风险促使托运人拓展业务范围并投资于数位化视觉化,从而支撑了亚太货运物流市场对获利端到端物流解决方案的需求。
亚太地区货运及物流市场趋势及洞察
电子商务小包裹量快速成长
行动装置的快速普及和电商平台的广泛渗透正推动亚洲都市区小包裹量创下历史新高。主要中央包裹服务供应商(宅配)预计到2025年将实现两位数的包裹量成长,这促使自动化分拣中心和微型仓配中心迅速部署。小包裹密度的提高降低了单位配送成本,并实现了更具竞争力的价格,进一步加速了线上消费。为缓解交通拥堵,市府正在实施路边取货区和非尖峰时段货运限制措施,间接推动了对技术驱动型末端物流平台的需求。这些因素共同作用,正推动亚太地区的货运和物流市场转向高频次、小批量配送模式。
製造业转移及近岸外包至东南亚
2024年,东协外国直接投资超过3,290亿美元,这主要得益于电子、汽车和可再生能源公司将生产从单一国家集中化。越南的出口成长和泰国的东部经济走廊是现代产业丛集如何创造新的零件和成品流通的典型例证,而这需要保税仓库、特殊的处理程序和同步的多模态能力。随着近岸工厂的成熟,回程传输不平衡现象正在缩小,从而为亚太货运和物流市场的承运人和货运代理提高了运输效率。
海关係统和文书工作分散
儘管东协单一窗口已经推出,但不同的单证规则仍然导致区域内运输耗时更长。在某些市场,物流成本超过GDP的16%,主要原因是海关延误和人工操作流程。区块链试点计画和可信任贸易业者计画展现出一定的潜力,但实施不均衡阻碍了扩充性。中小型出口商承担着不成比例的合规负担,限制了它们参与亚太地区的货运和物流市场。制定统一的数位化海关标准仍然是一项中期挑战。
细分市场分析
至2025年,製造业35.74%的营收份额将来自电子、汽车和机械产业链对跨境物流同步化的需求。这一部分将成为货运代理、仓储业者和承运商合约费率和基本密度的基础。
然而,批发和零售将成为成长最快的客户群,复合年增长率将达到6.62%(2026-2031年)。全通路零售商对敏捷履约的依赖正在推动对区域配送中心、前瞻性库存策略和退货管理能力的投资。这些需求正在推动亚太地区货运和物流市场服务结构的重组。
到2025年,货运将占亚太地区货运和物流市场收入份额的60.12%,凸显其在该地区货运和物流市场规模中的关键地位。儘管由于大量製造原料和成品的运输,整车运输和货柜运输路线仍保持高密度,但随着需求转向小包裹和更短的交货时间,预计增长速度将放缓。
受数位商务蓬勃发展和消费者服务期望不断提高的推动,预计2026年至2031年间,宅配、速递和小包裹业务收入将以6.74%的复合年增长率增长。为因应包裹处理量的激增,大型业者正在其枢纽部署高速分类机和自动导引运输车。展望未来,预计亚太地区货运和物流市场的运输方式将进一步向快递(宅配 )倾斜,小包裹份额将持续下降。
其他福利:
- Excel格式的市场预测(ME)表
- 3个月的分析师支持
目录
第一章 引言
- 研究假设和市场定义
- 调查范围
第二章调查方法
第三章执行摘要
第四章 市场情势
- 市场概览
- 人口统计数据
- 按经济活动分類的GDP分配
- 按经济活动分類的GDP成长
- 通货膨胀
- 经济表现及概览
- 电子商务产业的趋势
- 製造业趋势
- 运输和仓储业的GDP
- 出口趋势
- 进口趋势
- 燃油价格
- 卡车运输营运成本
- 卡车运输车队规模(按类型)
- 主要卡车供应商
- 物流绩效
- 按交通方式分享
- 海运船队运力
- 班轮运输连接
- 停靠港口和演出
- 货运费率趋势
- 货物吨位趋势
- 基础设施
- 法规结构(公路和铁路)
- 澳洲
- 中国
- 印度
- 印尼
- 日本
- 马来西亚
- 泰国
- 越南
- 法规结构(海事和航空)
- 澳洲
- 中国
- 印度
- 印尼
- 日本
- 马来西亚
- 泰国
- 越南
- 价值炼和通路分析
- 市场驱动因素
- 电子商务小包裹数量快速成长
- 製造业转移及近岸外包至东南亚
- 透过政府主导的大型企划发展港口、铁路和公路
- 端到端供应链数位化和视觉化工具
- 跨境B2B2C枢纽可实现3-5天送达
- 与环境、社会及公司治理(ESG)挂钩的绿色走廊奖励和永续燃料信用额度
- 市场限制
- 海关係统和文书工作分散
- 主要港口和机场长期拥堵
- 碳定价机制增加了出口运费成本
- 二、三线物流中心数位人才短缺
- 市场创新
- 波特五力分析
- 新进入者的威胁
- 买方的议价能力
- 供应商的议价能力
- 替代品的威胁
- 竞争对手之间的竞争
第五章 市场规模与成长预测
- 终端用户产业
- 农业、渔业、林业
- 建造
- 製造业
- 石油天然气、采矿和采石
- 批发和零售
- 其他的
- 物流职能
- 快递小包裹(CEP)
- 按目的地类型
- 国内的
- 国际的
- 按目的地类型
- 货运代理
- 透过交通工具
- 航空
- 海路和内河航道
- 其他的
- 透过交通工具
- 货物运输
- 透过交通工具
- 航空
- 管道
- 铁路
- 路
- 海路和内河航道
- 透过交通工具
- 仓储
- 透过温度控制
- 非温控型
- 温度控制
- 透过温度控制
- 其他服务
- 快递小包裹(CEP)
- 国家
- 澳洲
- 中国
- 印度
- 印尼
- 日本
- 马来西亚
- 泰国
- 越南
- 亚太其他地区
第六章 竞争情势
- 市场集中度
- 关键策略倡议
- 市占率分析
- 公司简介
- AP Moller-Maersk
- CH Robinson
- CJ Logistics Corporation
- DHL Group
- DP World
- DSV A/S(Including DB Schenker)
- Expeditors International of Washington, Inc.
- FedEx
- J&T Express
- JD Logistics
- Kuehne+Nagel
- LOGISTEED, Ltd.(Including Alps Logistics)
- NYK(Nippon Yusen Kaisha)Line
- SF Express(KEX-SF)
- SG Holdings Co., Ltd.
- Sinotrans, Ltd.
- Toll Group
- United Parcel Service of America, Inc.(UPS)
- XPO, Inc.
- YCH Group
第七章 市场机会与未来展望
Asia-Pacific freight and logistics market size in 2026 is estimated at USD 2,868.36 billion, growing from 2025 value of USD 2,698.38 billion with 2031 projections showing USD 3,887.58 billion, growing at 6.27% CAGR over 2026-2031.
Robust intra-Asian trade, the re-ordering of global supply chains, and policy-driven infrastructure upgrades position the Asia-Pacific freight and logistics market for sustained expansion. Manufacturing relocations into Southeast Asia, coupled with rising cross-border e-commerce volumes, are reshaping route density and service mix while tempering reliance on the traditional East-West mainline. At the same time, public-sector megaprojects are unlocking latent capacity in ports, highways, and rail links, reinforcing the long-term competitiveness of the Asia-Pacific freight and logistics market. Heightened climate and security risks are prompting shippers to diversify nodes and invest in digital visibility, supporting demand for higher-margin end-to-end logistics solutions across the Asia-Pacific freight and logistics market.
Asia Pacific Freight And Logistics Market Trends and Insights
Exploding E-commerce Parcel Volumes
Surging mobile adoption and marketplace penetration are pushing parcel counts to record highs across urban Asia. Leading CEP operators reported double-digit shipment growth in 2025, prompting rapid roll-out of automated sortation centers and micro-fulfillment hubs. Larger parcel densities are compressing unit delivery costs, enabling competitive pricing that further accelerates online spending. Urban governments are responding with curbside delivery zones and off-peak freight rules to manage congestion, indirectly reinforcing demand for technology-enabled last-mile platforms. Together, these forces are moving the Asia-Pacific freight and logistics market toward a higher-frequency, small-lot delivery paradigm.
Manufacturing Shift and Near-shoring into Southeast Asia
Foreign direct investment into ASEAN surpassed USD 329 billion in 2024, as electronics, automotive, and renewable-energy firms diversified production footprints away from single-country concentration. Vietnam's export growth and Thailand's Eastern Economic Corridor exemplify how modern industrial clusters are creating fresh flows of components and finished goods that require bonded warehousing, special-handling protocols, and synchronized multimodal capacity. As near-shored plants mature, backhaul imbalances are narrowing, unlocking rate efficiencies for carriers and forwarding agents across the Asia-Pacific freight and logistics market.
Fragmented Customs Regimes and Paperwork
Despite the ASEAN Single Window, disparate documentation rules still add several days to intra-regional transit. Logistics costs in some markets exceed 16% of GDP, driven largely by clearance delays and manual processes. While blockchain pilots and trusted-trader programs show promise, uneven implementation hinders scalability. Smaller exporters shoulder disproportionate compliance burdens, constraining their participation in the Asia-Pacific freight and logistics market. Progress toward harmonized digital customs standards remains a medium-term necessity.
Other drivers and restraints analyzed in the detailed report include:
- Government Megaprojects Upgrading Ports, Rail and Roads
- End-to-End Supply-chain Digitalization and Visibility Tools
- Chronic Congestion at Tier-1 Ports / Airports
For complete list of drivers and restraints, kindly check the Table Of Contents.
Segment Analysis
Manufacturing's 35.74% revenue share in 2025 derives from electronics, automotive, and machinery chains requiring synchronized cross-border logistics. The segment anchors contract rates and builds base density for forwarders, warehousing providers, and carriers.
Wholesale and retail trade, however, is the fastest-expanding customer pool with a 6.62% CAGR (2026-2031). Omnichannel retailers rely on responsive fulfillment frameworks, driving investment in regional distribution centers, inventory postponement strategies, and returns management capacity. These needs are recasting service menus across the Asia-Pacific freight and logistics market.
Freight transport accounted for 60.12% of 2025 revenue share, underscoring its anchor role in the Asia-Pacific freight and logistics market size. Bulk flows of manufacturing inputs and finished goods keep full-truckload and container lanes dense, yet growth is tapering as demand shifts toward smaller, faster consignments.
Courier, express, and parcel revenues are projected to rise 6.74% CAGR between 2026-2031, powered by digital-commerce momentum and rising consumer service expectations. Integrators are retrofitting hubs with high-speed sorters and autonomous guided vehicles to process soaring parcel counts. Over time, modal allocation is expected to tilt further toward CEP, moderating freight transport's share of the Asia-Pacific freight and logistics market.
The Asia Pacific Freight and Logistics Market Report is Segmented by End User Industry (Agriculture, Fishing, and Forestry, Construction, Manufacturing, and More), by Logistics Function (Courier, Express, and Parcel (CEP), Freight Forwarding, Freight Transport, Warehousing and Storage, and Other Services), and by Country (China, India, Indonesia, Malaysia, Japan, and More). The Market Forecasts are Provided in Terms of Value (USD).
List of Companies Covered in this Report:
- A.P. Moller - Maersk
- C.H. Robinson
- CJ Logistics Corporation
- DHL Group
- DP World
- DSV A/S (Including DB Schenker)
- Expeditors International of Washington, Inc.
- FedEx
- J&T Express
- JD Logistics
- Kuehne+Nagel
- LOGISTEED, Ltd. (Including Alps Logistics)
- NYK (Nippon Yusen Kaisha) Line
- SF Express (KEX-SF)
- SG Holdings Co., Ltd.
- Sinotrans, Ltd.
- Toll Group
- United Parcel Service of America, Inc. (UPS)
- XPO, Inc.
- YCH Group
Additional Benefits:
- The market estimate (ME) sheet in Excel format
- 3 months of analyst support
TABLE OF CONTENTS
1 Introduction
- 1.1 Study Assumptions and Market Definition
- 1.2 Scope of the Study
2 Research Methodology
3 Executive Summary
4 Market Landscape
- 4.1 Market Overview
- 4.2 Demographics
- 4.3 GDP Distribution by Economic Activity
- 4.4 GDP Growth by Economic Activity
- 4.5 Inflation
- 4.6 Economic Performance and Profile
- 4.6.1 Trends in E-Commerce Industry
- 4.6.2 Trends in Manufacturing Industry
- 4.7 Transport and Storage Sector GDP
- 4.8 Export Trends
- 4.9 Import Trends
- 4.10 Fuel Price
- 4.11 Trucking Operational Costs
- 4.12 Trucking Fleet Size by Type
- 4.13 Major Truck Suppliers
- 4.14 Logistics Performance
- 4.15 Modal Share
- 4.16 Maritime Fleet Load Carrying Capacity
- 4.17 Liner Shipping Connectivity
- 4.18 Port Calls and Performance
- 4.19 Freight Pricing Trends
- 4.20 Freight Tonnage Trends
- 4.21 Infrastructure
- 4.22 Regulatory Framework (Road and Rail)
- 4.22.1 Australia
- 4.22.2 China
- 4.22.3 India
- 4.22.4 Indonesia
- 4.22.5 Japan
- 4.22.6 Malaysia
- 4.22.7 Thailand
- 4.22.8 Vietnam
- 4.23 Regulatory Framework (Sea and Air)
- 4.23.1 Australia
- 4.23.2 China
- 4.23.3 India
- 4.23.4 Indonesia
- 4.23.5 Japan
- 4.23.6 Malaysia
- 4.23.7 Thailand
- 4.23.8 Vietnam
- 4.24 Value Chain and Distribution Channel Analysis
- 4.25 Market Drivers
- 4.25.1 Exploding E-Commerce Parcel Volumes
- 4.25.2 Manufacturing Shift and Near-Shoring into SE Asia
- 4.25.3 Government Megaprojects Upgrading Ports, Rail and Roads
- 4.25.4 End-To-End Supply-Chain Digitalization and Visibility Tools
- 4.25.5 Cross-Border B2B2C Hubs Enabling 3-5-Day Delivery
- 4.25.6 ESG-Linked Green-Corridor Incentives and Sustainable-Fuel Credits
- 4.26 Market Restraints
- 4.26.1 Fragmented Customs Regimes and Paperwork
- 4.26.2 Chronic Congestion at Tier-1 Ports / Airports
- 4.26.3 Carbon-Pricing Schemes Hiking Export Freight Costs
- 4.26.4 Digital-Talent Shortages in Tier-2/3 Logistics Nodes
- 4.27 Technology Innovations in the Market
- 4.28 Porter's Five Forces Analysis
- 4.28.1 Threat of New Entrants
- 4.28.2 Bargaining Power of Buyers
- 4.28.3 Bargaining Power of Suppliers
- 4.28.4 Threat of Substitutes
- 4.28.5 Intensity of Competitive Rivalry
5 Market Size and Growth Forecasts (Value, USD)
- 5.1 End User Industry
- 5.1.1 Agriculture, Fishing, and Forestry
- 5.1.2 Construction
- 5.1.3 Manufacturing
- 5.1.4 Oil and Gas, Mining and Quarrying
- 5.1.5 Wholesale and Retail Trade
- 5.1.6 Others
- 5.2 Logistics Function
- 5.2.1 Courier, Express, and Parcel (CEP)
- 5.2.1.1 By Destination Type
- 5.2.1.1.1 Domestic
- 5.2.1.1.2 International
- 5.2.1.1 By Destination Type
- 5.2.2 Freight Forwarding
- 5.2.2.1 By Mode of Transport
- 5.2.2.1.1 Air
- 5.2.2.1.2 Sea and Inland Waterways
- 5.2.2.1.3 Others
- 5.2.2.1 By Mode of Transport
- 5.2.3 Freight Transport
- 5.2.3.1 By Mode of Transport
- 5.2.3.1.1 Air
- 5.2.3.1.2 Pipelines
- 5.2.3.1.3 Rail
- 5.2.3.1.4 Road
- 5.2.3.1.5 Sea and Inland Waterways
- 5.2.3.1 By Mode of Transport
- 5.2.4 Warehousing and Storage
- 5.2.4.1 By Temperature Control
- 5.2.4.1.1 Non-Temperature Controlled
- 5.2.4.1.2 Temperature Controlled
- 5.2.4.1 By Temperature Control
- 5.2.5 Other Services
- 5.2.1 Courier, Express, and Parcel (CEP)
- 5.3 Country
- 5.3.1 Australia
- 5.3.2 China
- 5.3.3 India
- 5.3.4 Indonesia
- 5.3.5 Japan
- 5.3.6 Malaysia
- 5.3.7 Thailand
- 5.3.8 Vietnam
- 5.3.9 Rest of Asia-Pacific
6 Competitive Landscape
- 6.1 Market Concentration
- 6.2 Key Strategic Moves
- 6.3 Market Share Analysis
- 6.4 Company Profiles (Includes Global Level Overview, Market Level Overview, Core Segments, Financials as Available, Strategic Information, Market Rank/Share for Key Companies, Products and Services, and Recent Developments)
- 6.4.1 A.P. Moller - Maersk
- 6.4.2 C.H. Robinson
- 6.4.3 CJ Logistics Corporation
- 6.4.4 DHL Group
- 6.4.5 DP World
- 6.4.6 DSV A/S (Including DB Schenker)
- 6.4.7 Expeditors International of Washington, Inc.
- 6.4.8 FedEx
- 6.4.9 J&T Express
- 6.4.10 JD Logistics
- 6.4.11 Kuehne+Nagel
- 6.4.12 LOGISTEED, Ltd. (Including Alps Logistics)
- 6.4.13 NYK (Nippon Yusen Kaisha) Line
- 6.4.14 SF Express (KEX-SF)
- 6.4.15 SG Holdings Co., Ltd.
- 6.4.16 Sinotrans, Ltd.
- 6.4.17 Toll Group
- 6.4.18 United Parcel Service of America, Inc. (UPS)
- 6.4.19 XPO, Inc.
- 6.4.20 YCH Group
7 Market Opportunities and Future Outlook
- 7.1 White-Space and Unmet-Need Assessment
 2026年全球货车市场报告2026年全球货运和物流市场报告2026年全球零碳运输市场报告
 货运及物流市场分析及预测(至2035年):依类型、产品类型、服务、技术、组件、应用、流程、最终使用者及运输方式划分
 2026-2030年全球货物审核与支付市场
 东协货运与物流:市场占有率分析、产业趋势与统计、成长预测(2026-2031)中东欧货运与物流:市场占有率分析、产业趋势与统计、成长预测(2026-2031 年)南美货运与物流:市场占有率分析、产业趋势与统计、成长预测(2026-2031)泰国货运与物流:市场占有率分析、产业趋势与统计、成长预测(2026-2031)美国货运和物流:市场份额分析、行业趋势和统计数据、成长预测(2026-2031 年)