


 |
市场调查报告书
商品编码
1940842
东协货运与物流:市场占有率分析、产业趋势与统计、成长预测(2026-2031)ASEAN Freight and Logistics - Market Share Analysis, Industry Trends & Statistics, Growth Forecasts (2026 - 2031) |
||||||
※ 本网页内容可能与最新版本有所差异。详细情况请与我们联繫。
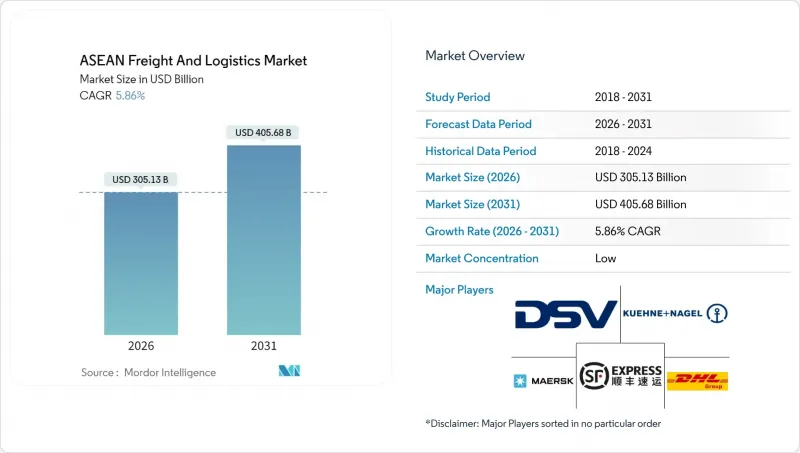
预计东协货运和物流市场规模将从 2025 年的 2,882.4 亿美元成长到 2026 年的 3,051.3 亿美元,到 2031 年将达到 4,056.8 亿美元,2026 年至 2031 年的复合年增长率为 5.86%。
电子商务的蓬勃发展、製造业供应链的重组、关税减让贸易协定的签署以及大规模公共基础设施项目的实施,共同支撑着东协十个成员国的成长动能。菲律宾加入区域全面经济伙伴协定(RCEP)后,东协货运和物流市场从中获益良多。 RCEP于2025年6月生效,取消了90%贸易商品的关税,并加快了清关程序。日益激烈的竞争推动了併购,旨在建立密集的区域网络,而电动车电池物流和药品低温运输等新兴服务领域则提供了多元化的收入来源。然而,新兴市场物流成本占GDP比重较高、国内航运限制以及运力不平衡等挑战,给营运商带来了成本压力,他们必须透过技术创新和模式优化来抵消这些压力。
东协货运及物流市场趋势及洞察
B2C电子商务的爆炸性成长推动了CEP(宅配)量的成长。
在东协主要城市,TikTok、Shopee 和 Lazada 等电商平台推动的小包裹量已超过传统货运量。平台主导的承运商分配提高了网路密度,增强了平台相对于第三方营运商的议价能力,促使营运商投资建设日处理数百万个小包裹的自动化分类中心。独角兽新创公司 Flash Express 已扩展至 1300 家门市,目前在六个国家/地区日处理高达 200 万小包裹,这充分展现了快速配送所需的营运强度。分散式履约、都市区集散中心和微旅行车队提高了最后一公里配送效率,但针对电动自行车和三轮车的区域法规阻碍了这些技术的统一部署。即时追踪和预测送达时间已成为客户的基本期望,推动了快递业者的数位化。
製造业外商直接投资向东协转移促进了区域内贸易。
外国公司将生产从东北亚转移到东盟,持续推动跨境货运代理、零件转运服务和专业仓储的需求。电子电气产品主导资本流入,马来西亚在2024年9月出口了价值341亿马币(72亿美元)的积体电路。越南的工业园区与升级后的深水港和双轨铁路走廊直接相连,实现了与内陆地区的无缝连接。准时制生产(JIT)模式提升了交付可靠性和清关效率的重要性,并增强了端到端物流整合商的价值提案。区域全面经济伙伴关係协定(RCEP)的原产地规则透过鼓励国内采购进一步推动了供应链的区域化,刺激了东协内部的货运量。
新兴东南亚国协: 16-25%
道路状况不佳、内河航道有限以及电力短缺延长了运输时间并增加了处理成本,尤其是在内陆国家和岛屿次区域。根据国际能源总署(IEA)预测,2000年至2024年间,东南亚货运石油需求预计将从每日130万桶增至每日280万桶,这将加剧交通拥堵和排放。电网不稳定和柴油发电机的高成本阻碍了低温运输的扩展,并限制了药品和生鲜食品的运输。如果资金筹措无法加速,新兴成员国将面临服务品质下降的风险,并错失参与高附加价值价值链的机会。
细分市场分析
到了2025年,製造业将占东协收入的31.74%,凸显该地区在全球电子、汽车和纺织品供应链中的关键地位。灵活的仓储和限时货运服务能够实现向越南、泰国和马来西亚工厂的准时交货。随着现代食品杂货、时尚和一般商品领域不断拓展全通路分销网络,东协在批发和零售领域的货运和物流市场份额预计将快速增长,2026年至2031年的复合年增长率将达到6.31%。农业和林业将继续透过散装和冷藏货物运输占据相当大的运输量,而建设业将推动与公共基础设施建设相关的重型货物运输。
在零售供应链中,库存管理正日益自动化,以满足波动不定的线上需求。暗店和微型仓配中心在人口密集的都市区地区迅速扩张,将配送时间缩短至两小时以内。同时,製造商为了规避地缘政治风险,正在分散工厂选址,这迫使服务供应商建立区域配送中心,以协调保税运输路线和零件流动。温控仓库在食品和製药业越来越受欢迎,预计到2024年,马来西亚Tasco公司的冷藏仓库网路运转率将达到85%至90%。
到2025年,货运业务将占总收入的60.12%,这反映了其在散装和货柜运输领域的核心地位。同时,都市区快递(CEP)将以6.78%的复合年增长率(CAGR)实现最快成长,2026年至2031年的成长主要得益于都市区电子商务需求的成长(高频小包裹递送和透明追踪)。由于自动化投资,例如曼谷和雅加达日处理能力达300万件包裹的分拣机,东协地区城市快递业者的货运和物流市场规模正在扩大。货运业透过协调清关和多区域运输,促进区域内贸易的成长,从而维持收入稳定。仓储业受益于库存本地化,特别是冷藏保管的建设,以支持不断增长的线上生鲜配送。小规模但盈利的特色服务(计划货物、逆向物流、售后配件)完善了业务组合,并帮助营运商抵御经济週期的影响。
数位转型已不再是可选项。领先的快递公司正在整合路线优化演算法和手持扫描仪,为卖家和买家提供即时状态更新。大都会圈线上药局和食材自煮包服务的扩张,增加了对温控快递的需求。本地业者可以透过整合跨境小包裹并利用东协单一窗口,缩短配送週期,并与客户建立更牢固的关係。由于各地对电动配送自行车的监管规定不尽相同,在每个城市试行推广合规车辆可以有效应对营运中的不确定性。
其他福利:
- Excel格式的市场预测(ME)表
- 3个月的分析师支持
目录
第一章 引言
- 研究假设和市场定义
- 调查范围
第二章调查方法
第三章执行摘要
第四章 市场情势
- 市场概览
- 人口统计数据
- 按经济活动分類的GDP分配
- 按经济活动分類的GDP成长
- 通货膨胀
- 经济表现及概况
- 电子商务产业的趋势
- 製造业趋势
- 运输和仓储业的GDP
- 出口趋势
- 进口趋势
- 燃油价格
- 卡车运输营运成本
- 卡车运输车队规模(按类型)
- 主要卡车供应商
- 物流绩效
- 透过交通方式分享
- 海运船队运力
- 班轮运输连接
- 停靠港口和演出
- 货运费率趋势
- 货物吨位趋势
- 基础设施
- 法规结构(公路和铁路)
- 印尼
- 马来西亚
- 泰国
- 越南
- 法规结构(海事和航空)
- 印尼
- 马来西亚
- 泰国
- 越南
- 价值炼和通路分析
- 市场驱动因素
- B2C电子商务的爆炸性成长推动了CEP交易量的成长
- 製造业外商直接投资向东协转移促进了区域内贸易。
- 公共部门在多模态走廊和港口方面投入大规模
- 扩大关税减让贸易协定(RCEP、扩大ACFTA)
- 引入东协单一窗口,实现24小时内完成海关清关
- 电动车和电池供应链的兴起催生了对专业物流的需求。
- 市场限制
- 新兴亚洲市场基础设施和物流成本占GDP的比例:16-25%
- 沿海运输和许可规则扰乱了区域货运网络
- 地缘政治关税导致物流流重组(例如,美国提案在2025年提高关税)
- 设备失衡-ISO罐和货柜供应过剩(改道后)
- 市场创新
- 波特五力分析
- 新进入者的威胁
- 买方的议价能力
- 供应商的议价能力
- 替代品的威胁
- 竞争对手之间的竞争
第五章 市场规模与成长预测
- 终端用户产业
- 农业、渔业、林业
- 建造
- 製造业
- 石油天然气、采矿和采石
- 批发和零售
- 其他的
- 物流职能
- 快递小包裹(CEP)
- 按目的地类型
- 国内的
- 国际的
- 按目的地类型
- 货运代理
- 透过交通工具
- 航空
- 海路和内河航道
- 其他的
- 透过交通工具
- 货物运输
- 透过交通工具
- 航空
- 管道
- 铁路
- 路
- 海路和内河航道
- 透过交通工具
- 仓储
- 透过温度控制
- 非温控型
- 温度控制
- 透过温度控制
- 其他服务
- 快递小包裹(CEP)
- 国家
- 印尼
- 马来西亚
- 泰国
- 越南
- 其他东南亚国协
第六章 竞争情势
- 市场集中度
- 关键策略倡议
- 市占率分析
- 公司简介
- AP Moller-Maersk
- CJ Logistics Corporation
- DHL Group
- DP World
- DSV A/S(Including DB Schenker)
- FedEx
- Flash Express
- Kuehne+Nagel
- LOGISTEED, Ltd.(Including Alps Logistics)
- Ninja Van(Including Ninja Express)
- NYK(Nippon Yusen Kaisha)Line
- Pos Indonesia(Persero)
- POS Malaysia Bhd
- PT Jalur Nugraha Ekakurir(JNE Express)
- SCGJWD Group
- SF Express(KEX-SF)
- SPX Express
- Tiong Nam Logistics Holdings Bhd
- United Parcel Service of America, Inc.(UPS)
- YCH Group
第七章 市场机会与未来展望
The ASEAN freight and logistics market is expected to grow from USD 288.24 billion in 2025 to USD 305.13 billion in 2026 and is forecast to reach USD 405.68 billion by 2031 at 5.86% CAGR over 2026-2031.
Robust e-commerce uptake, the relocation of manufacturing supply chains, tariff-cutting trade pacts, and large-scale public infrastructure programs collectively sustain growth momentum across all ten member states. The ASEAN freight and logistics market benefits from the June 2025 entry into force of the Philippines' RCEP accession, which removes duties on 90% of traded goods and accelerates customs clearances. Intensifying competition prompts mergers and acquisitions that aim to build dense regional networks, while new service niches such as EV-battery logistics and pharmaceutical cold chains diversify revenue streams. Nonetheless, high logistics-to-GDP ratios in emerging markets, cabotage restrictions, and equipment imbalances add cost pressures that operators must offset through technology and modal optimization.
ASEAN Freight And Logistics Market Trends and Insights
Explosive B2C E-commerce Growth Fuelling CEP Volumes
E-commerce platforms such as TikTok, Shopee, and Lazada have driven parcel counts that outpace traditional freight volumes across major ASEAN cities. Platform-controlled carrier allocation increases network density and bargaining power over third-party providers, prompting operators to invest in automated sortation hubs that handle millions of parcels daily. Unicorn Flash Express scaled to 1,300 branches and now processes up to 2 million parcels per day across six countries, illustrating the operational intensity required for rapid deliveries. Distributed fulfillment, urban consolidation hubs, and micro-mobility fleets improve last-mile efficiency, although inconsistent local regulations on electric bikes and trikes slow uniform deployment. Real-time tracking and predictive delivery windows become standard customer expectations, reinforcing the digitization push among CEP players.
Manufacturing FDI Shift into ASEAN Boosting Intra-Regional Trade
Foreign investors relocating production from Northeast Asia to ASEAN spur sustained demand for cross-border freight, component shuttle services, and specialized warehousing. Electronics and electrical goods dominate capital inflows, with Malaysia exporting integrated circuits worth MYR 34.1 billion (USD 7.2 billion) in September 2024. Vietnam's industrial parks link directly to upgraded deep-sea ports and double-track rail corridors, enabling seamless hinterland connectivity. Just-in-time manufacturing raises the premium on schedule reliability and customs efficiency, reinforcing the value proposition of end-to-end logistics integrators. Rules of origin under RCEP further localize supply chains by incentivizing regional content, stimulating intra-ASEAN freight volumes.
Infrastructure Gaps and 16-25% Logistics-Cost-to-GDP in Emerging AMS
Road quality deficits, limited inland waterways, and power shortages prolong transit times and inflate handling expenses, particularly in landlocked and archipelagic sub-regions. The International Energy Agency notes that oil demand from Southeast Asian freight transport rose from 1.3 million to 2.8 million barrels per day between 2000 and 2024, magnifying congestion and emissions. Cold-chain rollout is hampered by grid unreliability and high diesel generator costs, constraining pharmaceutical and fresh-produce logistics. Without accelerated infrastructure finance, emerging members risk lower service quality and missed participation in high-value supply chains.
Other drivers and restraints analyzed in the detailed report include:
- Large-Scale Public-Sector Spend on Multimodal Corridors and Ports
- Expansion of Tariff-Cutting Trade Pacts (RCEP, ACFTA Upgrades)
- Cabotage and Licensing Rules Fragmenting Regional Freight Networks
For complete list of drivers and restraints, kindly check the Table Of Contents.
Segment Analysis
Manufacturing generated 31.74% of 2025 revenue, underscoring the region's vital role in global electronics, automotive, and textile supply chains. Flexible warehousing footprints and time-definite freight services enable just-in-sequence deliveries to factories clustered in Vietnam, Thailand, and Malaysia. The ASEAN freight and logistics market share for wholesale and retail trade will rise quickly on a 6.31% CAGR (2026-2031) as modern grocery, fashion, and general merchandise segments expand omnichannel distribution networks. Agriculture and forestry continue to contribute sizable tonnage via bulk and reefer cargoes, while construction drives heavy-lift activity linked to public infrastructure builds.
Retail supply chains embrace automation to align inventory with volatile online demand. Dark stores and micro-fulfillment sites multiply in dense urban pockets, shrinking delivery promises to sub-two-hour windows. Manufacturers, meanwhile, diversify plant footprints to hedge geopolitical risk, prompting service providers to secure bonded trucking corridors and regional distribution centers that synchronize component flows. Temperature-controlled warehousing gains traction across food and pharma verticals, and capacity utilization in Malaysia's Tasco cold storage network averaged 85-90% in 2024.
The freight transport segment supplied 60.12% of 2025 revenue, reflecting its core role in bulk commodity and container movements. CEP, however, grows fastest at 6.78% CAGR (2026-2031), fueled by urban e-commerce that demands high-frequency parcel drops and transparent tracking. The ASEAN freight and logistics market size for CEP operators improves through automation investments such as 3-million-parcel-per-day sorters in Bangkok and Jakarta. Freight forwarding maintains revenue stability by orchestrating customs brokerage and multi-leg shipping for expanding intra-regional trade. Warehousing benefits from inventory localization, including chilled storage nodes that support growing online grocery traffic. Small but lucrative specialized services-project cargo, reverse logistics, and aftermarket parts-round out the portfolio and insulate operators from cyclicality.
Digital transformation is no longer optional. Leading CEP firms integrate route-optimization algorithms and handheld scanners that push real-time status updates to merchants and buyers. Temperature-controlled CEP consignments escalate as online pharmacies and meal-kit services scale in metro areas. Operators with regional footprints can consolidate cross-border parcels and leverage the ASEAN Single Window to shorten cycle times, creating stickier customer relationships. Fragmented regulations on electric delivery bikes present an operational wildcard that companies navigate by piloting compliant fleets city by city.
The ASEAN Freight and Logistics Market Report is Segmented by End User Industry (Agriculture, Fishing, and Forestry, Construction, Manufacturing, and More), by Logistics Function (Courier, Express, and Parcel (CEP), Freight Forwarding, Freight Transport, Warehousing and Storage, and Other Services), and by Country (Indonesia, Malaysia, Thailand, Vietnam, and Rest of ASEAN). The Market Forecasts are Provided in Terms of Value (USD).
List of Companies Covered in this Report:
- A.P. Moller - Maersk
- CJ Logistics Corporation
- DHL Group
- DP World
- DSV A/S (Including DB Schenker)
- FedEx
- Flash Express
- Kuehne+Nagel
- LOGISTEED, Ltd. (Including Alps Logistics)
- Ninja Van (Including Ninja Express)
- NYK (Nippon Yusen Kaisha) Line
- Pos Indonesia (Persero)
- POS Malaysia Bhd
- PT Jalur Nugraha Ekakurir (JNE Express)
- SCGJWD Group
- SF Express (KEX-SF)
- SPX Express
- Tiong Nam Logistics Holdings Bhd
- United Parcel Service of America, Inc. (UPS)
- YCH Group
Additional Benefits:
- The market estimate (ME) sheet in Excel format
- 3 months of analyst support
TABLE OF CONTENTS
1 Introduction
- 1.1 Study Assumptions and Market Definition
- 1.2 Scope of the Study
2 Research Methodology
3 Executive Summary
4 Market Landscape
- 4.1 Market Overview
- 4.2 Demographics
- 4.3 GDP Distribution by Economic Activity
- 4.4 GDP Growth by Economic Activity
- 4.5 Inflation
- 4.6 Economic Performance and Profile
- 4.6.1 Trends in E-Commerce Industry
- 4.6.2 Trends in Manufacturing Industry
- 4.7 Transport and Storage Sector GDP
- 4.8 Export Trends
- 4.9 Import Trends
- 4.10 Fuel Price
- 4.11 Trucking Operational Costs
- 4.12 Trucking Fleet Size by Type
- 4.13 Major Truck Suppliers
- 4.14 Logistics Performance
- 4.15 Modal Share
- 4.16 Maritime Fleet Load Carrying Capacity
- 4.17 Liner Shipping Connectivity
- 4.18 Port Calls and Performance
- 4.19 Freight Pricing Trends
- 4.20 Freight Tonnage Trends
- 4.21 Infrastructure
- 4.22 Regulatory Framework (Road and Rail)
- 4.22.1 Indonesia
- 4.22.2 Malaysia
- 4.22.3 Thailand
- 4.22.4 Vietnam
- 4.23 Regulatory Framework (Sea and Air)
- 4.23.1 Indonesia
- 4.23.2 Malaysia
- 4.23.3 Thailand
- 4.23.4 Vietnam
- 4.24 Value Chain and Distribution Channel Analysis
- 4.25 Market Drivers
- 4.25.1 Explosive B2C E-Commerce Growth Fuelling CEP Volumes
- 4.25.2 Manufacturing FDI Shift into ASEAN Boosting Intra-Regional Trade
- 4.25.3 Large-Scale Public-Sector Spend on Multimodal Corridors and Ports
- 4.25.4 Expansion of Tariff-Cutting Trade Pacts (RCEP, ACFTA Upgrades)
- 4.25.5 Roll-Out of ASEAN Single Window Enabling <24-Hour Customs
- 4.25.6 Emergence of EV-Battery Supply Chains Needing Specialised Logistics
- 4.26 Market Restraints
- 4.26.1 Infrastructure Gaps and 16-25 % Logistics-Cost-To-GDP in Emerging AMS
- 4.26.2 Cabotage and Licensing Rules Fragmenting Regional Freight Networks
- 4.26.3 Geopolitical Tariffs (E.G., Proposed 2025 US Hikes) Redirecting Flows
- 4.26.4 Equipment Imbalance-ISO-Tank and Container Oversupply Post-Rerouting
- 4.27 Technology Innovations in the Market
- 4.28 Porter's Five Forces Analysis
- 4.28.1 Threat of New Entrants
- 4.28.2 Bargaining Power of Buyers
- 4.28.3 Bargaining Power of Suppliers
- 4.28.4 Threat of Substitutes
- 4.28.5 Competitive Rivalry
5 Market Size and Growth Forecasts (Value, USD)
- 5.1 End User Industry
- 5.1.1 Agriculture, Fishing, and Forestry
- 5.1.2 Construction
- 5.1.3 Manufacturing
- 5.1.4 Oil and Gas, Mining and Quarrying
- 5.1.5 Wholesale and Retail Trade
- 5.1.6 Others
- 5.2 Logistics Function
- 5.2.1 Courier, Express, and Parcel (CEP)
- 5.2.1.1 By Destination Type
- 5.2.1.1.1 Domestic
- 5.2.1.1.2 International
- 5.2.1.1 By Destination Type
- 5.2.2 Freight Forwarding
- 5.2.2.1 By Mode of Transport
- 5.2.2.1.1 Air
- 5.2.2.1.2 Sea and Inland Waterways
- 5.2.2.1.3 Others
- 5.2.2.1 By Mode of Transport
- 5.2.3 Freight Transport
- 5.2.3.1 By Mode of Transport
- 5.2.3.1.1 Air
- 5.2.3.1.2 Pipelines
- 5.2.3.1.3 Rail
- 5.2.3.1.4 Road
- 5.2.3.1.5 Sea and Inland Waterways
- 5.2.3.1 By Mode of Transport
- 5.2.4 Warehousing and Storage
- 5.2.4.1 By Temperature Control
- 5.2.4.1.1 Non-Temperature Controlled
- 5.2.4.1.2 Temperature Controlled
- 5.2.4.1 By Temperature Control
- 5.2.5 Other Services
- 5.2.1 Courier, Express, and Parcel (CEP)
- 5.3 Country
- 5.3.1 Indonesia
- 5.3.2 Malaysia
- 5.3.3 Thailand
- 5.3.4 Vietnam
- 5.3.5 Rest of ASEAN
6 Competitive Landscape
- 6.1 Market Concentration
- 6.2 Key Strategic Moves
- 6.3 Market Share Analysis
- 6.4 Company Profiles (Includes Global Level Overview, Market Level Overview, Core Segments, Financials as Available, Strategic Information, Market Rank/Share for Key Companies, Products and Services, and Recent Developments)
- 6.4.1 A.P. Moller - Maersk
- 6.4.2 CJ Logistics Corporation
- 6.4.3 DHL Group
- 6.4.4 DP World
- 6.4.5 DSV A/S (Including DB Schenker)
- 6.4.6 FedEx
- 6.4.7 Flash Express
- 6.4.8 Kuehne+Nagel
- 6.4.9 LOGISTEED, Ltd. (Including Alps Logistics)
- 6.4.10 Ninja Van (Including Ninja Express)
- 6.4.11 NYK (Nippon Yusen Kaisha) Line
- 6.4.12 Pos Indonesia (Persero)
- 6.4.13 POS Malaysia Bhd
- 6.4.14 PT Jalur Nugraha Ekakurir (JNE Express)
- 6.4.15 SCGJWD Group
- 6.4.16 SF Express (KEX-SF)
- 6.4.17 SPX Express
- 6.4.18 Tiong Nam Logistics Holdings Bhd
- 6.4.19 United Parcel Service of America, Inc. (UPS)
- 6.4.20 YCH Group
7 Market Opportunities and Future Outlook
- 7.1 White-Space and Unmet-Need Assessment
 2026年全球货车市场报告2026年全球货运和物流市场报告2026年全球零碳运输市场报告
 货运及物流市场分析及预测(至2035年):依类型、产品类型、服务、技术、组件、应用、流程、最终使用者及运输方式划分
 2026-2030年全球货物审核与支付市场
 中东欧货运与物流:市场占有率分析、产业趋势与统计、成长预测(2026-2031 年)亚太地区货运与物流:市场占有率分析、产业趋势与统计、成长预测(2026-2031)南美货运与物流:市场占有率分析、产业趋势与统计、成长预测(2026-2031)泰国货运与物流:市场占有率分析、产业趋势与统计、成长预测(2026-2031)美国货运和物流:市场份额分析、行业趋势和统计数据、成长预测(2026-2031 年)