


 |
市场调查报告书
商品编码
1145451
网路经营者的电力使用数量:2021年Network Operator Power Use Grew 10% in 2021: Webscalers Grew Fastest (+25%) but Telcos Still 66% of Network Operator Total, Lowering Costs and Carbon Footprint for Industry Depend on the Mobile RAN |
||||||
本报告提供全球网路经营者的电力使用数量的相关调查,市场概要,以及各经营者类型的电力使用量,成本与碳足迹的影响等资讯。
视觉
图2:
各经营者类型的电力强度(每100万美元销售额的消耗功率数量MWh)
出处:MTN Consulting
目录
- 概要
- 能源的使用,带给成本和碳足迹影响
- 网路经营者的电力使用量2021年增加10%
- 业者对气候的影响,比电力使用复杂
- 含意
- 附录
This brief examines power consumption in the network operator industry, spanning telcos, webscalers, and carrier-neutral operators (CNNOs). This is based on a bottoms-up review of sustainability reports from 57 operators: 16 webscalers, 21 telcos and 20 CNNOs. The webscalers reviewed account for about 94% of that sector's total 2021 revenues. For telco and carrier-neutral, the surveyed companies account for a bit over 60% of revenues in the respective sectors.
Based on this large sample, we estimate that in 2021 network operators consumed approximately 467.6 Terawatt-hours (TWh) of electricity, including purchased and self-generated. Power consumption by network operators in 2021 grew by 9.8%, about the same as the 9.3% growth recorded in 2020. By operator type, webscale power consumption is booming, up 19% and 25% in 2020 and 2021, respectively, while telco power consumption grew by just 6.0% and 4.7% in the same two years. CNNOs were in the middle, recording 16% growth in power consumption in 2020, and 15% in 2021. The CNNO segment's data center specialists stand out as the biggest electricity users in the operator industry, as measured by power intensity (MWh of power per unit of revenue). In 2021, for instance, Digital Realty consumed 2,094 MWh of power per US$1M of revenue, versus 97.6 for American Tower, 82.9 for AT&T and 71.0 for Alphabet, a large tower CNNO, telco and webscaler, respectively.
Data centers rightfully get a lot of attention for their power requirements. However, despite the last few years of heavy data center investments in both the webscale and carrier-neutral market, these two segments accounted for just 22.9% and 11.1% of total network operator electricity consumption in 2021. Telcos are dominant, accounting for 66% of the three-segment total in 2021 (2020: 69.2%). Telcos' impact on the environment is even higher than this 66% would imply. For many telcos, their electricity consumption is almost entirely based on fossil fuels. KDDI's electricity consumption from renewable sources, for instance, was only 10.4% of total in 2021. Moreover, telcos consume significant amounts of non-electric energy (diesel, propane, heating oil, etc.) to power their facilities, especially mobile base stations. Africa's MTN Group, for instance, relied on diesel for 46% of its total energy consumption in 2021. For telcos to really begin reducing their carbon footprint, big improvements in both energy efficiency and fuel mix will be required in their mobile access networks.
VISUALS
Figure 2: Power intensity by
operator type (MWh consumed per US$1M in revenue)
Source: MTN Consulting.
Companies and organizations mentioned in this report include:
|
|
Table of Contents
- Summary
- Energy use impacts costs and carbon footprint
- Network operator power use up 10% in 2021
- Operators' climate impact more complex than power use
- Implications
- Appendix
List of Figures
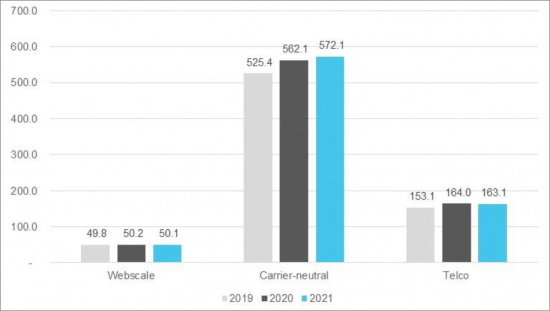
- Figure 1: Electricity consumption by operator type, 2019-21 (GWh)
- Figure 2: Power intensity by operator type (MWh consumed per US$1M in revenue)
- Figure 3: Power intensity for webscalers in sample (MWh consumed per US$1M in revenue)
- Figure 4: Power intensity for carrier-neutral operators in sample (MWh consumed per US$1M in revenue)
- Figure 5: Power intensity for telcos in sample (MWh consumed per US$1M in revenue)
- Figure 6: Telkom Indonesia's electricity consumption by facility type
- Figure 7: Components of Scope 3 emissions in 2021, Digital Realty
 全球网路规模网路营运商市场分析(2023 年第四季):
 虚拟网路营运商市场- 按服务(行动虚拟网路营运商(MVNO)、固定虚拟网路营运商(FVNO))、按产品(预付费、后付费)、按最终用户(消费者、企业)、2024 - 2032 年预测
 网路营运商预测(~2028 年):资本支出将在 2023 年下降后恢復,并在 2028 年增长至约 6500 亿美元,生成式人工智慧推动资本支出和员工人数减少
 营运商中立者希望搭乘 GenAI 浪潮 - 2023 年 1 月更新:CNNO 收入预计在 2023 年达到 100B 美元,资本密集度 >35%,因为行业抓住生成式 AI 和 5G 緻密化的机会
 运营商中立部门的2022年的OPEX电费及燃料费对剧增:对许多运营商中立部门经营者来说电费及燃料费是最大的运营成本,占OPEX (ex-D&A) 的最大80%
 运营商中立网络运营商(CNNO):市场分析(2022 Q4)CNNO将在2022投资超过450亿美元,通过资本支出和併购进行扩张,以支持运营商领域快速云端增长降低成本
 职业中性增长在行业整合中放缓2022:年市场收入接近1000亿美元,对运营商行业的健康至关重要,但易受经济压力影响,私募股权公司崛起
 22年前半期运营商中立市场的资料中心投资飙升