


 |
市场调查报告书
商品编码
1513433
全球吐司粉市场:按类型、应用、分销管道 - 机会分析与产业预测,2023-2032Toasted Flour Market By Type, By Application, By Distribution Channel : Global Opportunity Analysis and Industry Forecast, 2023-2032 |
||||||
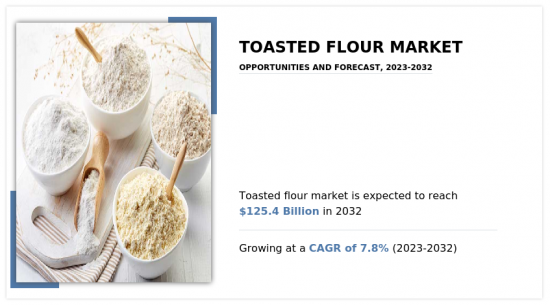
预计2022年全球吐司粉市场规模将达604亿美元,2023年至2032年复合年增长率为7.8%,2032年将达1254亿美元。
烘烤麵粉的製备过程首先要选择优质谷物(小麦是最常见的,但也可以烘烤其他谷物,例如玉米和大米)。在将谷物放在烤盘或平底锅上之前,请彻底清洗以去除污染物。有些厨师喜欢在烤箱中缓慢烘烤,而有些厨师则喜欢在炉灶上快速烘烤,不断搅拌以防止不均匀的褐变或燃烧。梅纳反应利用热作为催化剂,产生浓郁的坚果香气和焦糖般的美味,增强甜味和苦味食谱的风味。风味的增加增加了食品的深度和复杂性,并改善了整体感官体验。无论是用于烘焙点心、酱汁还是麵糊,烤麵粉都具有浓郁的芳香风味,可以愉悦您的味蕾并留下持久的印象。此外,烤麵粉的好处不仅在于其增强风味的特性,还在于其质地。烘焙改变了麵粉的物理结构,使其更细、更干,更容易融入食谱中。麵粉中的必需维生素和矿物质会因长时间受热而减少。例如,维生素 C 和 B 群维生素等热敏性微量营养素可能会劣化,使烤麵粉的营养价值低于未烤麵粉。这种营养损失可能是一个重大缺陷,特别是在以小麦粉为主要食物来源的地区。这是因为它可能会导致依赖吐司麵粉产品的社区营养缺乏。此外,吐司粉通常比普通小麦製作流程消耗更多的能量。吐司粉简介 吐司粉是食品业技术创新的广阔前景。製造商可以利用这一趋势,将吐司粉纳入现有产品线或开发突出其特性的全新产品。从自製麵包和糕点到美味酱汁和小吃,选择无穷无尽。此外,消费者对天然和低加工食品的需求不断增加,也为烤麵粉产品的市场扩张创造了有利的环境。烘焙麵粉主要是为了风味,但它也有营养价值。烘焙降低了麵粉的水分含量,延长了其保质期并降低了变质的风险。除了风味之外,烘焙麵粉还具有独特的质地,可以增强膳食的整体感觉。
本报告中的主要企业简介包括:Montana、Nutrigerm、Archer-Daniels-Midland Company、ITC Limited、Cargill Inc.、Bob's Red Mill Natural Foods Inc.、Ardent Mills Corporate、King Arthur Flour Company Inc.、Conagra Brands Inc. 、邦吉铣削公司等。为了在市场竞争中获得优势地位,各公司充分利用联盟、产品推出等策略不断努力。
相关人员的主要利益
- 本报告定量分析了 2022 年至 2032 年吐司麵粉市场分析的细分市场、当前趋势、估计/趋势分析和动态,以确定吐司麵粉市场的强大市场机会。
- 我们提供市场研究以及与市场驱动因素、市场限制和市场机会相关的资讯。
- 波特的五力分析揭示了买家和供应商的潜力,帮助相关人员做出利润驱动的业务决策并加强供应商和买家网路。
- 详细的市场区隔分析有助于识别市场机会。
- 我们根据每个地区的主要国家对全球市场的收益贡献绘製了地图。
- 市场参与者定位有助于基准化分析,并可以清楚地了解市场参与者的当前地位。
- 该报告包括对区域和全球吐司粉市场趋势、主要企业、细分市场、应用领域和市场成长策略的分析。
目录
第一章简介
第 2 章执行摘要
第三章市场概况
- 市场定义和范围
- 主要发现
- 影响因素
- 主要投资机会
- 波特五力分析
- 市场动态
- 促进因素
- 抑制因素
- 机会
- 平均售价
- 市场占有率分析
- 品牌占有率分析
- 贸易资料分析
- 产品消费
- 价值链分析
- 关键监管分析
- 专利情况
- 赎回场景
- 监管指引
第四章吐司粉市场:依类型
- 概述
- 大豆粉
- 玉米粉
- 麵粉
- 其他的
第五章吐司粉市场:依应用分类
- 概述
- 麵包和烘焙产品
- 麵条/义式麵食
- 薄脆饼干,饼干,饼干
- 动物饲料
- 其他的
第六章吐司粉市场:依通路划分
- 概述
- 大卖场
- 便利商店
- 网路商店
第七章吐司粉市场:依地区
- 概述
- 北美洲
- 美国
- 加拿大
- 墨西哥
- 欧洲
- 德国
- 英国
- 法国
- 西班牙
- 义大利
- 欧洲其他地区
- 亚太地区
- 中国
- 日本
- 印度
- 韩国
- 澳洲
- 其他亚太地区
- 拉丁美洲/中东/非洲
- 巴西
- 沙乌地阿拉伯
- 阿拉伯聯合大公国
- 南非
- 其他拉丁美洲/中东/非洲
第八章 竞争格局
- 介绍
- 关键成功策略
- 10家主要企业产品图谱
- 竞争对手仪表板
- 竞争热图
- 2022年主要企业定位
第九章 公司简介
- Montana
- Nutrigerm
- Archer-Daniels-Midland Company
- ITC Limited
- Cargill Inc.
- Bob's Red Mill Natural Foods, Inc.
- Ardent Mills Corporate
- King Arthur Flour Company Inc.
- Conagra Brands, Inc.
- Bunge Milling Inc.
Key Benefits For Stakeholders
- This report provides a quantitative analysis of the market segments, current trends, estimations, and dynamics of the toasted flour market analysis from 2022 to 2032 to identify the prevailing toasted flour market opportunities.
- The market research is offered along with information related to key drivers, restraints, and opportunities.
- Porter's five forces analysis highlights the potency of buyers and suppliers to enable stakeholders make profit-oriented business decisions and strengthen their supplier-buyer network.
- In-depth analysis of the toasted flour market segmentation assists to determine the prevailing market opportunities.
- Major countries in each region are mapped according to their revenue contribution to the global market.
- Market player positioning facilitates benchmarking and provides a clear understanding of the present position of the market players.
- The report includes the analysis of the regional as well as global toasted flour market trends, key players, market segments, application areas, and market growth strategies.
Additional benefits you will get with this purchase are:
- Quarterly Update and* (only available with a corporate license, on listed price)
- 5 additional Company Profile of client Choice pre- or Post-purchase, as a free update.
- Free Upcoming Version on the Purchase of Five and Enterprise User License.
- 16 analyst hours of support* (post-purchase, if you find additional data requirements upon review of the report, you may receive support amounting to 16 analyst hours to solve questions, and post-sale queries)
- 15% Free Customization* (in case the scope or segment of the report does not match your requirements, 15% is equivalent to 3 working days of free work, applicable once)
- Free data Pack on the Five and Enterprise User License. (Excel version of the report)
- Free Updated report if the report is 6-12 months old or older.
- 24-hour priority response*
- Free Industry updates and white papers.Possible Customization with this report (with additional cost and timeline, please talk to the sales executive to know more)
- Product Benchmarking / Product specification and applications
- Upcoming/New Entrant by Regions
- Technology Trend Analysis
- Market share analysis of players by products/segments
- New Product Development/ Product Matrix of Key Players
- Patient/epidemiology data at country, region, global level
- Regulatory Guidelines
- Additional company profiles with specific to client's interest
- Additional country or region analysis- market size and forecast
- Criss-cross segment analysis- market size and forecast
- Expanded list for Company Profiles
- Historic market data
- Key player details (including location, contact details, supplier/vendor network etc. in excel format)
- List of customers/consumers/raw material suppliers- value chain analysis
- Market share analysis of players at global/region/country level
- SWOT Analysis
Key Market Segments
By Type
- Soybean Flour
- Corn Flour
- Wheat Flour
- Others
By Application
- Bread and Bakery Products
- Noodles and Pasta
- Crackers, Cookies and Biscuits
- Animal Feed
- Others
By Distribution Channel
- Hypermarkets
- Convenience Stores
- Online Stores
By Region
- North America
- U.S.
- Canada
- Mexico
- Europe
- Germany
- UK
- France
- Spain
- Italy
- Rest of Europe
- Asia-Pacific
- China
- Japan
- India
- South Korea
- Australia
- Rest of Asia-Pacific
- LAMEA
- Brazil
- Saudi Arabia
- United Arab Emirates
- South Africa
- Rest of LAMEA
Key Market Players:
- Montana
- Nutrigerm
- Archer-Daniels-Midland Company
- ITC Limited
- Cargill Inc.
- Bob's Red Mill Natural Foods, Inc.
- Ardent Mills Corporate
- King Arthur Flour Company Inc.
- Conagra Brands, Inc.
- Bunge Milling Inc.
TABLE OF CONTENTS
CHAPTER 1: INTRODUCTION
- 1.1. Report description
- 1.2. Key market segments
- 1.3. Key benefits to the stakeholders
- 1.4. Research methodology
- 1.4.1. Primary research
- 1.4.2. Secondary research
- 1.4.3. Analyst tools and models
CHAPTER 2: EXECUTIVE SUMMARY
- 2.1. CXO perspective
CHAPTER 3: MARKET OVERVIEW
- 3.1. Market definition and scope
- 3.2. Key findings
- 3.2.1. Top impacting factors
- 3.2.2. Top investment pockets
- 3.3. Porter's five forces analysis
- 3.4. Market dynamics
- 3.4.1. Drivers
- 3.4.2. Restraints
- 3.4.3. Opportunities
- 3.5. Average Selling Price
- 3.6. Market Share Analysis
- 3.7. Brand Share Analysis
- 3.8. Trade Data Analysis
- 3.9. Product Consumption
- 3.10. Value Chain Analysis
- 3.11. Key Regulation Analysis
- 3.12. Patent Landscape
- 3.13. Reimbursement Scenario
- 3.14. Regulatory Guidelines
CHAPTER 4: TOASTED FLOUR MARKET, BY TYPE
- 4.1. Overview
- 4.1.1. Market size and forecast
- 4.2. Soybean Flour
- 4.2.1. Key market trends, growth factors and opportunities
- 4.2.2. Market size and forecast, by region
- 4.2.3. Market share analysis by country
- 4.3. Corn Flour
- 4.3.1. Key market trends, growth factors and opportunities
- 4.3.2. Market size and forecast, by region
- 4.3.3. Market share analysis by country
- 4.4. Wheat Flour
- 4.4.1. Key market trends, growth factors and opportunities
- 4.4.2. Market size and forecast, by region
- 4.4.3. Market share analysis by country
- 4.5. Others
- 4.5.1. Key market trends, growth factors and opportunities
- 4.5.2. Market size and forecast, by region
- 4.5.3. Market share analysis by country
CHAPTER 5: TOASTED FLOUR MARKET, BY APPLICATION
- 5.1. Overview
- 5.1.1. Market size and forecast
- 5.2. Bread and Bakery Products
- 5.2.1. Key market trends, growth factors and opportunities
- 5.2.2. Market size and forecast, by region
- 5.2.3. Market share analysis by country
- 5.3. Noodles and Pasta
- 5.3.1. Key market trends, growth factors and opportunities
- 5.3.2. Market size and forecast, by region
- 5.3.3. Market share analysis by country
- 5.4. Crackers, Cookies and Biscuits
- 5.4.1. Key market trends, growth factors and opportunities
- 5.4.2. Market size and forecast, by region
- 5.4.3. Market share analysis by country
- 5.5. Animal Feed
- 5.5.1. Key market trends, growth factors and opportunities
- 5.5.2. Market size and forecast, by region
- 5.5.3. Market share analysis by country
- 5.6. Others
- 5.6.1. Key market trends, growth factors and opportunities
- 5.6.2. Market size and forecast, by region
- 5.6.3. Market share analysis by country
CHAPTER 6: TOASTED FLOUR MARKET, BY DISTRIBUTION CHANNEL
- 6.1. Overview
- 6.1.1. Market size and forecast
- 6.2. Hypermarkets
- 6.2.1. Key market trends, growth factors and opportunities
- 6.2.2. Market size and forecast, by region
- 6.2.3. Market share analysis by country
- 6.3. Convenience Stores
- 6.3.1. Key market trends, growth factors and opportunities
- 6.3.2. Market size and forecast, by region
- 6.3.3. Market share analysis by country
- 6.4. Online Stores
- 6.4.1. Key market trends, growth factors and opportunities
- 6.4.2. Market size and forecast, by region
- 6.4.3. Market share analysis by country
CHAPTER 7: TOASTED FLOUR MARKET, BY REGION
- 7.1. Overview
- 7.1.1. Market size and forecast By Region
- 7.2. North America
- 7.2.1. Key market trends, growth factors and opportunities
- 7.2.2. Market size and forecast, by Type
- 7.2.3. Market size and forecast, by Application
- 7.2.4. Market size and forecast, by Distribution Channel
- 7.2.5. Market size and forecast, by country
- 7.2.5.1. U.S.
- 7.2.5.1.1. Market size and forecast, by Type
- 7.2.5.1.2. Market size and forecast, by Application
- 7.2.5.1.3. Market size and forecast, by Distribution Channel
- 7.2.5.2. Canada
- 7.2.5.2.1. Market size and forecast, by Type
- 7.2.5.2.2. Market size and forecast, by Application
- 7.2.5.2.3. Market size and forecast, by Distribution Channel
- 7.2.5.3. Mexico
- 7.2.5.3.1. Market size and forecast, by Type
- 7.2.5.3.2. Market size and forecast, by Application
- 7.2.5.3.3. Market size and forecast, by Distribution Channel
- 7.3. Europe
- 7.3.1. Key market trends, growth factors and opportunities
- 7.3.2. Market size and forecast, by Type
- 7.3.3. Market size and forecast, by Application
- 7.3.4. Market size and forecast, by Distribution Channel
- 7.3.5. Market size and forecast, by country
- 7.3.5.1. Germany
- 7.3.5.1.1. Market size and forecast, by Type
- 7.3.5.1.2. Market size and forecast, by Application
- 7.3.5.1.3. Market size and forecast, by Distribution Channel
- 7.3.5.2. UK
- 7.3.5.2.1. Market size and forecast, by Type
- 7.3.5.2.2. Market size and forecast, by Application
- 7.3.5.2.3. Market size and forecast, by Distribution Channel
- 7.3.5.3. France
- 7.3.5.3.1. Market size and forecast, by Type
- 7.3.5.3.2. Market size and forecast, by Application
- 7.3.5.3.3. Market size and forecast, by Distribution Channel
- 7.3.5.4. Spain
- 7.3.5.4.1. Market size and forecast, by Type
- 7.3.5.4.2. Market size and forecast, by Application
- 7.3.5.4.3. Market size and forecast, by Distribution Channel
- 7.3.5.5. Italy
- 7.3.5.5.1. Market size and forecast, by Type
- 7.3.5.5.2. Market size and forecast, by Application
- 7.3.5.5.3. Market size and forecast, by Distribution Channel
- 7.3.5.6. Rest of Europe
- 7.3.5.6.1. Market size and forecast, by Type
- 7.3.5.6.2. Market size and forecast, by Application
- 7.3.5.6.3. Market size and forecast, by Distribution Channel
- 7.4. Asia-Pacific
- 7.4.1. Key market trends, growth factors and opportunities
- 7.4.2. Market size and forecast, by Type
- 7.4.3. Market size and forecast, by Application
- 7.4.4. Market size and forecast, by Distribution Channel
- 7.4.5. Market size and forecast, by country
- 7.4.5.1. China
- 7.4.5.1.1. Market size and forecast, by Type
- 7.4.5.1.2. Market size and forecast, by Application
- 7.4.5.1.3. Market size and forecast, by Distribution Channel
- 7.4.5.2. Japan
- 7.4.5.2.1. Market size and forecast, by Type
- 7.4.5.2.2. Market size and forecast, by Application
- 7.4.5.2.3. Market size and forecast, by Distribution Channel
- 7.4.5.3. India
- 7.4.5.3.1. Market size and forecast, by Type
- 7.4.5.3.2. Market size and forecast, by Application
- 7.4.5.3.3. Market size and forecast, by Distribution Channel
- 7.4.5.4. South Korea
- 7.4.5.4.1. Market size and forecast, by Type
- 7.4.5.4.2. Market size and forecast, by Application
- 7.4.5.4.3. Market size and forecast, by Distribution Channel
- 7.4.5.5. Australia
- 7.4.5.5.1. Market size and forecast, by Type
- 7.4.5.5.2. Market size and forecast, by Application
- 7.4.5.5.3. Market size and forecast, by Distribution Channel
- 7.4.5.6. Rest of Asia-Pacific
- 7.4.5.6.1. Market size and forecast, by Type
- 7.4.5.6.2. Market size and forecast, by Application
- 7.4.5.6.3. Market size and forecast, by Distribution Channel
- 7.5. LAMEA
- 7.5.1. Key market trends, growth factors and opportunities
- 7.5.2. Market size and forecast, by Type
- 7.5.3. Market size and forecast, by Application
- 7.5.4. Market size and forecast, by Distribution Channel
- 7.5.5. Market size and forecast, by country
- 7.5.5.1. Brazil
- 7.5.5.1.1. Market size and forecast, by Type
- 7.5.5.1.2. Market size and forecast, by Application
- 7.5.5.1.3. Market size and forecast, by Distribution Channel
- 7.5.5.2. Saudi Arabia
- 7.5.5.2.1. Market size and forecast, by Type
- 7.5.5.2.2. Market size and forecast, by Application
- 7.5.5.2.3. Market size and forecast, by Distribution Channel
- 7.5.5.3. United Arab Emirates
- 7.5.5.3.1. Market size and forecast, by Type
- 7.5.5.3.2. Market size and forecast, by Application
- 7.5.5.3.3. Market size and forecast, by Distribution Channel
- 7.5.5.4. South Africa
- 7.5.5.4.1. Market size and forecast, by Type
- 7.5.5.4.2. Market size and forecast, by Application
- 7.5.5.4.3. Market size and forecast, by Distribution Channel
- 7.5.5.5. Rest of LAMEA
- 7.5.5.5.1. Market size and forecast, by Type
- 7.5.5.5.2. Market size and forecast, by Application
- 7.5.5.5.3. Market size and forecast, by Distribution Channel
CHAPTER 8: COMPETITIVE LANDSCAPE
- 8.1. Introduction
- 8.2. Top winning strategies
- 8.3. Product mapping of top 10 player
- 8.4. Competitive dashboard
- 8.5. Competitive heatmap
- 8.6. Top player positioning, 2022
CHAPTER 9: COMPANY PROFILES
- 9.1. Montana
- 9.1.1. Company overview
- 9.1.2. Key executives
- 9.1.3. Company snapshot
- 9.1.4. Operating business segments
- 9.1.5. Product portfolio
- 9.1.6. Business performance
- 9.1.7. Key strategic moves and developments
- 9.2. Nutrigerm
- 9.2.1. Company overview
- 9.2.2. Key executives
- 9.2.3. Company snapshot
- 9.2.4. Operating business segments
- 9.2.5. Product portfolio
- 9.2.6. Business performance
- 9.2.7. Key strategic moves and developments
- 9.3. Archer-Daniels-Midland Company
- 9.3.1. Company overview
- 9.3.2. Key executives
- 9.3.3. Company snapshot
- 9.3.4. Operating business segments
- 9.3.5. Product portfolio
- 9.3.6. Business performance
- 9.3.7. Key strategic moves and developments
- 9.4. ITC Limited
- 9.4.1. Company overview
- 9.4.2. Key executives
- 9.4.3. Company snapshot
- 9.4.4. Operating business segments
- 9.4.5. Product portfolio
- 9.4.6. Business performance
- 9.4.7. Key strategic moves and developments
- 9.5. Cargill Inc.
- 9.5.1. Company overview
- 9.5.2. Key executives
- 9.5.3. Company snapshot
- 9.5.4. Operating business segments
- 9.5.5. Product portfolio
- 9.5.6. Business performance
- 9.5.7. Key strategic moves and developments
- 9.6. Bob's Red Mill Natural Foods, Inc.
- 9.6.1. Company overview
- 9.6.2. Key executives
- 9.6.3. Company snapshot
- 9.6.4. Operating business segments
- 9.6.5. Product portfolio
- 9.6.6. Business performance
- 9.6.7. Key strategic moves and developments
- 9.7. Ardent Mills Corporate
- 9.7.1. Company overview
- 9.7.2. Key executives
- 9.7.3. Company snapshot
- 9.7.4. Operating business segments
- 9.7.5. Product portfolio
- 9.7.6. Business performance
- 9.7.7. Key strategic moves and developments
- 9.8. King Arthur Flour Company Inc.
- 9.8.1. Company overview
- 9.8.2. Key executives
- 9.8.3. Company snapshot
- 9.8.4. Operating business segments
- 9.8.5. Product portfolio
- 9.8.6. Business performance
- 9.8.7. Key strategic moves and developments
- 9.9. Conagra Brands, Inc.
- 9.9.1. Company overview
- 9.9.2. Key executives
- 9.9.3. Company snapshot
- 9.9.4. Operating business segments
- 9.9.5. Product portfolio
- 9.9.6. Business performance
- 9.9.7. Key strategic moves and developments
- 9.10. Bunge Milling Inc.
- 9.10.1. Company overview
- 9.10.2. Key executives
- 9.10.3. Company snapshot
- 9.10.4. Operating business segments
- 9.10.5. Product portfolio
- 9.10.6. Business performance
- 9.10.7. Key strategic moves and developments
LIST OF TABLES
- TABLE 01. GLOBAL TOASTED FLOUR MARKET, BY TYPE, 2022-2032 ($MILLION)
- TABLE 02. TOASTED FLOUR MARKET FOR SOYBEAN FLOUR, BY REGION, 2022-2032 ($MILLION)
- TABLE 03. TOASTED FLOUR MARKET FOR CORN FLOUR, BY REGION, 2022-2032 ($MILLION)
- TABLE 04. TOASTED FLOUR MARKET FOR WHEAT FLOUR, BY REGION, 2022-2032 ($MILLION)
- TABLE 05. TOASTED FLOUR MARKET FOR OTHERS, BY REGION, 2022-2032 ($MILLION)
- TABLE 06. GLOBAL TOASTED FLOUR MARKET, BY APPLICATION, 2022-2032 ($MILLION)
- TABLE 07. TOASTED FLOUR MARKET FOR BREAD AND BAKERY PRODUCTS, BY REGION, 2022-2032 ($MILLION)
- TABLE 08. TOASTED FLOUR MARKET FOR NOODLES AND PASTA, BY REGION, 2022-2032 ($MILLION)
- TABLE 09. TOASTED FLOUR MARKET FOR CRACKERS, COOKIES AND BISCUITS, BY REGION, 2022-2032 ($MILLION)
- TABLE 10. TOASTED FLOUR MARKET FOR ANIMAL FEED, BY REGION, 2022-2032 ($MILLION)
- TABLE 11. TOASTED FLOUR MARKET FOR OTHERS, BY REGION, 2022-2032 ($MILLION)
- TABLE 12. GLOBAL TOASTED FLOUR MARKET, BY DISTRIBUTION CHANNEL, 2022-2032 ($MILLION)
- TABLE 13. TOASTED FLOUR MARKET FOR HYPERMARKETS, BY REGION, 2022-2032 ($MILLION)
- TABLE 14. TOASTED FLOUR MARKET FOR CONVENIENCE STORES, BY REGION, 2022-2032 ($MILLION)
- TABLE 15. TOASTED FLOUR MARKET FOR ONLINE STORES, BY REGION, 2022-2032 ($MILLION)
- TABLE 16. TOASTED FLOUR MARKET, BY REGION, 2022-2032 ($MILLION)
- TABLE 17. NORTH AMERICA TOASTED FLOUR MARKET, BY TYPE, 2022-2032 ($MILLION)
- TABLE 18. NORTH AMERICA TOASTED FLOUR MARKET, BY APPLICATION, 2022-2032 ($MILLION)
- TABLE 19. NORTH AMERICA TOASTED FLOUR MARKET, BY DISTRIBUTION CHANNEL, 2022-2032 ($MILLION)
- TABLE 20. NORTH AMERICA TOASTED FLOUR MARKET, BY COUNTRY, 2022-2032 ($MILLION)
- TABLE 21. U.S. TOASTED FLOUR MARKET, BY TYPE, 2022-2032 ($MILLION)
- TABLE 22. U.S. TOASTED FLOUR MARKET, BY APPLICATION, 2022-2032 ($MILLION)
- TABLE 23. U.S. TOASTED FLOUR MARKET, BY DISTRIBUTION CHANNEL, 2022-2032 ($MILLION)
- TABLE 24. CANADA TOASTED FLOUR MARKET, BY TYPE, 2022-2032 ($MILLION)
- TABLE 25. CANADA TOASTED FLOUR MARKET, BY APPLICATION, 2022-2032 ($MILLION)
- TABLE 26. CANADA TOASTED FLOUR MARKET, BY DISTRIBUTION CHANNEL, 2022-2032 ($MILLION)
- TABLE 27. MEXICO TOASTED FLOUR MARKET, BY TYPE, 2022-2032 ($MILLION)
- TABLE 28. MEXICO TOASTED FLOUR MARKET, BY APPLICATION, 2022-2032 ($MILLION)
- TABLE 29. MEXICO TOASTED FLOUR MARKET, BY DISTRIBUTION CHANNEL, 2022-2032 ($MILLION)
- TABLE 30. EUROPE TOASTED FLOUR MARKET, BY TYPE, 2022-2032 ($MILLION)
- TABLE 31. EUROPE TOASTED FLOUR MARKET, BY APPLICATION, 2022-2032 ($MILLION)
- TABLE 32. EUROPE TOASTED FLOUR MARKET, BY DISTRIBUTION CHANNEL, 2022-2032 ($MILLION)
- TABLE 33. EUROPE TOASTED FLOUR MARKET, BY COUNTRY, 2022-2032 ($MILLION)
- TABLE 34. GERMANY TOASTED FLOUR MARKET, BY TYPE, 2022-2032 ($MILLION)
- TABLE 35. GERMANY TOASTED FLOUR MARKET, BY APPLICATION, 2022-2032 ($MILLION)
- TABLE 36. GERMANY TOASTED FLOUR MARKET, BY DISTRIBUTION CHANNEL, 2022-2032 ($MILLION)
- TABLE 37. UK TOASTED FLOUR MARKET, BY TYPE, 2022-2032 ($MILLION)
- TABLE 38. UK TOASTED FLOUR MARKET, BY APPLICATION, 2022-2032 ($MILLION)
- TABLE 39. UK TOASTED FLOUR MARKET, BY DISTRIBUTION CHANNEL, 2022-2032 ($MILLION)
- TABLE 40. FRANCE TOASTED FLOUR MARKET, BY TYPE, 2022-2032 ($MILLION)
- TABLE 41. FRANCE TOASTED FLOUR MARKET, BY APPLICATION, 2022-2032 ($MILLION)
- TABLE 42. FRANCE TOASTED FLOUR MARKET, BY DISTRIBUTION CHANNEL, 2022-2032 ($MILLION)
- TABLE 43. SPAIN TOASTED FLOUR MARKET, BY TYPE, 2022-2032 ($MILLION)
- TABLE 44. SPAIN TOASTED FLOUR MARKET, BY APPLICATION, 2022-2032 ($MILLION)
- TABLE 45. SPAIN TOASTED FLOUR MARKET, BY DISTRIBUTION CHANNEL, 2022-2032 ($MILLION)
- TABLE 46. ITALY TOASTED FLOUR MARKET, BY TYPE, 2022-2032 ($MILLION)
- TABLE 47. ITALY TOASTED FLOUR MARKET, BY APPLICATION, 2022-2032 ($MILLION)
- TABLE 48. ITALY TOASTED FLOUR MARKET, BY DISTRIBUTION CHANNEL, 2022-2032 ($MILLION)
- TABLE 49. REST OF EUROPE TOASTED FLOUR MARKET, BY TYPE, 2022-2032 ($MILLION)
- TABLE 50. REST OF EUROPE TOASTED FLOUR MARKET, BY APPLICATION, 2022-2032 ($MILLION)
- TABLE 51. REST OF EUROPE TOASTED FLOUR MARKET, BY DISTRIBUTION CHANNEL, 2022-2032 ($MILLION)
- TABLE 52. ASIA-PACIFIC TOASTED FLOUR MARKET, BY TYPE, 2022-2032 ($MILLION)
- TABLE 53. ASIA-PACIFIC TOASTED FLOUR MARKET, BY APPLICATION, 2022-2032 ($MILLION)
- TABLE 54. ASIA-PACIFIC TOASTED FLOUR MARKET, BY DISTRIBUTION CHANNEL, 2022-2032 ($MILLION)
- TABLE 55. ASIA-PACIFIC TOASTED FLOUR MARKET, BY COUNTRY, 2022-2032 ($MILLION)
- TABLE 56. CHINA TOASTED FLOUR MARKET, BY TYPE, 2022-2032 ($MILLION)
- TABLE 57. CHINA TOASTED FLOUR MARKET, BY APPLICATION, 2022-2032 ($MILLION)
- TABLE 58. CHINA TOASTED FLOUR MARKET, BY DISTRIBUTION CHANNEL, 2022-2032 ($MILLION)
- TABLE 59. JAPAN TOASTED FLOUR MARKET, BY TYPE, 2022-2032 ($MILLION)
- TABLE 60. JAPAN TOASTED FLOUR MARKET, BY APPLICATION, 2022-2032 ($MILLION)
- TABLE 61. JAPAN TOASTED FLOUR MARKET, BY DISTRIBUTION CHANNEL, 2022-2032 ($MILLION)
- TABLE 62. INDIA TOASTED FLOUR MARKET, BY TYPE, 2022-2032 ($MILLION)
- TABLE 63. INDIA TOASTED FLOUR MARKET, BY APPLICATION, 2022-2032 ($MILLION)
- TABLE 64. INDIA TOASTED FLOUR MARKET, BY DISTRIBUTION CHANNEL, 2022-2032 ($MILLION)
- TABLE 65. SOUTH KOREA TOASTED FLOUR MARKET, BY TYPE, 2022-2032 ($MILLION)
- TABLE 66. SOUTH KOREA TOASTED FLOUR MARKET, BY APPLICATION, 2022-2032 ($MILLION)
- TABLE 67. SOUTH KOREA TOASTED FLOUR MARKET, BY DISTRIBUTION CHANNEL, 2022-2032 ($MILLION)
- TABLE 68. AUSTRALIA TOASTED FLOUR MARKET, BY TYPE, 2022-2032 ($MILLION)
- TABLE 69. AUSTRALIA TOASTED FLOUR MARKET, BY APPLICATION, 2022-2032 ($MILLION)
- TABLE 70. AUSTRALIA TOASTED FLOUR MARKET, BY DISTRIBUTION CHANNEL, 2022-2032 ($MILLION)
- TABLE 71. REST OF ASIA-PACIFIC TOASTED FLOUR MARKET, BY TYPE, 2022-2032 ($MILLION)
- TABLE 72. REST OF ASIA-PACIFIC TOASTED FLOUR MARKET, BY APPLICATION, 2022-2032 ($MILLION)
- TABLE 73. REST OF ASIA-PACIFIC TOASTED FLOUR MARKET, BY DISTRIBUTION CHANNEL, 2022-2032 ($MILLION)
- TABLE 74. LAMEA TOASTED FLOUR MARKET, BY TYPE, 2022-2032 ($MILLION)
- TABLE 75. LAMEA TOASTED FLOUR MARKET, BY APPLICATION, 2022-2032 ($MILLION)
- TABLE 76. LAMEA TOASTED FLOUR MARKET, BY DISTRIBUTION CHANNEL, 2022-2032 ($MILLION)
- TABLE 77. LAMEA TOASTED FLOUR MARKET, BY COUNTRY, 2022-2032 ($MILLION)
- TABLE 78. BRAZIL TOASTED FLOUR MARKET, BY TYPE, 2022-2032 ($MILLION)
- TABLE 79. BRAZIL TOASTED FLOUR MARKET, BY APPLICATION, 2022-2032 ($MILLION)
- TABLE 80. BRAZIL TOASTED FLOUR MARKET, BY DISTRIBUTION CHANNEL, 2022-2032 ($MILLION)
- TABLE 81. SAUDI ARABIA TOASTED FLOUR MARKET, BY TYPE, 2022-2032 ($MILLION)
- TABLE 82. SAUDI ARABIA TOASTED FLOUR MARKET, BY APPLICATION, 2022-2032 ($MILLION)
- TABLE 83. SAUDI ARABIA TOASTED FLOUR MARKET, BY DISTRIBUTION CHANNEL, 2022-2032 ($MILLION)
- TABLE 84. UNITED ARAB EMIRATES TOASTED FLOUR MARKET, BY TYPE, 2022-2032 ($MILLION)
- TABLE 85. UNITED ARAB EMIRATES TOASTED FLOUR MARKET, BY APPLICATION, 2022-2032 ($MILLION)
- TABLE 86. UNITED ARAB EMIRATES TOASTED FLOUR MARKET, BY DISTRIBUTION CHANNEL, 2022-2032 ($MILLION)
- TABLE 87. SOUTH AFRICA TOASTED FLOUR MARKET, BY TYPE, 2022-2032 ($MILLION)
- TABLE 88. SOUTH AFRICA TOASTED FLOUR MARKET, BY APPLICATION, 2022-2032 ($MILLION)
- TABLE 89. SOUTH AFRICA TOASTED FLOUR MARKET, BY DISTRIBUTION CHANNEL, 2022-2032 ($MILLION)
- TABLE 90. REST OF LAMEA TOASTED FLOUR MARKET, BY TYPE, 2022-2032 ($MILLION)
- TABLE 91. REST OF LAMEA TOASTED FLOUR MARKET, BY APPLICATION, 2022-2032 ($MILLION)
- TABLE 92. REST OF LAMEA TOASTED FLOUR MARKET, BY DISTRIBUTION CHANNEL, 2022-2032 ($MILLION)
- TABLE 93. MONTANA: KEY EXECUTIVES
- TABLE 94. MONTANA: COMPANY SNAPSHOT
- TABLE 95. MONTANA: PRODUCT SEGMENTS
- TABLE 96. MONTANA: SERVICE SEGMENTS
- TABLE 97. MONTANA: PRODUCT PORTFOLIO
- TABLE 98. MONTANA: KEY STRATEGIES
- TABLE 99. NUTRIGERM: KEY EXECUTIVES
- TABLE 100. NUTRIGERM: COMPANY SNAPSHOT
- TABLE 101. NUTRIGERM: PRODUCT SEGMENTS
- TABLE 102. NUTRIGERM: SERVICE SEGMENTS
- TABLE 103. NUTRIGERM: PRODUCT PORTFOLIO
- TABLE 104. NUTRIGERM: KEY STRATEGIES
- TABLE 105. ARCHER-DANIELS-MIDLAND COMPANY: KEY EXECUTIVES
- TABLE 106. ARCHER-DANIELS-MIDLAND COMPANY: COMPANY SNAPSHOT
- TABLE 107. ARCHER-DANIELS-MIDLAND COMPANY: PRODUCT SEGMENTS
- TABLE 108. ARCHER-DANIELS-MIDLAND COMPANY: SERVICE SEGMENTS
- TABLE 109. ARCHER-DANIELS-MIDLAND COMPANY: PRODUCT PORTFOLIO
- TABLE 110. ARCHER-DANIELS-MIDLAND COMPANY: KEY STRATEGIES
- TABLE 111. ITC LIMITED: KEY EXECUTIVES
- TABLE 112. ITC LIMITED: COMPANY SNAPSHOT
- TABLE 113. ITC LIMITED: PRODUCT SEGMENTS
- TABLE 114. ITC LIMITED: SERVICE SEGMENTS
- TABLE 115. ITC LIMITED: PRODUCT PORTFOLIO
- TABLE 116. ITC LIMITED: KEY STRATEGIES
- TABLE 117. CARGILL INC.: KEY EXECUTIVES
- TABLE 118. CARGILL INC.: COMPANY SNAPSHOT
- TABLE 119. CARGILL INC.: PRODUCT SEGMENTS
- TABLE 120. CARGILL INC.: SERVICE SEGMENTS
- TABLE 121. CARGILL INC.: PRODUCT PORTFOLIO
- TABLE 122. CARGILL INC.: KEY STRATEGIES
- TABLE 123. BOB'S RED MILL NATURAL FOODS, INC.: KEY EXECUTIVES
- TABLE 124. BOB'S RED MILL NATURAL FOODS, INC.: COMPANY SNAPSHOT
- TABLE 125. BOB'S RED MILL NATURAL FOODS, INC.: PRODUCT SEGMENTS
- TABLE 126. BOB'S RED MILL NATURAL FOODS, INC.: SERVICE SEGMENTS
- TABLE 127. BOB'S RED MILL NATURAL FOODS, INC.: PRODUCT PORTFOLIO
- TABLE 128. BOB'S RED MILL NATURAL FOODS, INC.: KEY STRATEGIES
- TABLE 129. ARDENT MILLS CORPORATE: KEY EXECUTIVES
- TABLE 130. ARDENT MILLS CORPORATE: COMPANY SNAPSHOT
- TABLE 131. ARDENT MILLS CORPORATE: PRODUCT SEGMENTS
- TABLE 132. ARDENT MILLS CORPORATE: SERVICE SEGMENTS
- TABLE 133. ARDENT MILLS CORPORATE: PRODUCT PORTFOLIO
- TABLE 134. ARDENT MILLS CORPORATE: KEY STRATEGIES
- TABLE 135. KING ARTHUR FLOUR COMPANY INC.: KEY EXECUTIVES
- TABLE 136. KING ARTHUR FLOUR COMPANY INC.: COMPANY SNAPSHOT
- TABLE 137. KING ARTHUR FLOUR COMPANY INC.: PRODUCT SEGMENTS
- TABLE 138. KING ARTHUR FLOUR COMPANY INC.: SERVICE SEGMENTS
- TABLE 139. KING ARTHUR FLOUR COMPANY INC.: PRODUCT PORTFOLIO
- TABLE 140. KING ARTHUR FLOUR COMPANY INC.: KEY STRATEGIES
- TABLE 141. CONAGRA BRANDS, INC.: KEY EXECUTIVES
- TABLE 142. CONAGRA BRANDS, INC.: COMPANY SNAPSHOT
- TABLE 143. CONAGRA BRANDS, INC.: PRODUCT SEGMENTS
- TABLE 144. CONAGRA BRANDS, INC.: SERVICE SEGMENTS
- TABLE 145. CONAGRA BRANDS, INC.: PRODUCT PORTFOLIO
- TABLE 146. CONAGRA BRANDS, INC.: KEY STRATEGIES
- TABLE 147. BUNGE MILLING INC.: KEY EXECUTIVES
- TABLE 148. BUNGE MILLING INC.: COMPANY SNAPSHOT
- TABLE 149. BUNGE MILLING INC.: PRODUCT SEGMENTS
- TABLE 150. BUNGE MILLING INC.: SERVICE SEGMENTS
- TABLE 151. BUNGE MILLING INC.: PRODUCT PORTFOLIO
- TABLE 152. BUNGE MILLING INC.: KEY STRATEGIES
LIST OF FIGURES
- FIGURE 01. TOASTED FLOUR MARKET, 2022-2032
- FIGURE 02. SEGMENTATION OF TOASTED FLOUR MARKET,2022-2032
- FIGURE 03. TOP IMPACTING FACTORS IN TOASTED FLOUR MARKET
- FIGURE 04. TOP INVESTMENT POCKETS IN TOASTED FLOUR MARKET (2023-2032)
- FIGURE 05. BARGAINING POWER OF SUPPLIERS
- FIGURE 06. BARGAINING POWER OF BUYERS
- FIGURE 07. THREAT OF SUBSTITUTION
- FIGURE 08. THREAT OF SUBSTITUTION
- FIGURE 09. COMPETITIVE RIVALRY
- FIGURE 10. GLOBAL TOASTED FLOUR MARKET:DRIVERS, RESTRAINTS AND OPPORTUNITIES
- FIGURE 11. IMPACT OF KEY REGULATION: TOASTED FLOUR MARKET
- FIGURE 12. PATENT ANALYSIS BY COMPANY
- FIGURE 13. PATENT ANALYSIS BY COUNTRY
- FIGURE 14. TOASTED FLOUR MARKET, BY TYPE, 2022 AND 2032(%)
- FIGURE 15. COMPARATIVE SHARE ANALYSIS OF TOASTED FLOUR MARKET FOR SOYBEAN FLOUR, BY COUNTRY 2022 AND 2032(%)
- FIGURE 16. COMPARATIVE SHARE ANALYSIS OF TOASTED FLOUR MARKET FOR CORN FLOUR, BY COUNTRY 2022 AND 2032(%)
- FIGURE 17. COMPARATIVE SHARE ANALYSIS OF TOASTED FLOUR MARKET FOR WHEAT FLOUR, BY COUNTRY 2022 AND 2032(%)
- FIGURE 18. COMPARATIVE SHARE ANALYSIS OF TOASTED FLOUR MARKET FOR OTHERS, BY COUNTRY 2022 AND 2032(%)
- FIGURE 19. TOASTED FLOUR MARKET, BY APPLICATION, 2022 AND 2032(%)
- FIGURE 20. COMPARATIVE SHARE ANALYSIS OF TOASTED FLOUR MARKET FOR BREAD AND BAKERY PRODUCTS, BY COUNTRY 2022 AND 2032(%)
- FIGURE 21. COMPARATIVE SHARE ANALYSIS OF TOASTED FLOUR MARKET FOR NOODLES AND PASTA, BY COUNTRY 2022 AND 2032(%)
- FIGURE 22. COMPARATIVE SHARE ANALYSIS OF TOASTED FLOUR MARKET FOR CRACKERS, COOKIES AND BISCUITS, BY COUNTRY 2022 AND 2032(%)
- FIGURE 23. COMPARATIVE SHARE ANALYSIS OF TOASTED FLOUR MARKET FOR ANIMAL FEED, BY COUNTRY 2022 AND 2032(%)
- FIGURE 24. COMPARATIVE SHARE ANALYSIS OF TOASTED FLOUR MARKET FOR OTHERS, BY COUNTRY 2022 AND 2032(%)
- FIGURE 25. TOASTED FLOUR MARKET, BY DISTRIBUTION CHANNEL, 2022 AND 2032(%)
- FIGURE 26. COMPARATIVE SHARE ANALYSIS OF TOASTED FLOUR MARKET FOR HYPERMARKETS, BY COUNTRY 2022 AND 2032(%)
- FIGURE 27. COMPARATIVE SHARE ANALYSIS OF TOASTED FLOUR MARKET FOR CONVENIENCE STORES, BY COUNTRY 2022 AND 2032(%)
- FIGURE 28. COMPARATIVE SHARE ANALYSIS OF TOASTED FLOUR MARKET FOR ONLINE STORES, BY COUNTRY 2022 AND 2032(%)
- FIGURE 29. TOASTED FLOUR MARKET BY REGION, 2022 AND 2032(%)
- FIGURE 30. U.S. TOASTED FLOUR MARKET, 2022-2032 ($MILLION)
- FIGURE 31. CANADA TOASTED FLOUR MARKET, 2022-2032 ($MILLION)
- FIGURE 32. MEXICO TOASTED FLOUR MARKET, 2022-2032 ($MILLION)
- FIGURE 33. GERMANY TOASTED FLOUR MARKET, 2022-2032 ($MILLION)
- FIGURE 34. UK TOASTED FLOUR MARKET, 2022-2032 ($MILLION)
- FIGURE 35. FRANCE TOASTED FLOUR MARKET, 2022-2032 ($MILLION)
- FIGURE 36. SPAIN TOASTED FLOUR MARKET, 2022-2032 ($MILLION)
- FIGURE 37. ITALY TOASTED FLOUR MARKET, 2022-2032 ($MILLION)
- FIGURE 38. REST OF EUROPE TOASTED FLOUR MARKET, 2022-2032 ($MILLION)
- FIGURE 39. CHINA TOASTED FLOUR MARKET, 2022-2032 ($MILLION)
- FIGURE 40. JAPAN TOASTED FLOUR MARKET, 2022-2032 ($MILLION)
- FIGURE 41. INDIA TOASTED FLOUR MARKET, 2022-2032 ($MILLION)
- FIGURE 42. SOUTH KOREA TOASTED FLOUR MARKET, 2022-2032 ($MILLION)
- FIGURE 43. AUSTRALIA TOASTED FLOUR MARKET, 2022-2032 ($MILLION)
- FIGURE 44. REST OF ASIA-PACIFIC TOASTED FLOUR MARKET, 2022-2032 ($MILLION)
- FIGURE 45. BRAZIL TOASTED FLOUR MARKET, 2022-2032 ($MILLION)
- FIGURE 46. SAUDI ARABIA TOASTED FLOUR MARKET, 2022-2032 ($MILLION)
- FIGURE 47. UNITED ARAB EMIRATES TOASTED FLOUR MARKET, 2022-2032 ($MILLION)
- FIGURE 48. SOUTH AFRICA TOASTED FLOUR MARKET, 2022-2032 ($MILLION)
- FIGURE 49. REST OF LAMEA TOASTED FLOUR MARKET, 2022-2032 ($MILLION)
- FIGURE 50. TOP WINNING STRATEGIES, BY YEAR
- FIGURE 51. TOP WINNING STRATEGIES, BY DEVELOPMENT
- FIGURE 52. TOP WINNING STRATEGIES, BY COMPANY
- FIGURE 53. PRODUCT MAPPING OF TOP 10 PLAYERS
- FIGURE 54. COMPETITIVE DASHBOARD
- FIGURE 55. COMPETITIVE HEATMAP: TOASTED FLOUR MARKET
- FIGURE 56. TOP PLAYER POSITIONING, 2022
 全球高蛋白麵粉市场商业麵粉市场机会、成长动力、产业趋势分析及 2025-2034 年预测
 2030 年商务用小麦粉市场预测:按小麦粉类型、加工技术、应用、最终用户和地区进行的全球分析
 低黏度改质(稀煮)淀粉的全球市场规模:按产品、应用、地区、范围和预测
 到 2031 年北美有机麵粉市场预测 - 区域分析 - 按产品类型、类别和配销通路
 欧洲有机麵粉市场预测至 2031 年 - 区域分析 - 按产品类型、类别和配销通路自发麵粉市场机会、成长驱动因素、产业趋势分析与预测 2024-2032
 大麦麦芽市场报告:2030 年趋势、预测与竞争分析
 全球烤麵粉市场:规模、份额、趋势分析报告(按类型、分销管道、应用、区域展望和预测,2024-2031)到 2030 年预煮玉米粉市场预测:按产品、原产地、分销管道、最终用户和地区进行的全球分析