


 |
市场调查报告书
商品编码
1699425
数位看板市场机会、成长动力、产业趋势分析及 2025-2034 年预测Digital Signage Market Opportunity, Growth Drivers, Industry Trend Analysis, and Forecast 2025-2034 |
||||||
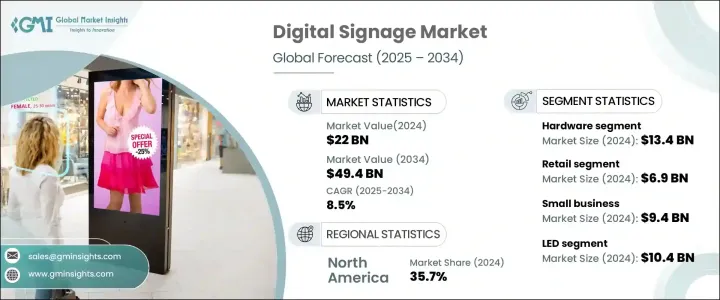
2024 年全球数位看板市场价值为 220 亿美元,预计 2025 年至 2034 年期间的复合年成长率将达到 8.5%。这一成长主要得益于数位户外 (DOOH) 广告和人工智慧驱动内容的日益普及。企业正迅速从静态广告看板转向动态数位显示萤幕,提供即时内容更新、增强参与度和精准定位的广告。对云端支援、物联网驱动的数位看板的需求正在上升,这使得企业能够远端管理内容并利用人们对 DOOH 广告日益成长的兴趣。 5G技术的部署进一步促进了无缝内容管理,确保了即时更新和个人化的推广策略。
人工智慧整合是推动市场扩张的另一个关键因素。人工智慧数位显示器可实现即时内容调整、受众分析和个人化广告。企业正在利用这些功能来分析消费者行为并提供有针对性的促销。随着零售店、交通枢纽和智慧城市扩大采用人工智慧标牌,对互动式和语音控制显示器的需求持续激增。人工智慧的进步正在提高广告的精准度,使企业能够更有效地与受众互动。
| 市场范围 | |
|---|---|
| 起始年份 | 2024 |
| 预测年份 | 2025-2034 |
| 起始值 | 220亿美元 |
| 预测值 | 494亿美元 |
| 复合年成长率 | 8.5% |
就组件而言,市场分为硬体、软体和服务。硬体领域由于显示技术的进步仍将是最大的领域,到 2024 年其价值将达到 134 亿美元。企业正在从 LCD 萤幕转向节能的 LED、OLED 和 MicroLED 显示器,这些显示器可提供卓越的影像品质、更低的功耗和增强的耐用性。对 4K 和 8K 标誌的需求正在上升,特别是在需要高解析度视觉效果以获得沉浸式广告体验的领域。
应用领域多元,涵盖零售、医疗保健、饭店、交通、教育、企业环境和银行业。零售业是占主导地位的行业,受互动式标牌和人工智慧个人化投资增加的推动,零售业的规模到 2024 年将达到 69 亿美元。零售商正在整合这些数位显示器,以增强消费者参与度、简化广告并提高营运效率。
根据最终用户,市场分为小型企业、中型企业和大型企业。受订阅式数位看板软体价格实惠的推动,小型企业在 2024 年的收入将达到 94 亿美元。即插即用标牌解决方案的出现使得小型企业能够以最少的技术专长和投资采用数位广告。
在显示器类型中,LED显示器占据最大占有率,到2024年将达到104亿美元。其高亮度和耐候性使其成为户外广告和大型商业显示器的理想选择。 LED 面板成本的下降和製造流程的进步进一步促进了其应用。
室内数位看板的价值到 2024 年将达到 138 亿美元,由于对店内显示器、自助服务亭和互动式品牌参与解决方案的需求不断成长,室内数位看板仍将占据主导地位。用于导航和虚拟辅助的触控萤幕标誌的普及度持续上升,增强了消费者体验。
随着零售商扩大使用小型数位显示器进行动态定价、产品推荐和店内促销,小型数位显示器(尤其是 32 吋以下的数位显示器)的市场规模到 2024 年将达到 60 亿美元。这些经济高效的解决方案迎合了寻求以可负担的价格进入数位广告领域的小型企业的需求。
互动内容是成长最快的部分,预计复合年成长率为 11.5%。触控萤幕功能、运动感应器和人工智慧驱动的个人化正在彻底改变数位标牌,自助订购亭和虚拟试穿解决方案越来越受欢迎。零售商和商业空间正在迅速采用这些技术来增强客户参与度。
2024 年,北美占据市场主导地位,占有 35.7% 的占有率,企业大力投资人工智慧驱动的内容管理和定向广告。政府支持智慧城市发展和基础设施改善的举措进一步推动了该地区数位看板解决方案的采用。
目录
第1章:方法论与范围
- 市场范围和定义
- 基础估算与计算
- 预测计算
- 资料来源
- 基本的
- 次要
- 付费来源
- 公共资源
第2章:执行摘要
第3章:行业洞察
- 产业生态系统分析
- 供应商矩阵
- 利润率分析
- 技术与创新格局
- 专利分析
- 重要新闻和举措
- 监管格局
- 衝击力
- 成长动力
- 对供应链透明度的需求不断成长
- 显示技术的进步
- 互动内容的需求不断增加
- 智慧城市和基础建设的成长
- 降低成本并提高投资报酬率
- 零售业的采用率不断提高
- 产业陷阱与挑战
- 初期投资及维护成本高
- 内容管理的复杂性
- 成长动力
- 成长潜力分析
- 波特的分析
- PESTEL分析
第4章:竞争格局
- 介绍
- 公司市占率分析
- 竞争定位矩阵
- 战略展望矩阵
第5章:市场估计与预测:按显示类型,2021 - 2034 年
- 主要趋势
- 液晶显示器
- 引领
- OLED
- 其他
第6章:市场估计与预测:按组件,2021 - 2034 年
- 主要趋势
- 硬体
- 软体
- 服务
第7章:市场估计与预测:按地区,2021 - 2034 年
- 主要趋势
- 室内的
- 户外的
第8章:市场估计与预测:依显示器尺寸,2021 - 2034 年
- 主要趋势
- 低于32英寸
- 32至52英寸
- 52吋以上
第9章:市场估计与预测:依内容类型,2021 - 2034 年
- 主要趋势
- 静止的
- 动态的
- 互动的
第10章:市场估计与预测:依最终用途,2021 - 2034 年
- 主要趋势
- 小型企业
- 中型企业
- 大型企业
第 11 章:市场估计与预测:按应用,2021 年至 2034 年
- 主要趋势
- 零售
- 卫生保健
- 饭店业
- 运输
- 教育
- 公司的
- 银行业
- 其他
第 12 章:市场估计与预测:按地区,2021 年至 2034 年
- 主要趋势
- 北美洲
- 美国
- 加拿大
- 欧洲
- 英国
- 德国
- 法国
- 义大利
- 西班牙
- 欧洲其他地区
- 亚太地区
- 中国
- 印度
- 日本
- 韩国
- 澳新银行
- 亚太其他地区
- 拉丁美洲
- 巴西
- 墨西哥
- 拉丁美洲其他地区
- MEA
- 阿拉伯联合大公国
- 南非
- 沙乌地阿拉伯
- MEA 其余地区
第13章:公司简介
- BrightSign LLC
- Cisco Systems
- Daktronics
- Elo Touch Solutions
- Four Winds Interactive
- LG Electronics
- Mvix Digital Signage
- Navori Labs
- NEC Corporation
- Onelan Limited
- Panasonic Corporation
- Philips Professional Display Solutions
- Planar Systems
- Samsung Electronics
- Scala, Inc.
- Sharp Corporation
- Sony Corporation
- Toshiba Global Commerce Solutions
- ViewSonic Corporation
- Visix, Inc.
The Global Digital Signage Market, valued at USD 22 billion in 2024, is expected to expand at an 8.5% CAGR from 2025 to 2034. This growth is primarily fueled by the increasing adoption of digital out-of-home (DOOH) advertising and AI-driven content. Businesses are rapidly transitioning from static billboards to dynamic digital displays that offer real-time content updates, enhanced engagement, and precision-targeted advertising. The demand for cloud-supported, IoT-powered digital signage is rising, enabling businesses to manage content remotely and capitalize on the growing interest in DOOH advertising. The deployment of 5G technology further facilitates seamless content management, ensuring real-time updates and personalized promotional strategies.
AI integration is another critical factor driving market expansion. AI-powered digital displays enable real-time content adjustments, audience analytics, and personalized advertising. Businesses are leveraging these capabilities to analyze consumer behavior and deliver targeted promotions. With the growing adoption of AI-driven signage in retail stores, transportation hubs, and smart cities, the demand for interactive and voice-controlled displays continues to surge. Advancements in AI are enhancing advertising precision, allowing businesses to engage with their audiences more effectively.
| Market Scope | |
|---|---|
| Start Year | 2024 |
| Forecast Year | 2025-2034 |
| Start Value | $22 Billion |
| Forecast Value | $49.4 Billion |
| CAGR | 8.5% |
In terms of components, the market is categorized into hardware, software, and services. The hardware segment, valued at USD 13.4 billion in 2024, remains the largest due to advancements in display technology. Businesses are shifting from LCD screens to energy-efficient LED, OLED, and MicroLED displays, which offer superior image quality, lower power consumption, and enhanced durability. The demand for 4K and 8K signage is rising, particularly in sectors that require high-resolution visuals for immersive advertising experiences.
The application landscape is diverse, encompassing retail, healthcare, hospitality, transportation, education, corporate environments, and banking. Retail, the dominant segment, reached USD 6.9 billion in 2024, driven by increased investment in interactive signage and AI-powered personalization. Retailers are integrating these digital displays to enhance consumer engagement, streamline advertising, and improve operational efficiency.
Based on end users, the market is segmented into small businesses, medium businesses, and large enterprises. Small businesses accounted for USD 9.4 billion in 2024, driven by the affordability of subscription-based digital signage software. The emergence of plug-and-play signage solutions allows smaller enterprises to adopt digital advertising with minimal technical expertise and investment.
Among display types, LED displays held the largest share at USD 10.4 billion in 2024. Their high brightness and weather resistance make them ideal for outdoor advertising and large-scale commercial displays. Declining LED panel costs and manufacturing advancements further boost their adoption.
Indoor digital signage, valued at USD 13.8 billion in 2024, remains dominant due to growing demand for in-store displays, self-service kiosks, and interactive brand engagement solutions. The popularity of touchscreen signage for navigation and virtual assistance continues to rise, enhancing consumer experiences.
Smaller digital displays, particularly those under 32 inches, reached USD 6 billion in 2024, as retailers increasingly use them for dynamic pricing, product recommendations, and in-store promotions. These cost-effective solutions cater to small businesses seeking affordable entry into digital advertising.
Interactive content is the fastest-growing segment, with a projected CAGR of 11.5%. Touchscreen functionality, motion sensors, and AI-driven personalization are revolutionizing digital signage, with self-ordering kiosks and virtual try-on solutions gaining popularity. Retailers and commercial spaces are rapidly adopting these technologies to enhance customer engagement.
North America led the market in 2024, holding a 35.7% share, with businesses heavily investing in AI-driven content management and targeted advertising. Government initiatives supporting smart city development and infrastructure enhancements further drive the adoption of digital signage solutions in the region.
Table of Contents
Chapter 1 Methodology & Scope
- 1.1 Market scope & definition
- 1.2 Base estimates & calculations
- 1.3 Forecast calculation
- 1.4 Data sources
- 1.4.1 Primary
- 1.4.2 Secondary
- 1.4.2.1 Paid sources
- 1.4.2.2 Public sources
Chapter 2 Executive Summary
- 2.1 Industry 360º synopsis, 2021 - 2034
Chapter 3 Industry Insights
- 3.1 Industry ecosystem analysis
- 3.2 Vendor matrix
- 3.3 Profit margin analysis
- 3.4 Technology & innovation landscape
- 3.5 Patent analysis
- 3.6 Key news and initiatives
- 3.7 Regulatory landscape
- 3.8 Impact forces
- 3.8.1 Growth drivers
- 3.8.1.1 Rising demand for supply chain transparency
- 3.8.1.2 Advancements in display technology
- 3.8.1.3 Increasing demand for interactive content
- 3.8.1.4 Growth of smart cities and infrastructure development
- 3.8.1.5 Cost reduction and improved ROI
- 3.8.1.6 Increasing adoption in the retail sector
- 3.8.2 Industry pitfalls & challenges
- 3.8.2.1 High initial investment and maintenance costs
- 3.8.2.2 Content management complexity
- 3.8.1 Growth drivers
- 3.9 Growth potential analysis
- 3.10 Porter's analysis
- 3.10.1 Supplier power
- 3.10.2 Buyer power
- 3.10.3 Threat of new entrants
- 3.10.4 Threat of substitutes
- 3.10.5 Industry rivalry
- 3.11 PESTEL analysis
Chapter 4 Competitive Landscape, 2023
- 4.1 Introduction
- 4.2 Company market share analysis
- 4.3 Competitive positioning matrix
- 4.4 Strategic outlook matrix
Chapter 5 Market Estimates & Forecast, By Display Type, 2021 - 2034 (USD million)
- 5.1 Key trends
- 5.2 LCD
- 5.3 LED
- 5.4 OLED
- 5.5 Others
Chapter 6 Market Estimates & Forecast, By Component, 2021 - 2034 (USD million)
- 6.1 Key trends
- 6.2 Hardware
- 6.3 Software
- 6.4 Services
Chapter 7 Market Estimates & Forecast, By Location, 2021 - 2034 (USD million)
- 7.1 Key trends
- 7.2 Indoor
- 7.3 Outdoor
Chapter 8 Market Estimates & Forecast, By Display Size, 2021 - 2034 (USD million)
- 8.1 Key trends
- 8.2 Below 32 inches
- 8.3 32 to 52 inches
- 8.4 Above 52 inches
Chapter 9 Market Estimates & Forecast, By Content Type, 2021 - 2034 (USD million)
- 9.1 Key trends
- 9.2 Static
- 9.3 Dynamic
- 9.4 Interactive
Chapter 10 Market Estimates & Forecast, By End Use, 2021 - 2034 (USD million)
- 10.1 Key trends
- 10.2 Small Businesses
- 10.3 Medium Businesses
- 10.4 Large Enterprises
Chapter 11 Market Estimates & Forecast, By Application, 2021 - 2034 (USD million)
- 11.1 Key trends
- 11.2 Retail
- 11.3 Healthcare
- 11.4 Hospitality
- 11.5 Transportation
- 11.6 Education
- 11.7 Corporate
- 11.8 Banking
- 11.9 Others
Chapter 12 Market Estimates & Forecast, By Region, 2021 - 2034 (USD million)
- 12.1 Key trends
- 12.2 North America
- 12.2.1 U.S.
- 12.2.2 Canada
- 12.3 Europe
- 12.3.1 UK
- 12.3.2 Germany
- 12.3.3 France
- 12.3.4 Italy
- 12.3.5 Spain
- 12.3.6 Rest of Europe
- 12.4 Asia Pacific
- 12.4.1 China
- 12.4.2 India
- 12.4.3 Japan
- 12.4.4 South Korea
- 12.4.5 ANZ
- 12.4.6 Rest of Asia Pacific
- 12.5 Latin America
- 12.5.1 Brazil
- 12.5.2 Mexico
- 12.5.3 Rest of Latin America
- 12.6 MEA
- 12.6.1 UAE
- 12.6.2 South Africa
- 12.6.3 Saudi Arabia
- 12.6.4 Rest of MEA
Chapter 13 Company Profiles
- 13.1 BrightSign LLC
- 13.2 Cisco Systems
- 13.3 Daktronics
- 13.4 Elo Touch Solutions
- 13.5 Four Winds Interactive
- 13.6 LG Electronics
- 13.7 Mvix Digital Signage
- 13.8 Navori Labs
- 13.9 NEC Corporation
- 13.10 Onelan Limited
- 13.11 Panasonic Corporation
- 13.12 Philips Professional Display Solutions
- 13.13 Planar Systems
- 13.14 Samsung Electronics
- 13.15 Scala, Inc.
- 13.16 Sharp Corporation
- 13.17 Sony Corporation
- 13.18 Toshiba Global Commerce Solutions
- 13.19 ViewSonic Corporation
- 13.20 Visix, Inc.
 数位相机显示器市场报告:趋势、预测和竞争分析(至2035年)
 2026年全球数位电子看板市场报告
 全球智慧指示牌市场规模、份额、趋势和成长分析报告(2026-2034)
 数位看板市场:依产品、组件(硬体、服务)、应用和行业划分 - 至2036年的全球预测
 LED数位记分板市场分析及预测(至2035年):依类型、产品类型、服务、技术、组件、应用、形状、材质、最终用户、安装类型划分医疗数位电子看板市场分析及预测(至2035年):按类型、产品、服务、技术、组件、应用、部署模式、最终用户、功能和安装类型划分数位电子看板市场分析及预测(至2035年):依类型、产品、服务、技术、组件、应用、形式、部署方式、最终用户及安装类型划分
 数位电子看板:市场占有率分析、产业趋势与统计、成长预测(2026-2031)
 数位电子看板市场规模、份额、趋势及预测(按类型、组件、技术、应用、位置、规模和地区划分),2026-2034年2026年全球数位侧窗显示器市场报告