


 |
市场调查报告书
商品编码
1699429
VR 头戴装置市场机会、成长动力、产业趋势分析及 2025-2034 年预测VR Headsets Market Opportunity, Growth Drivers, Industry Trend Analysis, and Forecast 2025-2034 |
||||||
2024 年全球 VR 头戴装置市场规模达到 91 亿美元,预计 2025 年至 2034 年期间将达到 19.7% 的强劲复合年增长率。人工智慧 (AI) 与 VR 技术的日益融合极大地改变了用户体验,使虚拟环境更加智慧、更具互动性。人工智慧透过创建即时适应用户行为的响应式虚拟设定来增强 VR 应用。随着人工智慧的融入,製造流程的进步和生产规模的扩大正在降低 VR 头戴装置的成本,使公司能够以更实惠的价格提供这些设备。随着生产成本的下降,VR 头戴装置越来越受到更广泛的消费者群体的青睐,促进了其广泛普及。价格承受能力的不断提高,加上游戏、教育和其他行业对沉浸式内容的需求不断增长,预计将在未来十年维持市场的成长轨迹。
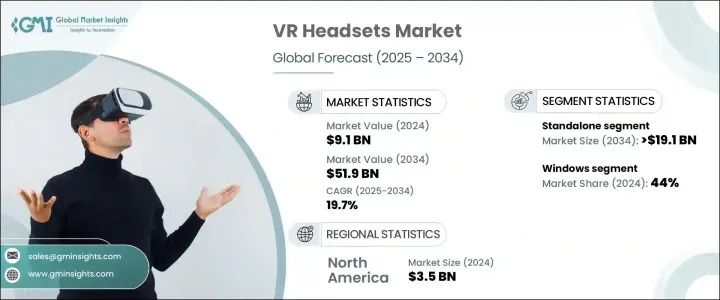
根据产品类型,VR 头戴式装置市场分为独立设备、有线设备和智慧型手机设备。其中,VR一体机正迅速成为消费者的首选。 2024 年,独立市场创造了约 34 亿美元的收入,预计到 2034 年将超过 191 亿美元。这些设备越来越受欢迎,因为它们提供了一体化解决方案,而无需 PC 或游戏机等额外硬体。独立耳机配有内建处理器、感应器和显示器,使其更易于设定和使用。它们的无线功能增加了用户的便利性并提高了行动性,从而吸引了许多寻求无忧 VR 体验的用户。
| 市场范围 | |
|---|---|
| 起始年份 | 2024 |
| 预测年份 | 2025-2034 |
| 起始值 | 91亿美元 |
| 预测值 | 519亿美元 |
| 复合年增长率 | 19.7% |
依作业系统分析,VR 头戴装置市场分为 Windows、iOS 和 Android。 2024 年,Windows 市场占据主导地位,创造了约 40 亿美元的收入,占了近 44% 的整体市场份额。这一领导地位得益于 Windows 与 VR 硬体的广泛相容性及其强大的软体开发生态系统。基于 Windows 的系统以提供在多个行业运行高级 VR 应用程式所需的高效能功能而闻名。由于用户寻求具有强大图形和处理支援的无缝虚拟实境体验,该作业系统在游戏界的强大地位也促进了其主导的市场份额。
从地区来看,北美在 VR 头戴装置市场占据重要地位,2024 年的价值约为 35 亿美元。预计该地区在 2025 年至 2034 年期间的复合年增长率将达到 19.7%。娱乐、医疗保健和教育等行业对 VR 的采用迅速增长,以及对新兴 VR 技术的投资不断增加,并继续推动整个地区的需求。
目录
第一章:方法论与范围
- 市场范围和定义
- 基础估算与计算
- 预测参数
- 资料来源
- 基本的
- 次要
- 付费来源
- 公共资源
第二章:执行摘要
第三章:行业洞察
- 产业生态系统分析
- 影响价值链的因素
- 利润率分析
- 中断
- 未来展望
- 製造商
- 经销商
- 零售商
- 衝击力
- 成长动力
- 沉浸式科技的进步
- 扩大5G网路扩展
- 增加可支配收入
- 产业陷阱与挑战
- 初期投资高
- 健康和安全问题
- 成长动力
- 消费者购买行为分析
- 人口趋势
- 影响购买决策的因素
- 消费者产品采用
- 首选配销通路
- 成长潜力分析
- 监管格局
- 定价分析
- 波特的分析
- PESTEL分析
第四章:竞争格局
- 介绍
- 公司市占率分析
- 竞争定位矩阵
- 战略展望矩阵
第五章:市场估计与预测:按类型,2021-2034
- 主要趋势
- 繫留
- 独立
- 支援智慧型手机
第六章:市场估计与预测:依组件,2021-2034
- 主要趋势
- 硬体
- 软体
第七章:市场估计与预测:依作业系统,2021 年至 2034 年
- 主要趋势
- 视窗
- iOS
- 安卓
第八章:市场估计与预测:依连结技术,2021 年至 2034 年
- 主要趋势
- 蓝牙
- HDMI
- 无线上网
- 其他(NFC等)
第九章:市场估计与预测:按应用,2021 年至 2034 年
- 主要趋势
- 游戏和娱乐
- 教育
- 卫生保健
- 零售与电子商务
- 军事与国防
- 工程与设计
- 其他的
第 10 章:市场估计与预测:按配销通路,2021 年至 2034 年
- 主要趋势
- 在线的
- 电子商务
- 公司网站
- 离线
- 超市和百货公司
- 专卖店
- 游戏商店
- 其他(B2B频道、订阅服务等)
第 11 章:市场估计与预测:按地区,2021 年至 2034 年
- 主要趋势
- 北美洲
- 我们
- 加拿大
- 欧洲
- 德国
- 英国
- 法国
- 义大利
- 西班牙
- 欧洲其他地区
- 亚太地区
- 中国
- 印度
- 日本
- 韩国
- 亚太其他地区
- 拉丁美洲
- 巴西
- 墨西哥
- 拉丁美洲其他地区
- MEA
- 阿联酋
- 沙乌地阿拉伯
- 南非
- MEA 其余地区
第十二章:公司简介
- Google LLC
- HP Inc.
- HTC Corporation
- Lenovo Group Limited
- Magic Leap, Inc.
- Meta Platforms, Inc.
- Microsoft Corporation
- Pico Interactive, Inc.
- Pimax Technology (Shanghai) Co., Ltd.
- Razer Inc.
- Samsung Electronics Co., Ltd.
- Shenzhen Baofeng Mojing Technology Co., Ltd.
- Sony Group Corporation
- Valve Corporation
- Xiaomi Corporation
The Global VR Headsets Market reached USD 9.1 billion in 2024 and is projected to witness a robust growth rate of 19.7% CAGR from 2025 to 2034. The increasing integration of artificial intelligence (AI) with VR technology has significantly transformed user experiences, making virtual environments smarter and more interactive. AI is enhancing VR applications by creating responsive virtual settings that adapt to user behavior in real time. Along with AI integration, advancements in manufacturing processes and scaling production are driving down the cost of VR headsets, allowing companies to offer these devices at more affordable prices. As production expenses decline, VR headsets are becoming more accessible to a broader consumer segment, encouraging widespread adoption. The growing affordability, combined with a rising demand for immersive content in gaming, education, and other industries, is expected to sustain the market's growth trajectory over the next decade.
Based on product type, the VR headsets market is segmented into standalone, tethered, and smartphone-enabled devices. Among these, standalone VR headsets are rapidly becoming the preferred choice for consumers. In 2024, the standalone segment generated around USD 3.4 billion and is anticipated to exceed USD 19.1 billion by 2034. These devices are gaining popularity as they offer an all-in-one solution without the need for additional hardware such as PCs or gaming consoles. Standalone headsets come with built-in processors, sensors, and displays, making them easier to set up and use. Their wireless functionality adds to user convenience and improves mobility, making them attractive to a wide range of users seeking hassle-free VR experiences.
| Market Scope | |
|---|---|
| Start Year | 2024 |
| Forecast Year | 2025-2034 |
| Start Value | $9.1 Billion |
| Forecast Value | $51.9 Billion |
| CAGR | 19.7% |
When analyzed by operating system, the VR headsets market is segmented into Windows, iOS, and Android. The Windows segment dominated the market in 2024, generating approximately USD 4 billion and holding nearly 44% of the overall market share. This leadership position is supported by Windows' extensive compatibility with VR hardware and its robust software development ecosystem. Windows-based systems are known for offering high-performance capabilities necessary for running advanced VR applications across multiple industries. The operating system's strong foothold in the gaming community has also contributed to its dominant market share, as users seek seamless VR experiences with powerful graphics and processing support.
Regionally, North America held a significant position in the VR headsets market, with a value of around USD 3.5 billion in 2024. The region is expected to register a CAGR of 19.7% between 2025 and 2034. The rapid growth of VR adoption across industries such as entertainment, healthcare, and education, along with increasing investments in emerging VR technologies, continues to fuel demand across the region.
Table of Contents
Chapter 1 Methodology & Scope
- 1.1 Market scope & definition
- 1.2 Base estimates & calculations
- 1.3 Forecast parameters
- 1.4 Data sources
- 1.4.1 Primary
- 1.4.2 Secondary
- 1.4.2.1 Paid sources
- 1.4.2.2 Public sources
Chapter 2 Executive Summary
- 2.1 Industry 3600 synopsis, 2021 - 2034
Chapter 3 Industry Insights
- 3.1 Industry ecosystem analysis
- 3.1.1 Factor affecting the value chain
- 3.1.2 Profit margin analysis
- 3.1.3 Disruptions
- 3.1.4 Future outlook
- 3.1.5 Manufacturers
- 3.1.6 Distributors
- 3.1.7 Retailers
- 3.2 Impact forces
- 3.2.1 Growth drivers
- 3.2.1.1 Advancements in immersive technology
- 3.2.1.2 Expanding 5G network expansion
- 3.2.1.3 Increasing disposable income
- 3.2.2 Industry pitfalls & challenges
- 3.2.2.1 High initial investment
- 3.2.2.2 Health and Safety Concerns
- 3.2.1 Growth drivers
- 3.3 Consumer buying behavior analysis
- 3.3.1 Demographic trends
- 3.3.2 Factors affecting buying decisions
- 3.3.3 Consumer product adoption
- 3.3.4 Preferred distribution channel
- 3.4 Growth potential analysis
- 3.5 Regulatory landscape
- 3.6 Pricing analysis
- 3.7 Porter's analysis
- 3.8 PESTEL analysis
Chapter 4 Competitive Landscape, 2024
- 4.1 Introduction
- 4.2 Company market share analysis
- 4.3 Competitive positioning matrix
- 4.4 Strategic outlook matrix
Chapter 5 Market Estimates & Forecast, By Type, 2021-2034 (USD Billion) (Million Units)
- 5.1 Key Trends
- 5.2 Tethered
- 5.3 Standalone
- 5.4 Smartphone enabled
Chapter 6 Market Estimates & Forecast, By Component, 2021-2034 (USD Billion) (Million Units)
- 6.1 Key trends
- 6.2 Hardware
- 6.3 Software
Chapter 7 Market Estimates & Forecast, By Operating System, 2021 – 2034, (USD Billion) (Million Units)
- 7.1 Key trends
- 7.2 Windows
- 7.3 iOS
- 7.4 Android
Chapter 8 Market Estimates & Forecast, By Connectivity Technology, 2021 – 2034, (USD Billion) (Million Units)
- 8.1 Key trends
- 8.2 Bluetooth
- 8.3 HDMI
- 8.4 Wi-Fi
- 8.5 Others (NFC, etc.)
Chapter 9 Market Estimates & Forecast, By Application, 2021 – 2034, (USD Billion) (Million Units)
- 9.1 Key trends
- 9.2 Gaming & entertainment
- 9.3 Education
- 9.4 Healthcare
- 9.5 Retail & ecommerce
- 9.6 Military & defense
- 9.7 Engineering & design
- 9.8 Others
Chapter 10 Market Estimates & Forecast, By Distribution Channel, 2021 – 2034, (USD Billion) (Million Units)
- 10.1 Key trends
- 10.2 Online
- 10.2.1 E-commerce
- 10.2.2 Company websites
- 10.3 Offline
- 10.3.1 Supermarkets & department stores
- 10.3.2 Specialty stores
- 10.3.3 Gaming stores
- 10.3.4. Others (B2B channels, subscription services, etc.)
Chapter 11 Market Estimates & Forecast, By Region, 2021 – 2034, (USD Billion) (Million Units)
- 11.1 Key trends
- 11.2 North America
- 11.2.1 U.S.
- 11.2.2 Canada
- 11.3 Europe
- 11.3.1 Germany
- 11.3.2 U.K.
- 11.3.3 France
- 11.3.4 Italy
- 11.3.5 Spain
- 11.3.6 Rest of Europe
- 11.4 Asia Pacific
- 11.4.1 China
- 11.4.2 India
- 11.4.3 Japan
- 11.4.4 South Korea
- 11.4.5 Rest of Asia Pacific
- 11.5 Latin America
- 11.5.1 Brazil
- 11.5.2 Mexico
- 11.5.3 Rest of Latin America
- 11.6 MEA
- 11.6.1 UAE
- 11.6.2 Saudi Arabia
- 11.6.3 South Africa
- 11.6.4 Rest of MEA
Chapter 12 Company Profiles (Business Overview, Financial Data, Product Landscape, Strategic Outlook, SWOT Analysis)
- 12.1 Google LLC
- 12.2 HP Inc.
- 12.3 HTC Corporation
- 12.4 Lenovo Group Limited
- 12.5 Magic Leap, Inc.
- 12.6 Meta Platforms, Inc.
- 12.7 Microsoft Corporation
- 12.8 Pico Interactive, Inc.
- 12.9 Pimax Technology (Shanghai) Co., Ltd.
- 12.10 Razer Inc.
- 12.11 Samsung Electronics Co., Ltd.
- 12.12 Shenzhen Baofeng Mojing Technology Co., Ltd.
- 12.13 Sony Group Corporation
- 12.14 Valve Corporation
- 12.15 Xiaomi Corporation
 2026年全球AR/VR晶片市场报告2026年全球人工智慧市场报告(虚拟实境与扩增实境)
 AR和VR市场分析及预测(至2035年):按类型、产品类型、服务、技术、组件、应用、设备、部署模式、最终用户和功能划分扩增实境(AR) 和虚拟实境 (VR) 市场分析及预测(至 2035 年):按类型、产品类型、服务、技术、组件、应用、设备、部署类型、最终用户和功能划分2026年扩增实境(AR)和虚拟实境(VR)硬体全球市场报告
 扩增实境(AR) 和虚拟实境 (VR) 市场 - 全球产业规模、份额、趋势、机会和预测(按产品类型、组织规模、产品/服务、应用、最终用户、地区和竞争格局划分),2021-2031 年
 扩增实境硬体
 2032年基于模拟的培训市场预测:按组件、模拟类型、部署模式、最终用户和地区分類的全球分析
 VR头戴装置市场规模、份额和成长分析(按终端设备、产品类型、应用和地区划分)-产业预测(2026-2033年)
 扩增实境(AR)和虚拟实境(VR):2025-2031年全球市场份额和排名、总收入和需求预测