


 |
市场调查报告书
商品编码
1844289
电动最后一哩配送车辆市场机会、成长动力、产业趋势分析及 2025 - 2034 年预测Electric Last Mile Delivery Vehicle Market Opportunity, Growth Drivers, Industry Trend Analysis, and Forecast 2025 - 2034 |
||||||
2024 年全球电动最后一哩外送车辆市场价值为 213 亿美元,预计到 2034 年将以 18.3% 的复合年增长率增长至 1035 亿美元。
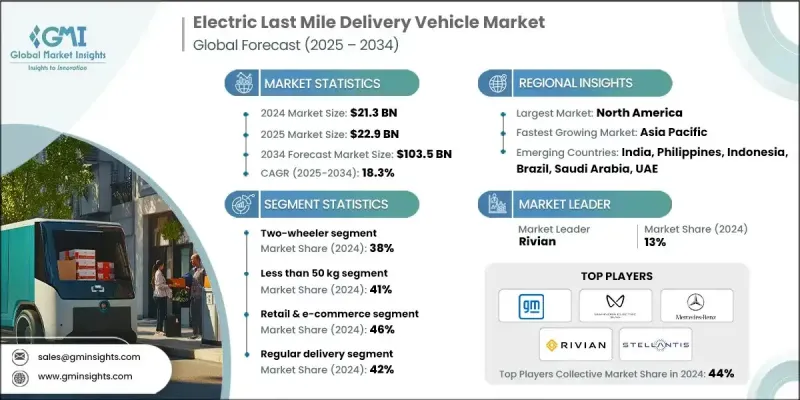
推动这一成长的因素包括:对环保城市配送方案的需求不断增长、排放法规日益严格以及电子商务活动日益活跃。小型货车、小型货运三轮车和轻型自行车等电动配送车辆正成为车队营运商不可或缺的一部分,他们致力于提高配送效率,同时降低排放和维护成本。减少城市排放的监管压力也迫使车队营运商转向电动货车、混合动力卡车和紧凑型配送车辆。基于人工智慧的预测性维护、基于物联网的车辆追踪以及先进的远端资讯处理等技术正成为优化车队性能和减少车辆停机时间的关键。快速充电和电池更换系统等充电基础设施创新也在支援交通繁忙的城市环境中延长配送班次方面发挥关键作用。电动微型交通工具在零售、医疗保健物流和食品杂货配送的应用日益增多,尤其是在人口密集的城市环境中,这极大地促进了市场格局的发展。
| 市场范围 | |
|---|---|
| 起始年份 | 2024 |
| 预测年份 | 2025-2034 |
| 起始值 | 213亿美元 |
| 预测值 | 1035亿美元 |
| 复合年增长率 | 18.3% |
2024年,电动两轮车市场占了38%的市场份额,预计到2034年将以18%的复合年增长率成长。这类车辆因其价格实惠、操控灵活以及在拥挤的城市环境中易于操作而特别吸引人。新创公司和小型配送企业青睐电动两轮车,因为它们运作成本低,并且在短途路线上配送速度更快。电动两轮车体积小巧,能够在交通密集的地区顺畅行驶,帮助企业最大限度地提高配送速度和效率。
2024年,设计载重低于50公斤的车辆份额为41%。城市拥塞以及对灵活、低成本物流解决方案的需求推动了轻型车辆(例如紧凑型踏板车和三轮车)的普及。这些车辆对基础设施的要求极低,由于电池容量较小,前期投入和运行成本也较低,是小型零售商和大型电商企业在排放管制区域优化最后一哩配送业务的首选。
美国电动最后一哩配送车辆市场占86%的市场份额,2024年市场规模达68亿美元。联邦政府的电动车激励措施、城市配送基础设施的改善以及强劲的电商活动等因素正在推动市场向前发展。电气化、车队数位化以及基于人工智慧的路线规划和即时追踪等智慧技术的投资正在进一步推动该行业的发展。车队营运商越来越多地利用这些工具来降低营运成本并提高最后一哩网路的能源效率。
全球电动最后一哩送货车市场的一些领先公司包括马恆达电气、Xos、塔塔汽车、福特汽车公司、梅赛德斯-奔驰、Rivian、比亚迪、GreenPower 汽车公司、Stellantis 和通用汽车。为了扩大影响力,电动最后一哩送货车领域的主要公司正专注于多项策略性倡议。这些措施包括与电子商务平台、物流公司和政府机构建立策略联盟和合作伙伴关係,以支持大规模电气化。许多公司都在加大研发投入,以推出具有改进的电池性能、更大的续航里程和更智慧的远端资讯处理系统的新型电动车。此外,他们正在扩大生产能力以满足不断增长的需求,同时也与充电基础设施供应商合作部署快速充电和电池更换解决方案。原始设备製造商也强调整合人工智慧和物联网的数位车队管理工具,以实现预测性维护和营运效率,帮助他们向车队客户提供增值服务并提高品牌忠诚度。
目录
第一章:方法论
- 市场范围和定义
- 研究设计
- 研究方法
- 资料收集方法
- 资料探勘来源
- 全球的
- 地区/国家
- 基础估算与计算
- 基准年计算
- 市场评估的主要趋势
- 初步研究和验证
- 主要来源
- 预测模型
- 研究假设和局限性
第 2 章:执行摘要
第三章:行业洞察
- 产业生态系统分析
- 供应商格局
- 利润率分析
- 成本结构
- 每个阶段的增值
- 影响价值链的因素
- 中断
- 产业衝击力
- 成长动力
- 电子商务需求和网上购物增加。
- 政府激励措施和排放法规激增。
- 都市化进程加快,低排放区扩大。
- 燃料和维修成本降低,从而节省成本。
- 电池技术和快速充电解决方案的进步。
- 产业陷阱与挑战
- 车辆和基础设施的初始投资较高。
- 充电基础设施有限,车辆行驶里程受限。
- 市场机会
- 物流公司扩大车队电气化计画。
- 将再生能源融入充电基础设施。
- 新兴城市市场的需求上升。
- 货运自行车和微型移动解决方案的采用量激增。
- 人工智慧、物联网和远端资讯处理整合在车队优化方面的成长。
- 成长动力
- 成长潜力分析
- 监管格局
- 北美洲
- 欧洲
- 亚太地区
- 拉丁美洲
- 中东和非洲
- 波特的分析
- PESTEL分析
- 技术和创新格局
- 当前的技术趋势
- 新兴技术
- 价格趋势
- 按地区
- 按产品
- 生产统计
- 生产中心
- 消费中心
- 汇出和汇入
- 成本分解分析
- 专利分析
- 永续性和环境方面
- 永续实践
- 减少废弃物的策略
- 生产中的能源效率
- 环保倡议
- 碳足迹考虑
- 市场采用统计数据
- 电动送货车部署率
- 车队电气化进展
- 充电基础设施建设
- 技术特性采用
- 区域采用模式
- 客户满意度指标
- 营运绩效衡量
- 电子商务与配送市场整合
- 线上零售成长的影响
- 最后一哩配送需求分析
- 配送速度及效率要求
- 顾客期望的演变
- 旺季需求管理
- 城市配送密度优化
- 永续性消费者偏好
- 投资格局分析
- 汽车製造商投资
- 车队营运商资本配置
- 政府基础建设资金
- 私人充电网路投资
- 配送技术领域的创投
- 以投资类型进行的投资报酬率分析
- 绿色债券和永续融资
- 客户行为分析
- 车队营运商决策因素
- 车辆选择标准
- 科技采用偏好
- 总拥有成本优先级
- 服务和支援要求
- 可持续发展承诺的影响
- 区域偏好差异
- 商业模式演变
- 传统汽车销售模式
- 车辆即服务(VaaS)模式
- 租赁和融资解决方案
- 综合车队解决方案
- 充电即服务模式
- 基于绩效的合约
- 性能和品质标准
- 商用车性能指标
- 电池性能和耐用性
- 充电速度和效率
- 可靠性和可用性标准
- 安全与安保要求
- 环境绩效标准
- 风险评估框架
- 技术采用风险
- 电池效能和退化风险
- 充电基础设施可用性风险
- 监理合规风险
- 市场需求波动
- 供应链中断风险
- 竞争技术风险
第四章:竞争格局
- 介绍
- 公司市占率分析
- 北美洲
- 欧洲
- 亚太地区
- 拉丁美洲
- 多边环境协定
- 主要市场参与者的竞争分析
- 竞争定位矩阵
- 战略展望矩阵
- 关键进展
- 併购
- 伙伴关係与合作
- 新产品发布
- 扩张计划和资金
第五章:市场估计与预测:依车型,2021-2034
- 主要趋势
- 两轮车
- 电动自行车/自行车
- 电动滑板车
- 电动摩托车
- 三轮车
- 电动人力车
- 电动三轮车
- 轻型商用三轮车
- 四轮车
- 微型商用车
- 轻型商用车(LCV)
- 中型商用车
- 专业四轮车
- 微型移动出行
- 个人出行
- 货运微型移动
- 两轮车
第六章:市场估计与预测:按应用,2021-2034
- 主要趋势
- 零售与电子商务
- 食品和杂货配送
- 医疗保健和製药
- 邮件和包裹
- 其他的
第七章:市场估计与预测:依酬载容量,2021-2034
- 主要趋势
- 少于50公斤
- 50至500公斤
- 500公斤以上
第 8 章:市场估计与预测:按交付方式,2021-2034 年
- 主要趋势
- 定期送货
- 当日送达
- 快递
第九章:市场估计与预测:依电池容量,2021-2034
- 主要趋势
- 低于30度
- 30-70度
- 70度以上
第 10 章:市场估计与预测:按地区,2021-2034 年
- 主要趋势
- 北美洲
- 我们
- 加拿大
- 欧洲
- 德国
- 英国
- 法国
- 义大利
- 西班牙
- 俄罗斯
- 北欧人
- 亚太地区
- 中国
- 印度
- 日本
- 澳洲
- 韩国
- 菲律宾
- 印尼
- 拉丁美洲
- 巴西
- 墨西哥
- 阿根廷
- 多边环境协定
- 南非
- 沙乌地阿拉伯
- 阿联酋
第 11 章:公司简介
- 全球参与者
- Arrival
- Ford Motor Company
- General Motors
- GreenPower Motor Company
- Mercedes-Benz
- Nissan Motor Company
- Rivian
- Stellantis
- Workhorse
- BYD
- 区域参与者
- Bollinger Motors
- Canoo
- Chanje Energy
- Isuzu Motors
- Lightning eMotors
- Mahindra Electric
- Renault
- Tata Motors
- Volkswagen Commercial Vehicles
- 新兴玩家
- Alke
- Cenntro Electric
- Einride
- Goupil
- SEA Electric
- StreetScooter
- Tevva Motors
- Volta Trucks
- Xos
The Global Electric Last Mile Delivery Vehicle Market was valued at USD 21.3 billion in 2024 and is estimated to grow at a CAGR of 18.3% to reach USD 103.5 billion by 2034.
Several dynamics are fueling this surge, including the rising demand for eco-friendly urban delivery options, stricter emissions regulations, and the accelerating pace of e-commerce activity. Electric delivery vehicles such as small vans, compact cargo trikes, and lightweight bikes are becoming integral to fleet operators aiming to enhance delivery efficiency while reducing emissions and maintenance costs. Regulatory pressure to reduce urban emissions is also compelling fleet operators to switch to electric vans, hybrid trucks, and compact delivery vehicles. Technologies like predictive maintenance powered by AI, IoT-based vehicle tracking, and advanced telematics are becoming central to optimizing fleet performance and reducing vehicle downtime. Charging infrastructure innovations like fast depot charging and battery swapping systems are also playing a critical role in supporting extended delivery shifts in traffic-heavy urban environments. The rising use of electric micro-mobility for retail, healthcare logistics, and grocery delivery, especially in dense urban settings, is significantly boosting the market landscape.
| Market Scope | |
|---|---|
| Start Year | 2024 |
| Forecast Year | 2025-2034 |
| Start Value | $21.3 Billion |
| Forecast Value | $103.5 Billion |
| CAGR | 18.3% |
In 2024, the electric two-wheelers segment held a 38% share and is expected to grow at a CAGR of 18% through 2034. These vehicles are particularly attractive due to their affordability, maneuverability, and operational ease within congested city environments. Startups and small delivery businesses favor electric two-wheelers for their low operating costs and faster delivery capabilities across shorter routes. Their compact size enables smooth navigation through traffic-dense areas, helping businesses maximize delivery speed and efficiency.
The segment of vehicles designed to carry less than 50 kilograms held a 41% share in 2024. Urban congestion and the need for flexible, low-cost logistics solutions have driven the adoption of lightweight vehicles such as compact scooters and three-wheelers. These vehicles require minimal infrastructure, offer lower upfront and running costs due to smaller battery capacities, and are a preferred choice for both small retailers and major e-commerce firms seeking to optimize last-mile delivery operations in emission-regulated zones.
United States Electric Last-Mile Delivery Vehicle Market held an 86% share and generated USD 6.8 billion in 2024. Factors such as federal EV incentives, improved urban delivery infrastructure, and robust e-commerce activity are propelling the market forward. Investments in electrification, fleet digitization, and smart technologies such as route planning through AI and real-time tracking are further advancing the sector. Fleet operators are increasingly leveraging these tools to reduce operational costs and improve energy efficiency across last-mile networks.
Some of the leading companies in the Global Electric Last-Mile Delivery Vehicle Market include Mahindra Electric, Xos, Tata Motors, Ford Motor Company, Mercedes-Benz, Rivian, BYD, GreenPower Motor Company, Stellantis, and General Motors. To expand their presence, major companies in the electric last-mile delivery vehicle sector are focusing on several strategic initiatives. These include forming strategic alliances and partnerships with e-commerce platforms, logistics firms, and government bodies to support large-scale electrification. Many are ramping up investments in R&D to introduce new electric vehicle models with improved battery performance, extended range, and smarter telematics systems. Additionally, they are scaling up production capabilities to meet growing demand, while also collaborating with charging infrastructure providers to deploy fast-charging and battery-swapping solutions. OEMs also emphasizing digital fleet management tools that integrate AI and IoT for predictive maintenance and operational efficiency, helping them deliver value-added services to fleet customers and increase brand loyalty.
Table of Contents
Chapter 1 Methodology
- 1.1 Market scope and definition
- 1.2 Research design
- 1.2.1 Research approach
- 1.2.2 Data collection methods
- 1.3 Data mining sources
- 1.3.1 Global
- 1.3.2 Regional/Country
- 1.4 Base estimates and calculations
- 1.4.1 Base year calculation
- 1.4.2 Key trends for market estimation
- 1.5 Primary research and validation
- 1.5.1 Primary sources
- 1.6 Forecast model
- 1.7 Research assumptions and limitations
Chapter 2 Executive Summary
- 2.1 Industry 3600 synopsis, 2021 - 2034
- 2.2 Key market trends
- 2.2.1 Regional
- 2.2.2 Vehicle
- 2.2.3 Payload Capacity
- 2.2.4 Application
- 2.2.5 Delivery Mode
- 2.2.6 Battery Capacity
- 2.3 TAM Analysis, 2025-2034
- 2.4 CXO perspectives: Strategic imperatives
- 2.4.1 Executive decision points
- 2.4.2 Critical success factors
- 2.5 Future outlook and strategic recommendations
Chapter 3 Industry Insights
- 3.1 Industry ecosystem analysis
- 3.1.1 Supplier landscape
- 3.1.2 Profit margin analysis
- 3.1.3 Cost structure
- 3.1.4 Value addition at each stage
- 3.1.5 Factor affecting the value chain
- 3.1.6 Disruptions
- 3.2 Industry impact forces
- 3.2.1 Growth drivers
- 3.2.1.1 Increase in e-commerce demand and online shopping.
- 3.2.1.2 Surge in government incentives and emission regulations.
- 3.2.1.3 Growth in urbanization and expansion of low-emission zones.
- 3.2.1.4 Rise in cost savings from lower fuel and maintenance.
- 3.2.1.5 Advancements in battery technology and fast-charging solutions.
- 3.2.2 Industry pitfalls & challenges
- 3.2.2.1 High initial investment in vehicles and infrastructure.
- 3.2.2.2 Limited charging infrastructure and restricted vehicle range.
- 3.2.3 Market opportunities
- 3.2.3.1 Expansion of fleet electrification programs by logistics companies.
- 3.2.3.2 Integration of renewable energy into charging infrastructure.
- 3.2.3.3 Rise in demand from emerging urban markets.
- 3.2.3.4 Surge in adoption of cargo bikes and micro-mobility solutions.
- 3.2.3.5 Growth in AI, IoT, and telematics integration for fleet optimization.
- 3.2.1 Growth drivers
- 3.3 Growth potential analysis
- 3.4 Regulatory landscape
- 3.4.1 North America
- 3.4.2 Europe
- 3.4.3 Asia Pacific
- 3.4.4 Latin America
- 3.4.5 Middle East & Africa
- 3.5 Porter’s analysis
- 3.6 PESTEL analysis
- 3.7 Technology and Innovation landscape
- 3.7.1 Current technological trends
- 3.7.2 Emerging technologies
- 3.8 Price trends
- 3.8.1 By region
- 3.8.2 By product
- 3.9 Production statistics
- 3.9.1 Production hubs
- 3.9.2 Consumption hubs
- 3.9.3 Export and import
- 3.10 Cost breakdown analysis
- 3.11 Patent analysis
- 3.12 Sustainability and environmental aspects
- 3.12.1 Sustainable practices
- 3.12.2 Waste reduction strategies
- 3.12.3 Energy efficiency in production
- 3.12.4 Eco-friendly initiatives
- 3.12.5 Carbon footprint considerations
- 3.13 Market adoption statistics
- 3.13.1 Electric delivery vehicle deployment rates
- 3.13.2 Fleet electrification progress
- 3.13.3 Charging infrastructure development
- 3.13.4 Technology feature adoption
- 3.13.5 Regional adoption patterns
- 3.13.6 Customer satisfaction metrics
- 3.13.7 Operational performance measurements
- 3.14 E-commerce & delivery market integration
- 3.14.1 Online retail growth impact
- 3.14.2 Last mile delivery demand analysis
- 3.14.3 Delivery speed & efficiency requirements
- 3.14.4 Customer expectation evolution
- 3.14.5 Peak season demand management
- 3.14.6 Urban delivery density optimization
- 3.14.7 Sustainability consumer preferences
- 3.15 Investment landscape analysis
- 3.15.1 Vehicle manufacturer investment
- 3.15.2 Fleet operator capital allocation
- 3.15.3 Government infrastructure funding
- 3.15.4 Private charging network investment
- 3.15.5 Venture capital in delivery technology
- 3.15.6 ROI analysis by investment type
- 3.15.7 Green bond & sustainable financing
- 3.16 Customer behavior analysis
- 3.16.1 Fleet operator decision factors
- 3.16.2 Vehicle selection criteria
- 3.16.3 Technology adoption preferences
- 3.16.4 Total cost of ownership priorities
- 3.16.5 Service & support requirements
- 3.16.6 Sustainability commitment influence
- 3.16.7 Regional preference variations
- 3.17 Business model evolution
- 3.17.1 Traditional vehicle sales models
- 3.17.2 Vehicle-as-a-service (VaaS) models
- 3.17.3 Leasing & financing solutions
- 3.17.4 Integrated fleet solutions
- 3.17.5 Charging-as-a-service models
- 3.17.6 Performance-based contracting
- 3.18 Performance & quality standards
- 3.18.1 Commercial vehicle performance metrics
- 3.18.2 Battery performance & durability
- 3.18.3 Charging speed & efficiency
- 3.18.4 Reliability & availability standards
- 3.18.5 Safety & security requirements
- 3.18.6 Environmental performance standards
- 3.19 Risk assessment framework
- 3.19.1 Technology adoption risks
- 3.19.2 Battery performance & degradation risks
- 3.19.3 Charging infrastructure availability risks
- 3.19.4 Regulatory compliance risks
- 3.19.5 Market demand volatility
- 3.19.6 Supply chain disruption risks
- 3.19.7 Competitive technology risks
Chapter 4 Competitive Landscape, 2024
- 4.1 Introduction
- 4.2 Company market share analysis
- 4.2.1 North America
- 4.2.2 Europe
- 4.2.3 Asia Pacific
- 4.2.4 LATAM
- 4.2.5 MEA
- 4.3 Competitive analysis of major market players
- 4.4 Competitive positioning matrix
- 4.5 Strategic outlook matrix
- 4.6 Key developments
- 4.6.1 Mergers & acquisitions
- 4.6.2 Partnerships & collaborations
- 4.6.3 New Product Launches
- 4.6.4 Expansion Plans and funding
Chapter 5 Market Estimates & Forecast, By Vehicle, 2021-2034 ($Bn, Units)
- 5.1 Key trends
- 5.1.1 Two-Wheeler
- 5.1.1.1 E-Bikes/Bicycles
- 5.1.1.2 E-Scooters
- 5.1.1.3 E-Motorcycles
- 5.1.2 Three-Wheeler
- 5.1.2.1 E-Auto Rickshaws
- 5.1.2.2 E-Tricycles
- 5.1.2.3 Light Commercial Three-Wheelers
- 5.1.3 Four-Wheeler
- 5.1.3.1 Micro Commercial Vehicles
- 5.1.3.2 Light Commercial Vehicles (LCV)
- 5.1.3.3 Medium Commercial Vehicles
- 5.1.3.4 Specialized Four-Wheelers
- 5.1.4 Micro Mobility
- 5.1.4.1 Personal Mobility
- 5.1.4.2 Cargo Micro Mobility
- 5.1.1 Two-Wheeler
Chapter 6 Market Estimates & Forecast, By Application, 2021-2034 ($Bn, Units)
- 6.1 Key trends
- 6.2 Retail & E-commerce
- 6.3 Food & Grocery Delivery
- 6.4 Healthcare & Pharmaceuticals
- 6.5 Mails and Packages
- 6.6 Others
Chapter 7 Market Estimates & Forecast, By Payload Capacity, 2021-2034 ($Bn, Units)
- 7.1 Key trends
- 7.2 Less than 50 kg
- 7.3 50 to 500 kg
- 7.4 Above 500 kg
Chapter 8 Market Estimates & Forecast, By Delivery Mode, 2021-2034 ($Bn, Units)
- 8.1 Key trends
- 8.2 Regular Delivery
- 8.3 Same-Day Delivery
- 8.4 Express Delivery
Chapter 9 Market Estimates & Forecast, By Battery Capacity, 2021-2034 ($Bn, Units)
- 9.1 Key trends
- 9.2 Below 30 kWh
- 9.3 30-70 kWh
- 9.4 Above 70 kWh
Chapter 10 Market Estimates & Forecast, By Region, 2021-2034 ($Bn, Units)
- 10.1 Key trends
- 10.2 North America
- 10.2.1 US
- 10.2.2 Canada
- 10.3 Europe
- 10.3.1 Germany
- 10.3.2 UK
- 10.3.3 France
- 10.3.4 Italy
- 10.3.5 Spain
- 10.3.6 Russia
- 10.3.7 Nordics
- 10.4 Asia Pacific
- 10.4.1 China
- 10.4.2 India
- 10.4.3 Japan
- 10.4.4 Australia
- 10.4.5 South Korea
- 10.4.6 Philippines
- 10.4.7 Indonesia
- 10.5 Latin America
- 10.5.1 Brazil
- 10.5.2 Mexico
- 10.5.3 Argentina
- 10.6 MEA
- 10.6.1 South Africa
- 10.6.2 Saudi Arabia
- 10.6.3 UAE
Chapter 11 Company Profiles
- 11.1 Global Players
- 11.1.1 Arrival
- 11.1.2 Ford Motor Company
- 11.1.3 General Motors
- 11.1.4 GreenPower Motor Company
- 11.1.5 Mercedes-Benz
- 11.1.6 Nissan Motor Company
- 11.1.7 Rivian
- 11.1.8 Stellantis
- 11.1.9 Workhorse
- 11.1.10 BYD
- 11.2 Regional Players
- 11.2.1 Bollinger Motors
- 11.2.2 Canoo
- 11.2.3 Chanje Energy
- 11.2.4 Isuzu Motors
- 11.2.5 Lightning eMotors
- 11.2.6 Mahindra Electric
- 11.2.7 Renault
- 11.2.8 Tata Motors
- 11.2.9 Volkswagen Commercial Vehicles
- 11.3 Emerging Players
- 11.3.1 Alke
- 11.3.2 Cenntro Electric
- 11.3.3 Einride
- 11.3.4 Goupil
- 11.3.5 SEA Electric
- 11.3.6 StreetScooter
- 11.3.7 Tevva Motors
- 11.3.8 Volta Trucks
- 11.3.9 Xos
 2026-2030年全球最后一公里配送市场
 法国最后一公里配送:市场占有率分析、产业趋势与统计、成长预测(2026-2031)
 日本最后一公里配送市场规模、份额、趋势及预测(按服务类型、技术、应用和地区划分,2026-2034年)
 2032年全球自动驾驶城市最后一公里配送市场预测:按车辆类型、经营模式、企业规模、技术、最终用户和地区分類的分析全球都市区最后100公尺配送市场:未来预测(至2032年)-依车辆类型、配送范围、配送方式、企业规模、技术、最终用户及地区进行分析
 末端配送市场:依服务类型、车辆类型、配送方式及应用程式划分-全球预测至2035年
 最后一公里配送市场规模、份额和成长分析(按配送方式、目的地、服务类型、车辆类型、营运类型、应用和地区划分)-2026-2033年产业预测2032年末端物流市场预测:按配送类型、车辆类型、履约模式、技术、最终用户和地区分類的全球分析2032年末端配送机器人市场预测:全球分析(按产品、车辆类型、续航里程、负载容量、自主程度、应用、最终用户和地区划分)
 最后一公里配送车辆市场机会、成长驱动因素、产业趋势分析及预测(2025-2034年)