


 |
市场调查报告书
商品编码
1858817
最后一公里配送车辆市场机会、成长驱动因素、产业趋势分析及预测(2025-2034年)Last Mile Delivery Vehicle Market Opportunity, Growth Drivers, Industry Trend Analysis, and Forecast 2025 - 2034 |
||||||
2024 年全球最后一公里配送车辆市场价值为 1,641 亿美元,预计到 2034 年将以 7.6% 的复合年增长率增长至 3,334 亿美元。
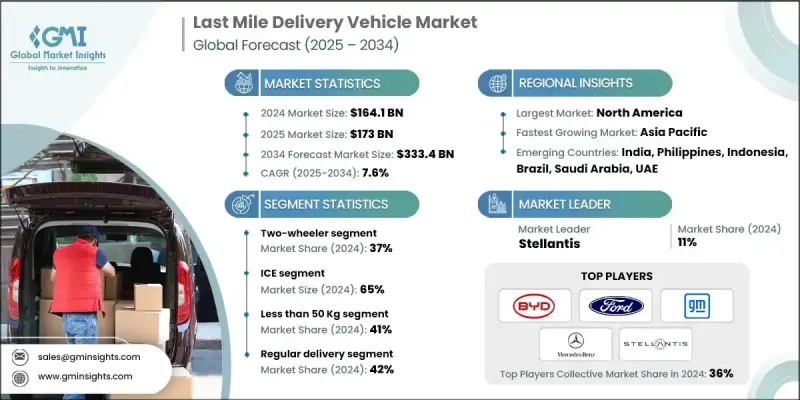
电子商务的蓬勃发展、城市化进程的加速以及对快速配送需求的日益增长,正在改变市场格局。小型卡车、轻型商用货车、三轮车和货运两轮车等车辆正帮助服务提供者提升配送速度、应对拥堵路况并降低燃油和维护成本。即时车辆追踪、先进的远端资讯处理技术和预测性维护是营运商优化营运绩效的关键工具。策略性布局的加油站和配送中心也提高了车辆利用率,最大限度地减少了车辆閒置时间。随着消费者行为倾向于更快、更灵活的选择,市场参与者正在迅速调整,以满足城市中心和郊区不断增长的物流需求。
| 市场范围 | |
|---|---|
| 起始年份 | 2024 |
| 预测年份 | 2025-2034 |
| 起始值 | 1641亿美元 |
| 预测值 | 3334亿美元 |
| 复合年增长率 | 7.6% |
儘管疫情期间製造业受到衝击,但线上零售的激增却大幅提升了对配送车队的投资。订阅式租赁、远端诊断和车队共享解决方案正蓬勃发展,以确保灵活性和营运可靠性。医疗保健、食品杂货和电商配送需求的成长推动了小型配送车辆的广泛应用。营运商和原始设备製造商(OEM)正在将物联网平台、微出行创新和智慧车队系统融入车辆中,以简化物流并支援城市交通策略。
2024年,两轮车市占率达到37%,预计到2034年将以6.8%的复合年增长率成长。这些车辆因其价格实惠、在交通拥堵中快速穿梭以及运营成本低廉而被广泛使用。食品配送、包裹物流和杂货配送等行业的企业仍然倾向于使用自行车和踏板车进行短途出行。在亚太等地区,由于成本优势和更便利的操控性,两轮车仍然占据主导地位。随着电动两轮车的普及,营运商也开始优先考虑车队的永续性和低排放。
2024年,内燃机(ICE)汽车市占率达到65%,预计到2034年将以7.1%的复合年增长率成长。由于续航里程更长、加油更快、有效载荷能力强,内燃机汽车仍深受车队营运商的青睐。内燃机车型供应充足,并有全球基础设施支持,使其成为日常大批量配送的理想选择,尤其适用于充电网路覆盖有限的地区。
预计到2024年,常规配送服务市占率将达到42%。此领域涵盖包裹、食品杂货和家居用品等日常物流服务。其稳定成长得益于持续的需求、可预测的配送路线以及消费者对定期配送的普遍依赖。企业之所以青睐定期配送,是因为其成本效益高且路线规划更便捷,这也使得该领域在车辆利用率方面始终处于领先地位。
2024年,美国末端配送车辆市场规模将达535亿美元,占85%的市场。其领先地位得益于完善的电子商务生态系统和对绿色交通日益增长的投资。主要物流供应商正积极部署电动货车、货运自行车和电动三轮车,作为其永续配送策略的一部分。政府政策,包括针对电动车的税收减免和补贴计划,正在加速车队电气化进程,并鼓励营运商从燃油车过渡到电动车型。
全球末端配送车辆产业的主要参与者包括塔塔汽车、宾士、GreenPower Motor、Stellantis、Rivian、通用汽车、Mahindra Electric、福特、Xos 和比亚迪。为了在末端配送车辆市场站稳脚跟,各公司正致力于融合电气化、数位化和灵活的商业模式。他们正对电池技术、即时车辆智慧和互联平台进行策略性投资,以优化车队营运。领先的製造商正在推出专为短程配送设计的电动车,同时与物流公司合作进行试点部署。远端资讯处理系统正被整合到车辆中,用于预测性维护和路线最佳化。此外,订阅模式和车辆租赁方案也正在推出,以吸引寻求可扩展、低成本进入配送服务的中小企业和零工经济从业者。
目录
第一章:方法论
- 市场范围和定义
- 研究设计
- 研究方法
- 资料收集方法
- 资料探勘来源
- 全球的
- 地区/国家
- 基准估算和计算
- 基准年计算
- 市场估算的关键趋势
- 初步研究和验证
- 原始资料
- 预测模型
- 研究假设和局限性
第二章:执行概要
第三章:行业洞察
- 产业生态系分析
- 供应商格局
- 利润率分析
- 成本结构
- 每个阶段的价值增加
- 影响价值链的因素
- 中断
- 产业影响因素
- 成长驱动因素
- 电子商务和当日送达的成长
- 政府激励措施和城市低排放政策
- 城市人口成长与交通拥堵
- 电池技术和快速充电解决方案的进步。
- 产业陷阱与挑战
- 车辆和基础设施的前期投资额很高。
- 充电基础设施有限,车辆续航里程也有限。
- 市场机会
- 电气化和混合动力汽车的普及率上升。
- 互联车队管理解决方案需求激增。
- 来自亚太和拉丁美洲等新兴市场的需求成长。
- 物流供应商与汽车製造商之间以永续发展为重点的合作关係日益增多。
- 成长驱动因素
- 成长潜力分析
- 监管环境
- 北美洲
- 欧洲
- 亚太地区
- 拉丁美洲
- 中东和非洲
- 波特的分析
- PESTEL 分析
- 技术与创新格局
- 当前技术趋势
- 新兴技术
- 价格趋势
- 按地区
- 副产品
- 生产统计
- 生产中心
- 消费中心
- 进出口
- 成本細項分析
- 专利分析
- 永续性和环境方面
- 永续实践
- 减少废弃物策略
- 生产中的能源效率
- 环保倡议
- 碳足迹考量
- 市场采纳统计数据
- 电动送货车部署率
- 车队电气化进展
- 充电基础设施建设
- 技术特性采纳
- 区域采用模式
- 客户满意度指标
- 营运绩效衡量
- 电子商务与配送市场整合
- 线上零售成长的影响
- 最后一公里配送车辆需求分析
- 配送速度和效率要求
- 顾客期望的演变
- 旺季需求管理
- 城市配送密度优化
- 永续性消费者偏好
- 投资环境分析
- 汽车製造商投资
- 车队营运商资本配置
- 政府基础建设资金
- 私人充电网路投资
- 创投于配送技术
- 依投资类型进行投资报酬率分析
- 绿色债券和永续融资
- 客户行为分析
- 车队营运商决策因素
- 车辆选择标准
- 技术采纳偏好
- 总拥有成本优先级
- 服务和支援要求
- 可持续发展承诺的影响
- 区域偏好差异
- 商业模式演变
- 传统汽车销售模式
- 车辆即服务 (VaaS) 模型
- 租赁和融资解决方案
- 整合车队解决方案
- 收费即服务模式
- 绩效合约
- 性能和品质标准
- 商用车性能指标
- 电池性能和耐用性
- 充电速度和效率
- 可靠性和可用性标准
- 安全要求
- 环境绩效标准
- 风险评估框架
- 技术采用风险
- 电池效能和衰减风险
- 充电基础设施可用性风险
- 监理合规风险
- 市场需求波动
- 供应链中断风险
- 竞争性技术风险
第四章:竞争格局
- 介绍
- 公司市占率分析
- 北美洲
- 欧洲
- 亚太地区
- 拉丁美洲
- MEA
- 主要市场参与者的竞争分析
- 竞争定位矩阵
- 战略展望矩阵
- 关键进展
- 併购
- 合作伙伴关係与合作
- 新产品发布
- 扩张计划和资金
第五章:市场估价与预测:依车辆类型划分,2021-2034年
- 主要趋势
- 两轮车
- 自行车/自行车
- 踏板车
- 摩托车
- 三轮车
- 自动人力车
- 三轮车
- 轻型商用三轮车
- 四轮车
- 微型商用车
- 轻型商用车(LCV)
- 中型商用车
- 专业四轮车
- 微型移动性
- 个人出行
- 货物微型移动
第六章:市场估算与预测:依最终用途划分,2021-2034年
- 主要趋势
- 物流与运输服务
- 零售和电子商务公司
- 餐饮服务及餐饮业
- 医疗保健和製药业
- 政府及公共服务
- 公用事业和现场服务
- 其他的
第七章:市场估算与预测:依酬载能力划分,2021-2034年
- 主要趋势
- 不足50公斤
- 50-500公斤
- 500-1500公斤
- 超过1500公斤
第八章:市场估算与预测:以交付方式划分,2021-2034年
- 主要趋势
- 定期配送
- 当日送达
- 快递
第九章:市场估算与预测:以推进方式划分,2021-2034年
- 主要趋势
- 冰
- 电的
- 杂交种
第十章:市场估计与预测:依地区划分,2021-2034年
- 主要趋势
- 北美洲
- 我们
- 加拿大
- 欧洲
- 德国
- 英国
- 法国
- 义大利
- 西班牙
- 俄罗斯
- 北欧
- 亚太地区
- 中国
- 印度
- 日本
- 澳洲
- 韩国
- 菲律宾
- 印尼
- 拉丁美洲
- 巴西
- 墨西哥
- 阿根廷
- MEA
- 南非
- 沙乌地阿拉伯
- 阿联酋
第十一章:公司简介
- 全球参与者
- Arrival Limited
- BYD
- Ford
- General Motors
- GreenPower Motor Company
- Mercedes-Benz
- Nissan
- Rivian
- Stellantis
- Workhorse
- 区域玩家
- Bollinger Motors
- Canoo
- Chanje Energy
- Isuzu Motors
- Lightning eMotors
- Mahindra Electric
- Renault
- Tata Motors
- Volkswagen
- 新兴参与者
- Alke
- Cenntro Electric
- Einride
- Goupil
- SEA Electric
- StreetScooter
- Tevva Motors
- Volta Trucks
- Xos
The Global Last Mile Delivery Vehicle Market was valued at USD 164.1 billion in 2024 and is estimated to grow at a CAGR of 7.6% to reach USD 333.4 billion by 2034.
Rising e-commerce activity, dense urbanization, and increasing demand for rapid delivery are transforming the market landscape. Vehicles like small trucks, light commercial vans, three-wheelers, and cargo two-wheelers are helping service providers enhance delivery speed, navigate traffic, and cut down on fuel and maintenance costs. Real-time vehicle tracking, advanced telematics, and predictive maintenance are key tools operators are turning to for optimizing performance. Strategically located refueling stations and depot hubs are also improving vehicle utilization and minimizing idle time. With consumer behavior favoring faster and more flexible options, market players are adapting quickly to meet growing logistics expectations in city centers and suburban areas alike.
| Market Scope | |
|---|---|
| Start Year | 2024 |
| Forecast Year | 2025-2034 |
| Start Value | $164.1 Billion |
| Forecast Value | $333.4 Billion |
| CAGR | 7.6% |
Despite manufacturing disruptions during the pandemic, the surge in online retail has sharply increased investments in delivery vehicle fleets. Subscription-based leasing, remote diagnostics, and fleet-sharing solutions are gaining momentum to ensure flexibility and operational reliability. Growing demand for healthcare, food, grocery, and e-commerce deliveries has driven the widespread use of compact delivery vehicles. Operators and OEMs are now embedding IoT platforms, micro-mobility innovations, and intelligent fleet systems to streamline logistics and support urban transportation strategies.
The two-wheeler segment held a 37% share in 2024 and is projected to grow at a CAGR of 6.8% through 2034. These vehicles are widely used due to their affordability, quick navigation in traffic, and low operating costs. Businesses involved in food delivery, parcel logistics, and grocery distribution continue to favor bikes and scooters for short-distance trips. In regions like Asia Pacific, they remain dominant due to cost advantages and easier maneuverability. With electric variants gaining traction, operators are also prioritizing sustainability and low emissions across fleets.
The internal combustion engines (ICE) segment held a 65% share in 2024 and is expected to grow at a CAGR of 7.1% through 2034. These vehicles remain favored by fleet operators thanks to their longer range, quick refueling, and strong payload capacity. ICE models are widely available and supported by global infrastructure, making them ideal for high-volume daily deliveries, especially in areas with limited charging networks.
The regular delivery services segment accounted for a 42% share in 2024. This segment includes routine logistics such as parcels, groceries, and household items. Its steady growth is driven by recurring demand, predictable delivery routes, and widespread consumer reliance on scheduled shipments. Companies prefer regular delivery schedules for their cost-effectiveness and easier route planning, keeping the segment at the forefront of vehicle utilization.
U.S. Last Mile Delivery Vehicle Market generated USD 53.5 billion in 2024 and held an 85% share. Its leadership is supported by a well-developed e-commerce ecosystem and increasing investment in green transportation. Major logistics providers are actively deploying electric vans, cargo bikes, and e-trikes as part of sustainable delivery strategies. Government policies, including tax breaks and grant programs for EVs, are accelerating fleet electrification and encouraging operators to transition from ICE to electric models.
Key players active in the Global Last Mile Delivery Vehicle Industry include Tata Motors, Mercedes-Benz, GreenPower Motor, Stellantis, Rivian, General Motors, Mahindra Electric, Ford, Xos, and BYD. To secure a stronger foothold in the last mile delivery vehicle market, companies are focusing on a mix of electrification, digitalization, and flexible business models. Strategic investments are being made in battery technology, real-time vehicle intelligence, and connected platforms to optimize fleet operations. Leading manufacturers are rolling out purpose-built EVs designed for short-haul deliveries, while also partnering with logistics firms for pilot deployments. Telematics systems are being integrated for predictive maintenance and route optimization. Subscription models and vehicle leasing plans are also being introduced to attract SMEs and gig-economy drivers looking for scalable, low-cost entry into delivery services.
Table of Contents
Chapter 1 Methodology
- 1.1 Market scope and definition
- 1.2 Research design
- 1.2.1 Research approach
- 1.2.2 Data collection methods
- 1.3 Data mining sources
- 1.3.1 Global
- 1.3.2 Regional/Country
- 1.4 Base estimates and calculations
- 1.4.1 Base year calculation
- 1.4.2 Key trends for market estimation
- 1.5 Primary research and validation
- 1.5.1 Primary sources
- 1.6 Forecast model
- 1.7 Research assumptions and limitations
Chapter 2 Executive Summary
- 2.1 Industry 3600 synopsis, 2021 - 2034
- 2.2 Key market trends
- 2.2.1 Regional
- 2.2.2 Vehicle
- 2.2.3 Payload Capacity
- 2.2.4 End Use
- 2.2.5 Delivery Mode
- 2.2.6 Propulsion
- 2.3 TAM Analysis, 2025-2034
- 2.4 CXO perspectives: Strategic imperatives
- 2.4.1 Executive decision points
- 2.4.2 Critical success factors
- 2.5 Future outlook and strategic recommendations
Chapter 3 Industry Insights
- 3.1 Industry ecosystem analysis
- 3.1.1 Supplier landscape
- 3.1.2 Profit margin analysis
- 3.1.3 Cost structure
- 3.1.4 Value addition at each stage
- 3.1.5 Factor affecting the value chain
- 3.1.6 Disruptions
- 3.2 Industry impact forces
- 3.2.1 Growth drivers
- 3.2.1.1 Growth of e-commerce & same-day deliveries
- 3.2.1.2 Government incentives & urban low-emission policies
- 3.2.1.3 Urban population growth & traffic congestion
- 3.2.1.4 Advancements in battery technology and fast-charging solutions.
- 3.2.2 Industry pitfalls & challenges
- 3.2.2.1 High initial investment in vehicles and infrastructure.
- 3.2.2.2 Limited charging infrastructure and restricted vehicle range.
- 3.2.3 Market opportunities
- 3.2.3.1 Rise in electrification and hybrid vehicle adoption.
- 3.2.3.2 Surge in connected fleet management solutions.
- 3.2.3.3 Rise in demand from emerging markets like Asia-Pacific and Latin America.
- 3.2.3.4 Increase in sustainability-focused partnerships between logistics providers and OEMs.
- 3.2.1 Growth drivers
- 3.3 Growth potential analysis
- 3.4 Regulatory landscape
- 3.4.1 North America
- 3.4.2 Europe
- 3.4.3 Asia Pacific
- 3.4.4 Latin America
- 3.4.5 Middle East & Africa
- 3.5 Porter's analysis
- 3.6 PESTEL analysis
- 3.7 Technology and Innovation landscape
- 3.7.1 Current technological trends
- 3.7.2 Emerging technologies
- 3.8 Price trends
- 3.8.1 By region
- 3.8.2 By product
- 3.9 Production statistics
- 3.9.1 Production hubs
- 3.9.2 Consumption hubs
- 3.9.3 Export and import
- 3.10 Cost breakdown analysis
- 3.11 Patent analysis
- 3.12 Sustainability and environmental aspects
- 3.12.1 Sustainable practices
- 3.12.2 Waste reduction strategies
- 3.12.3 Energy efficiency in production
- 3.12.4 Eco-friendly initiatives
- 3.12.5 Carbon footprint considerations
- 3.13 Market adoption statistics
- 3.13.1 Electric delivery vehicle deployment rates
- 3.13.2 Fleet electrification progress
- 3.13.3 Charging infrastructure development
- 3.13.4 Technology feature adoption
- 3.13.5 Regional adoption patterns
- 3.13.6 Customer satisfaction metrics
- 3.13.7 Operational performance measurements
- 3.14 E-commerce & delivery market integration
- 3.14.1 Online retail growth impact
- 3.14.2 Last mile delivery vehicle demand analysis
- 3.14.3 Delivery speed & efficiency requirements
- 3.14.4 Customer expectation evolution
- 3.14.5 Peak season demand management
- 3.14.6 Urban delivery density optimization
- 3.14.7 Sustainability consumer preferences
- 3.15 Investment landscape analysis
- 3.15.1 Vehicle manufacturer investment
- 3.15.2 Fleet operator capital allocation
- 3.15.3 Government infrastructure funding
- 3.15.4 Private charging network investment
- 3.15.5 Venture capital in delivery technology
- 3.15.6 ROI analysis by investment type
- 3.15.7 Green bond & sustainable financing
- 3.16 Customer behavior analysis
- 3.16.1 Fleet operator decision factors
- 3.16.2 Vehicle selection criteria
- 3.16.3 Technology adoption preferences
- 3.16.4 Total cost of ownership priorities
- 3.16.5 Service & support requirements
- 3.16.6 Sustainability commitment influence
- 3.16.7 Regional preference variations
- 3.17 Business model evolution
- 3.17.1 Traditional vehicle sales models
- 3.17.2 Vehicle-as-a-service (VaaS) models
- 3.17.3 Leasing & financing solutions
- 3.17.4 Integrated fleet solutions
- 3.17.5 Charging-as-a-service models
- 3.17.6 Performance-based contracting
- 3.18 Performance & quality standards
- 3.18.1 Commercial vehicle performance metrics
- 3.18.2 Battery performance & durability
- 3.18.3 Charging speed & efficiency
- 3.18.4 Reliability & availability standards
- 3.18.5 Safety & security requirements
- 3.18.6 Environmental performance standards
- 3.19 Risk assessment framework
- 3.19.1 Technology adoption risks
- 3.19.2 Battery performance & degradation risks
- 3.19.3 Charging infrastructure availability risks
- 3.19.4 Regulatory compliance risks
- 3.19.5 Market demand volatility
- 3.19.6 Supply chain disruption risks
- 3.19.7 Competitive technology risks
Chapter 4 Competitive Landscape, 2024
- 4.1 Introduction
- 4.2 Company market share analysis
- 4.2.1 North America
- 4.2.2 Europe
- 4.2.3 Asia Pacific
- 4.2.4 LATAM
- 4.2.5 MEA
- 4.3 Competitive analysis of major market players
- 4.4 Competitive positioning matrix
- 4.5 Strategic outlook matrix
- 4.6 Key developments
- 4.6.1 Mergers & acquisitions
- 4.6.2 Partnerships & collaborations
- 4.6.3 New Product Launches
- 4.6.4 Expansion Plans and funding
Chapter 5 Market Estimates & Forecast, By Vehicle, 2021-2034 ($Bn, Units)
- 5.1 Key trends
- 5.2 Two-Wheeler
- 5.2.1 Bikes/Bicycles
- 5.2.2 Scooters
- 5.2.3 Motorcycles
- 5.3 Three-Wheeler
- 5.3.1 Auto Rickshaws
- 5.3.2 Tricycles
- 5.3.3 Light Commercial Three-Wheelers
- 5.4 Four-Wheeler
- 5.41 Micro Commercial Vehicles
- 5.4.2 Light Commercial Vehicles (LCV)
- 5.4.3 Medium Commercial Vehicles
- 5.4.4 Specialized Four-Wheelers
- 5.5 Micro Mobility
- 5.5.1 Personal Mobility
- 5.5.2 Cargo Micro Mobility
Chapter 6 Market Estimates & Forecast, By End Use, 2021-2034 ($Bn, Units)
- 6.1 Key trends
- 6.2 Logistics & Transportation Services
- 6.3 Retail & E-commerce Companies
- 6.4 Food Service & Restaurant Industry
- 6.5 Healthcare & Pharmaceutical Industry
- 6.6 Government & Public Services
- 6.7 Utilities & Field Services
- 6.8 Others
Chapter 7 Market Estimates & Forecast, By Payload Capacity, 2021-2034 ($Bn, Units)
- 7.1 Key trends
- 7.2 Less than 50 Kg
- 7.3 50-500 Kg
- 7.4 500- 1500 Kg
- 7.5 More than 1500 Kg
Chapter 8 Market Estimates & Forecast, By Delivery Mode, 2021-2034 ($Bn, Units)
- 8.1 Key trends
- 8.2 Regular Delivery
- 8.3 Same-Day Delivery
- 8.4 Express Delivery
Chapter 9 Market Estimates & Forecast, By Propulsion, 2021-2034 ($Bn, Units)
- 9.1 Key trends
- 9.2 ICE
- 9.3 Electric
- 9.4 Hybrid
Chapter 10 Market Estimates & Forecast, By Region, 2021 - 2034 ($Bn, Units)
- 10.1 Key trends
- 10.2 North America
- 10.2.1 US
- 10.2.2 Canada
- 10.3 Europe
- 10.3.1 Germany
- 10.3.2 UK
- 10.3.3 France
- 10.3.4 Italy
- 10.3.5 Spain
- 10.3.6 Russia
- 10.3.7 Nordics
- 10.4 Asia Pacific
- 10.4.1 China
- 10.4.2 India
- 10.4.3 Japan
- 10.4.4 Australia
- 10.4.5 South Korea
- 10.4.6 Philippines
- 10.4.7 Indonesia
- 10.5 Latin America
- 10.5.1 Brazil
- 10.5.2 Mexico
- 10.5.3 Argentina
- 10.6 MEA
- 10.6.1 South Africa
- 10.6.2 Saudi Arabia
- 10.6.3 UAE
Chapter 11 Company Profiles
- 11.1 Global Players
- 11.1.1 Arrival Limited
- 11.1.2 BYD
- 11.1.3 Ford
- 11.1.4 General Motors
- 11.1.5 GreenPower Motor Company
- 11.1.6 Mercedes-Benz
- 11.1.7 Nissan
- 11.1.8 Rivian
- 11.1.9 Stellantis
- 11.1.10 Workhorse
- 11.2 Regional Players
- 11.2.1 Bollinger Motors
- 11.2.2 Canoo
- 11.2.3 Chanje Energy
- 11.2.4 Isuzu Motors
- 11.2.5 Lightning eMotors
- 11.2.6 Mahindra Electric
- 11.2.7 Renault
- 11.2.8 Tata Motors
- 11.2.9 Volkswagen
- 11.3 Emerging Players
- 11.3.1 Alke
- 11.3.2 Cenntro Electric
- 11.3.3 Einride
- 11.3.4 Goupil
- 11.3.5 SEA Electric
- 11.3.6 StreetScooter
- 11.3.7 Tevva Motors
- 11.3.8 Volta Trucks
- 11.3.9 Xos
 2026-2030年全球最后一公里配送市场
 法国最后一公里配送:市场占有率分析、产业趋势与统计、成长预测(2026-2031)
 日本最后一公里配送市场规模、份额、趋势及预测(按服务类型、技术、应用和地区划分,2026-2034年)
 2032年全球自动驾驶城市最后一公里配送市场预测:按车辆类型、经营模式、企业规模、技术、最终用户和地区分類的分析全球都市区最后100公尺配送市场:未来预测(至2032年)-依车辆类型、配送范围、配送方式、企业规模、技术、最终用户及地区进行分析
 末端配送市场:依服务类型、车辆类型、配送方式及应用程式划分-全球预测至2035年
 最后一公里配送市场规模、份额和成长分析(按配送方式、目的地、服务类型、车辆类型、营运类型、应用和地区划分)-2026-2033年产业预测2032年末端物流市场预测:按配送类型、车辆类型、履约模式、技术、最终用户和地区分類的全球分析2032年末端配送机器人市场预测:全球分析(按产品、车辆类型、续航里程、负载容量、自主程度、应用、最终用户和地区划分)
 食品低温运输最后一公里配送市场(依运输方式、服务类型、温度范围、配送类型和最终用户划分)-全球预测,2025-2032年