


 |
市场调查报告书
商品编码
1693502
美国控制释放肥料:市场占有率分析、产业趋势与统计、成长预测(2025-2030)United States Controlled Release Fertilizer - Market Share Analysis, Industry Trends & Statistics, Growth Forecasts (2025 - 2030) |
||||||
※ 本网页内容可能与最新版本有所差异。详细情况请与我们联繫。
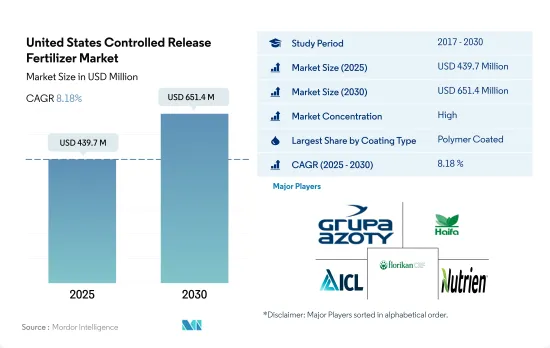
美国控制释放肥料市场规模预计在 2025 年为 4.397 亿美元,预计到 2030 年将达到 6.514 亿美元,预测期内(2025-2030 年)的复合年增长率为 8.18%。
CRF 在减少氮和磷浸出方面的效率推动了市场成长
- 预计 2022 年美国控制释放肥料市场规模将达 4.287 亿美元。农业部门减少环境影响的压力越来越大,再加上养分效率提高和精准施肥的好处,预计将推动市场价值在 2023 年至 2030 年期间以 8.0% 的复合年增长率强劲增长。
- 控制释放肥料可逐渐延长释放养分,确保作物在整个生长週期中稳定供应关键元素。透过减少养分的淋失和流失,这些肥料在减少田间农业对环境的影响方面发挥着至关重要的作用,特别是在解决水质和污染问题方面。
- 田间试验显示,包膜控制释放肥料的效果优于未包膜肥料,氮基肥料的淋溶减少 69.0%,磷基肥料的淋溶减少 82.0%。相较之下,未包覆的传统尿素会因挥发而损失高达 40% 的氨含量。经过多年的广泛测试,一致证明包膜尿素可以减少至少 95.0% 的氨损失。
- 2022年,聚合物涂层将主导美国控制释放肥料市场,占76.4%的市场。环境和成本考量正在推动对聚合物包膜控制释放肥料的需求。预计 2023 年至 2030 年期间聚合物涂料领域将以 7.7% 的健康速度成长。
- 在美国,由于政府推出了旨在控制肥料过度累积对环境影响的法规,控制释放肥料的需求激增。
美国控制释放肥料市场趋势
大豆和玉米是美国种植面积最大的两种作物。
- 在美国,人口将从2020年的3.359亿增加到2022年的3.382亿。自2000年以来,耕地总面积减少了近5,000万英亩,到2022年达到8.934亿英亩。有限的农业用地表明需要透过使用农业投入来提高农业生产力。人们长期以来一直使用肥料来提高作物的产量。美国四大主要作物为玉米、棉花、大豆和小麦,2022年这四大农作物种植面积将占主要作物面积的65.7%以上。
- 大豆和玉米是美国种植面积最大的两种作物。 2022年,大豆种植面积最大,占美国耕地总面积的25.8%,其次是玉米,占25.7%,小麦占11.1%。这些作物大部分生长在被称为「玉米带」的地区,该地区涵盖印第安纳州西部、伊利诺伊州、爱荷华州、密苏里州、内布拉斯加州东部和堪萨斯州东部。该地区主要产玉米和大豆。根据美国农业部的数据,美国是主要的米出口国,其主要种植区有四个地区:
- 农业供应製造商正在开发创新产品,帮助农民精准施肥。这使得农民能够降低种植成本,同时提高效率。该国的农田作物产业拥有巨大的市场潜力,随着政府资金和支持的增加,预计该作物种植领域将实现积极成长。
氮缺乏是美国作物最普遍的营养问题之一。
- 2022年美国田间作物主要养分(氮、钾、磷)平均施用量约为每公顷166.61公斤,其中氮占45.93%,其次是钾占28.11%,磷占25.96%。
- 在田间作物中,油菜籽/油菜籽表现突出,2022 年平均主要养分施用量为每公顷 284.92 公斤,为该领域最高。在主要养分中,氮肥施用量最高,平均施用量为每公顷 229.60 公斤。这一优势是由于氮在植物代谢中发挥的重要作用,因为它是叶绿素和氨基酸的关键成分。
- 在美国,玉米是第二田间作物,紧随其后的是油菜籽。 2022年,农民平均每公顷施用245.40公斤主要养分。光是玉米就占全国田间作物总产量的约31.44%。在主要养分施用方面,2022年玉米氮需求量为50.06%,磷需求量为23.77%,钾需求量为26.17%。
- 主要营养素在增强植物的酵素功能、细胞生长和生化过程方面发挥着至关重要的作用。这些营养物质的缺乏会对植物健康产生重大影响,阻碍其生长并降低作物产量。由于提高生产力的需求不断增加,田间作物主要营养物质的施用量预计将大幅增加。
美国控制释放肥料产业概况
美国控制释放肥料市场相当集中,前五大公司占了89.58%的市占率。市场的主要企业有:Grupa Azoty SA (Compo Expert)、Haifa Group、ICL Group Ltd、New Mountain Capital (Florikan) 和 Nutrien Ltd.(按字母顺序排列)
其他福利
- Excel 格式的市场预测 (ME) 表
- 3个月的分析师支持
目录
第一章执行摘要和主要发现
第二章 报告要约
第三章 引言
- 研究假设和市场定义
- 研究范围
- 调查方法
第四章 产业主要趋势
- 主要作物种植面积
- 田间作物
- 园艺作物
- 平均养分施用量
- 主要营养素
- 田间作物
- 园艺作物
- 主要营养素
- 法律规范
- 价值炼和通路分析
第五章市场区隔
- 涂层类型
- 聚合物涂层
- 聚合物硫涂层
- 其他的
- 作物类型
- 田间作物
- 园艺作物
- 草坪和观赏植物
第六章竞争格局
- 关键策略趋势
- 市场占有率分析
- 商业状况
- 公司简介
- AgroLiquid
- Grupa Azoty SA(Compo Expert)
- Haifa Group
- ICL Group Ltd
- New Mountain Capital(Florikan)
- Nutrien Ltd.
第七章:CEO面临的关键策略问题
第 8 章 附录
- 世界概况
- 概述
- 五力分析框架
- 全球价值链分析
- 市场动态(DRO)
- 资讯来源及延伸阅读
- 图片列表
- 关键见解
- 资料包
- 词彙表
The United States Controlled Release Fertilizer Market size is estimated at 439.7 million USD in 2025, and is expected to reach 651.4 million USD by 2030, growing at a CAGR of 8.18% during the forecast period (2025-2030).
The efficiency of CRFs in reducing nitrogen and phosphorus leaching propels market growth
- The market for controlled-release fertilizers in the United States was valued at USD 428.7 million in 2022. With mounting pressure on the agriculture sector to mitigate environmental repercussions, coupled with the benefits of enhanced nutrient efficiency and precise application, the market value is projected to witness a robust CAGR of 8.0% from 2023 to 2030.
- Controlled-release fertilizers offer a gradual and prolonged nutrient release, ensuring crops receive a consistent supply of vital elements throughout their growth cycle. By curbing nutrient leaching and runoff, these fertilizers play a pivotal role in reducing the environmental impact of field crop agriculture, particularly in addressing concerns about water quality and pollution.
- Field trials have shown that coated controlled-release fertilizers outperform their uncoated counterparts, reducing leaching by 69.0% for nitrogen-based fertilizers and 82.0% for phosphate-based ones. In contrast, uncoated conventional urea can lose up to 40% of its ammonia content through volatilization. Extensive testing over multiple years has consistently demonstrated that coated urea can slash ammonia losses by a minimum of 95.0%.
- In 2022, polymer coating dominated the United States controlled-release fertilizer market, accounting for 76.4% of the industry. Environmental and cost considerations are driving the demand for polymer-coated controlled-release fertilizers, thanks to the nation's focus on field crop cultivation. The polymer-coated segment is expected to witness a healthy growth rate of 7.7% from 2023 to 2030.
- The United States is witnessing a surge in demand for controlled-release fertilizers, propelled by government regulations aimed at curbing the environmental impact stemming from excessive fertilizer accumulation.
United States Controlled Release Fertilizer Market Trends
Soybean and corn are the two prominent crops grown in the United States
- In the United States, the population increased from 335.9 million in 2020 to 338.2 million in 2022. From 2000 onwards, the total farmland area decreased by almost 50 million acres, reaching a total of 893.4 million acres in 2022. The limited farmland indicates the need to increase agricultural productivity with the use of agri inputs. Fertilizers have been used for a long time to increase the productivity of crops. The four major crops in the United States are corn, cotton, soybean, and wheat, which account for more than 65.7% of the principal crop acreage in 2022.
- Soybean and corn are the two prominent crops grown in the United States. In 2022, soybean had the highest area under cultivation, accounting for 25.8% of the total arable land in the United States, followed by corn at 25.7% and wheat at 11.1%. The majority of these crops are grown in a region known as the "Corn Belt," which covers Western Indiana, Illinois, Iowa, Missouri, Eastern Nebraska, and Eastern Kansas. The production of corn (maize) and soybeans dominates this area. Additionally, the United States is a major exporter of rice, with most of the cultivation happening in four regions, three of which are in the South and one in California, according to the USDA.
- Manufacturers of farm inputs are developing innovative products to assist farmers with the precise application of fertilizers. This is helping farmers in reducing the cost of cultivation while increasing efficiency. The field crop industry of the country has immense market potential, and with increased government funding and support, it is expected to drive positive growth in crop cultivation in this area.
Nitrogen deficiency is one of the most prevalent crop nutrient problems across cropping areas in the United States
- The average application rate of primary nutrients (nitrogen, potassium, and phosphorus) in field crops in the United States stood at approximately 166.61 kg per hectare in the year 2022. Nitrogen represented 45.93% of this application, followed by potassium at 28.11% and phosphorus at 25.96% in the same year.
- Rapeseed/canola stands out among field crops, with an average primary nutrient application rate of 284.92 kg per hectare, the highest in this sector in 2022. Among the primary nutrients, nitrogen takes the lead, with an average application rate of 229.60 kg per hectare. This dominance can be attributed to nitrogen's pivotal role in plant metabolism, as it is a key component of both chlorophyll and amino acids.
- In the United States, corn/maize stands as the second-largest field crop, with rapeseed/canola following closely behind. On average, farmers applied 245.40 kg of primary nutrients per hectare in 2022. Corn alone contributes to around 31.44% of the nation's total field crop production. When it came to primary nutrient application, corn's nitrogen requirement accounted for 50.06%, phosphorus stood at 23.77%, and potash at 26.17% in 2022.
- Primary nutrients play a pivotal role in enhancing plant enzyme function, cellular growth, and biochemical processes. A deficiency in these nutrients can significantly impact plant health, stifle growth, and hamper crop yields. Given the rising need for increased productivity, the application of primary nutrients in field crops is expected to witness a notable uptick.
United States Controlled Release Fertilizer Industry Overview
The United States Controlled Release Fertilizer Market is fairly consolidated, with the top five companies occupying 89.58%. The major players in this market are Grupa Azoty S.A. (Compo Expert), Haifa Group, ICL Group Ltd, New Mountain Capital (Florikan) and Nutrien Ltd. (sorted alphabetically).
Additional Benefits:
- The market estimate (ME) sheet in Excel format
- 3 months of analyst support
TABLE OF CONTENTS
1 EXECUTIVE SUMMARY & KEY FINDINGS
2 REPORT OFFERS
3 INTRODUCTION
- 3.1 Study Assumptions & Market Definition
- 3.2 Scope of the Study
- 3.3 Research Methodology
4 KEY INDUSTRY TRENDS
- 4.1 Acreage Of Major Crop Types
- 4.1.1 Field Crops
- 4.1.2 Horticultural Crops
- 4.2 Average Nutrient Application Rates
- 4.2.1 Primary Nutrients
- 4.2.1.1 Field Crops
- 4.2.1.2 Horticultural Crops
- 4.2.1 Primary Nutrients
- 4.3 Regulatory Framework
- 4.4 Value Chain & Distribution Channel Analysis
5 MARKET SEGMENTATION (includes market size in Value in USD and Volume, Forecasts up to 2030 and analysis of growth prospects)
- 5.1 Coating Type
- 5.1.1 Polymer Coated
- 5.1.2 Polymer-Sulfur Coated
- 5.1.3 Others
- 5.2 Crop Type
- 5.2.1 Field Crops
- 5.2.2 Horticultural Crops
- 5.2.3 Turf & Ornamental
6 COMPETITIVE LANDSCAPE
- 6.1 Key Strategic Moves
- 6.2 Market Share Analysis
- 6.3 Company Landscape
- 6.4 Company Profiles
- 6.4.1 AgroLiquid
- 6.4.2 Grupa Azoty S.A. (Compo Expert)
- 6.4.3 Haifa Group
- 6.4.4 ICL Group Ltd
- 6.4.5 New Mountain Capital (Florikan)
- 6.4.6 Nutrien Ltd.
7 KEY STRATEGIC QUESTIONS FOR FERTILIZER CEOS
8 APPENDIX
- 8.1 Global Overview
- 8.1.1 Overview
- 8.1.2 Porter's Five Forces Framework
- 8.1.3 Global Value Chain Analysis
- 8.1.4 Market Dynamics (DROs)
- 8.2 Sources & References
- 8.3 List of Tables & Figures
- 8.4 Primary Insights
- 8.5 Data Pack
- 8.6 Glossary of Terms
 控释肥料市场-全球产业规模、份额、趋势、机会和预测,按类型、最终用途、应用方式、地区和竞争格局划分,2020-2030年预测
 全球控释肥料(CRF)市场按类型、功能、产品等级、应用方法、最终用途和地区划分-预测至2030年
 缓释性肥市场按包覆类型、作物类型、释放期、养分类型、应用、最终用途和销售管道划分-2025-2032 年全球预测包衣肥料市场-全球产业规模、份额、趋势、机会和预测(按类型、作物类型、地区和竞争情况划分,2020-2030 年)控制释放液态氮市场按产品类型、包衣类型、形态、释放机制、施用方法、作物类型、最终用户和分销管道划分 - 全球预测 2025-2030
 全球硝化抑制剂及尿素酶抑制剂市场分析及预测(至2032年):依产品类型、营养类型、作物类型、施用方法、通路、最终用户及地区划分
 2025年全球控制释放肥市场报告
 2025-2033年控释肥料市场(按类型、形式、应用和地区)报告
 硝化抑制剂及脲酶抑制剂市场机会、成长动力、产业趋势分析及 2025 - 2034 年预测2032 年控制释放和缓释性肥市场预测:按类型、作物类型、应用类型和地区分類的全球分析