


 |
市场调查报告书
商品编码
1693527
北美控制释放肥料:市场占有率分析、产业趋势与成长预测(2025-2030 年)North America Controlled Release Fertilizer - Market Share Analysis, Industry Trends & Statistics, Growth Forecasts (2025 - 2030) |
||||||
※ 本网页内容可能与最新版本有所差异。详细情况请与我们联繫。
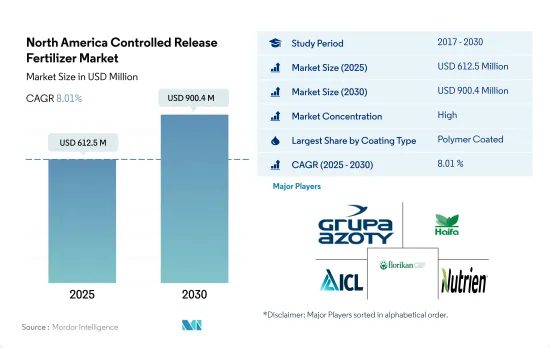
北美控制释放肥料市场规模预计在 2025 年为 6.125 亿美元,预计到 2030 年将达到 9.004 亿美元,预测期内(2025-2030 年)的复合年增长率为 8.01%。
确保人们在正确的时间获得适量的营养的努力正在推动该地区越来越多地采用 CRF。
- 2017 年至 2022 年,北美控制释放肥料市场以 15.0% 的复合年增长率成长。精密农业是该地区广泛接受的方法,优先考虑及时且准确地为作物提供营养。其中,控制释放肥料发挥至关重要的作用,确保作物获得最佳养分,成为精密农业的重要组成部分。
- 2022年,田间作物占据北美控制释放肥市场的主导地位,占据88.4%的市场占有率。园艺作物占3.7%。控制释放肥料广泛应用于谷物、谷类、蔬菜、果园和苗圃等高价值作物。专用化学肥料在连续作物中的使用尚未普及,但由于粮食价格上涨、人们对环境问题的日益关注以及对营养施用的监管越来越严格,其使用正在逐渐增加。
- 2022年,美国在控制释放肥料消费量方面处于领先地位,占比达69.9%。这项优点源自于国家对养分施用和防止肥料污染的规定。
- 美国环保署 (EPA) 和美国农业部 (USDA) 正在与肥料实验室 (TFI)、国际肥料开发中心 (IFDC)、大自然保护协会 (TNC) 和全国玉米种植者协会 (NCGA) 等主要相关人员合作,以认识肥料行业的技术发展。他们的目标是提高农民对控制释放肥料的认识,并对该国的农田作物生产产生积极的溢出效应。
对过度使用化学肥料和主要作物减少氮肥使用的环境担忧可能会推动 CRF 市场的发展。
- 2022年,美国占了CRF市场的69.9%。研究期间的复合年增长率为14.0%。聚合物涂料占据领先地位,到 2022 年将占据 76.4% 的份额。美国约 69% 的土地种植田间作物,包括大麦、玉米、棉花、燕麦、花生、高粱、大豆和小麦。由于这些作物对氮的需求量大,以氮效率高而闻名的聚合物包膜尿素的使用正在增加,进一步提高了聚合物包膜肥料的市场占有率。
- 在加拿大,小麦、菜籽和玉米等田间作物的种植面积正在迅速增加。为了支持这一趋势,加拿大政府透过加拿大农业信贷等倡议,增加农民的信贷机会,特别是为控制释放肥料等投入提供融资。这种有利的环境将在未来几年推动加拿大控制释放肥料市场的发展。
- 2021年,墨西哥国会在2022年联邦预算中核准了农业和农村发展部(SADER)27亿美元的预算。其中约70%的拨款用于化肥补贴。预计这将成为墨西哥控制释放肥料市场的主要推手。
- 在北美其他地区,精密农业的推动和应对气候变迁的努力正在推动控制释放肥料的采用激增。这些措施解决了环境问题并促进了永续的农业实践。
- 全部区域都迫切需要提高田间作物的产量,再加上政府的强力倡议和农民意识的不断提高,为未来几年光明的市场前景奠定了基础。
北美控制释放肥料市场趋势
补贴和其他政府财政支持有助于扩大田间作物
- 北美的农场种植多种作物,以田间作物为主。玉米、棉花、水稻、大豆和小麦是该地区的主要田间作物。美国、加拿大和墨西哥对该地区的农业生产贡献巨大。 2022 年,田间作物约占北美总种植面积的 97.6%,其中谷物和油籽占据市场主导地位。
- 从国家来看,美国占据市场主导地位,研究期间的作物总种植面积为 1.357 亿公顷。其中,农田作物和园艺占了大部分面积,2022年分别占97.2%和2.8%。然而,2018年至2019年间,该国作物面积大幅下降,主要原因是不利的环境条件导致德克萨斯和休士顿等地区发生严重洪涝灾害。
- 最大的栽培作物是玉米,大部分种植在美国中西部传统上被称为「玉米带」的地区,该地区涵盖印第安纳州西部、伊利诺伊州、爱荷华州、密苏里州、内布拉斯加州东部和堪萨斯州东部的大部分地区,玉米和大豆是主要作物。该地区也是大米的主要出口区,水稻种植主要集中在四个地区:因此,随着该地区田间作物市场潜力的增加以及政府资金投入和保护的增加,该地区田间作物种植面积预计会增加。
在主要营养元素中,氮肥在田间作物中的应用更为频繁。
- 水稻、玉米、小麦和油菜籽等田间作物是该地区主要的作物消耗作物。 2022 年,水稻将消耗约 140.85 公斤/公顷的主要养分,其次是油菜籽/油菜籽,消耗 118.40 公斤/公顷的主要养分。预计谷物将消耗最多的氮肥。由于该地区的集约化耕作,土壤养分耗尽,需要大量肥料来补充生长。
- 主要养分中,氮肥施用量最大,2022年约占74.0%,相当于田间作物229.8公斤/公顷。然而,氮缺乏是该地区最常见的作物营养问题之一。因此,大部分的氮供应是透过土壤施用提供。当施入土壤时,氮会转化为矿物质硝酸盐,以便植物轻鬆吸收。油菜籽是一种主要的氮消耗作物,在美国广泛种植。
- 油菜籽可用于提取润滑油、液压油和塑胶等工业用油。施肥率取决于土壤品质和降雨量,但氮需求量为每英亩 100 至 150 磅。磷肥和钾肥的施用量也因土壤而异。然而,根据 AgMRC 的建议施用量为每英亩 0-80 磅和每英亩 0-140 磅。
- 由于初级养分是各种作物养分的主要来源,由于土壤贫化和淋溶,其施用量预计将逐年大幅增加。
北美控制释放肥料产业概况
北美控制释放肥料市场相当集中,前五大公司占据了88.15%的市场。市场的主要企业包括 Grupa Azoty SA (Compo Expert)、Haifa Group、ICL Group Ltd、New Mountain Capital (Florikan) 和 Nutrien Ltd。
其他福利
- Excel 格式的市场预测 (ME) 表
- 3个月的分析师支持
目录
第一章执行摘要和主要发现
第二章 报告要约
第三章 引言
- 研究假设和市场定义
- 研究范围
- 调查方法
第四章 产业主要趋势
- 主要作物种植面积
- 田间作物
- 园艺作物
- 平均养分施用量
- 主要营养素
- 田间作物
- 园艺作物
- 主要营养素
- 法律规范
- 价值炼和通路分析
第五章市场区隔
- 涂层类型
- 聚合物涂层
- 聚合物硫涂层
- 其他的
- 作物类型
- 田间作物
- 园艺作物
- 草坪和观赏植物
- 原产地
- 加拿大
- 墨西哥
- 美国
- 北美其他地区
第六章竞争格局
- 关键策略趋势
- 市场占有率分析
- 商业状况
- 公司简介
- AgroLiquid
- Grupa Azoty SA(Compo Expert)
- Haifa Group
- ICL Group Ltd
- New Mountain Capital(Florikan)
- Nutrien Ltd.
第七章 CEO 的关键策略问题
第 8 章 附录
- 世界概况
- 概述
- 五力分析框架
- 全球价值链分析
- 市场动态(DRO)
- 资讯来源及延伸阅读
- 图片列表
- 关键见解
- 数据包
- 词彙表
The North America Controlled Release Fertilizer Market size is estimated at 612.5 million USD in 2025, and is expected to reach 900.4 million USD by 2030, growing at a CAGR of 8.01% during the forecast period (2025-2030).
Initiatives toward achieving right amount of nutrients at the right time will increase the CRFs adoption in the region
- Between 2017 and 2022, the North American controlled-release fertilizers market witnessed a CAGR of 15.0%. Precision farming, a widely embraced approach in the region, prioritizes timely and precise nutrient delivery to crops. Controlled-release fertilizers, in this context, assume a pivotal role, ensuring crops receive optimal nutrient dosages, thus becoming integral to precision farming.
- In 2022, field crops dominated the North American controlled-release fertilizers market, capturing 88.4% of the market share. Horticultural crops accounted for 3.7%. Controlled-release fertilizers found extensive usage in high-value crops like cereals, grains, vegetables, orchards, and nurseries. While specialty chemical adoption in row crops is not yet widespread, it is gradually rising due to surging grain prices, heightened environmental concerns, and stricter nutrient application regulations.
- In 2022, the United States led the consumption of controlled-release fertilizers, accounting for 69.9%. This dominance can be attributed to the nation's regulations governing nutrient application rates and fertilizer pollution control.
- Recognizing the technological strides in the fertilizer industry, the Environmental Protection Agency (EPA) and the US Department of Agriculture (USDA) have collaborated with key stakeholders like The Fertilizer Institute (TFI), the International Fertilizer Development Center (IFDC), The Nature Conservancy (TNC), and the National Corn Growers Association (NCGA). Their collective aim is to raise awareness about controlled-release fertilizers among farmers, with a positive ripple effect anticipated on the country's field crop production.
Environmental concerns about excessive use of fertilizers and reduced nitrogen use by major crops may drive the CRF market
- In 2022, the United States recorded a 69.9% share of the CRF market. The market grew by a CAGR of 14.0% during the study period. Polymer coating emerged as the leader, commanding a 76.4% share in 2022. Around 69% of the US cropland is dedicated to field crops, including barley, corn, cotton, oats, peanuts, sorghum, soybeans, and wheat. Given the high nitrogen requirements of these crops, the adoption of polymer-coated urea, known for its nitrogen efficiency, is on the rise, further bolstering the market share of polymer-coated fertilizers.
- Canada is witnessing a surge in the cultivation of field crops like wheat, canola, and maize. To support this trend, the Canadian government, through initiatives like Farm Credit Canada, is facilitating increased credit accessibility for farmers, specifically for inputs like controlled-release fertilizers. This favorable environment is poised to propel the controlled-release fertilizer market in Canada in the coming years.
- In 2021, the Mexican legislature approved a USD 2.70 billion budget for the Secretariat of Agriculture and Rural Development (SADER) in its 2022 Federal Government Budget. Around 70% of this allocation was earmarked for fertilizer subsidies. This is expected to be a key driver for the controlled-release fertilizer market in Mexico.
- The Rest of North America is witnessing a surge in the adoption of controlled-release fertilizers driven by the push for precision agriculture practices and climate-smart initiatives. These measures address environmental concerns and promote sustainable farming practices.
- Across the region, the imperative to boost field crop production, coupled with robust government initiatives and growing farmer awareness, sets the stage for a promising market outlook in the coming years.
North America Controlled Release Fertilizer Market Trends
The financial support by the government such as subsidies has contributed to the expansion of field crops
- A wide array of crops are grown on North American farms, mainly covering field crops. Corn, Cotton, Rice, Soybean, and Wheat are some of the dominating field crops across the region. The United States, Canada, and Mexico are major contributors to the region's agricultural output. In 2022, field crops covered around 97.6% of the overall cultivation in North America, with cereals and oilseeds dominating the market.
- By country, the United States dominates the market, covering 135.7 million hectares of the overall area under crop cultivation during the study period. Among them, field crops and horticulture are covering the majority of the area and accounted for 97.2% and 2.8% in 2022. However, between 2018-2019, the country witnessed a significant dip in crop acreages which is majorly due to unfavorable environmental conditions resulting in heavy floods in areas like Texas and Houston.
- The largest crop cultivated is corn, the majority of which is grown in a region known as the 'Corn Belt' traditional area in the midwestern United States, roughly covering western Indiana, Illinois, Iowa, Missouri, eastern Nebraska, and eastern Kansas, in which corn (maize) and soybeans are the dominant crops. Also, It is the major rice exporter, and the rice cultivation in the region is mainly concentrated within 4 regions with three in the South and one in California. Therefore, the increased market potential for the region's field crop, coupled with the increased government funding and protection is anticipated to positively drive the area under field crop cultivation in the region.
Among all the primary nutrients, nitrogen is applied in a higher quantity for field crops
- Field crops, such as rice, corn/maize, wheat, and rapeseed/canola, are some of the major primary nutrient-consuming crops in the region. In 2022, about 140.85 kg/hectare of primary nutrients were consumed by rice, followed by 118.40 kg/hectare consumed by rapeseed/canola. Cereals are anticipated to consume the maximum amount of nitrogen fertilizer. As they are grown intensively in the region, they deplete the nutrients in the soil and require more fertilizers to supplement growth.
- Among all the primary nutrients, nitrogen is applied in a higher quantity, accounting for about 74.0% in 2022, equivalent to 229.8 kg/hectare for field crops. Nitrogen deficiency, however, is one of the most prevalent crop nutrient problems in the region. Hence, most of the nitrogen supplement is provided through soil application. When applied to the soil, nitrogen is converted to mineral nitrate for the plants to absorb easily. Rapeseed, the major nitrogen-consuming crop, is widely grown in the United States.
- Rapeseed is used for extracting oil for industrial applications, like lubricants, hydraulic fluids, and plastics. While fertilizer usage is based on soil quality and rainfall potential, its nitrogen requirements range from 100 to 150 lbs/acre. Phosphorus and potassium fertility rates also vary from soil to soil. However, the recommended rates range from 0 to 80 lbs/acre and 0 to 140 lbs/acre, as per the AgMRC.
- Since primary nutrients are the major sources of nutrients for various crops, their application rates are anticipated to grow significantly over the years due to soil depletion, leaching, etc.
North America Controlled Release Fertilizer Industry Overview
The North America Controlled Release Fertilizer Market is fairly consolidated, with the top five companies occupying 88.15%. The major players in this market are Grupa Azoty S.A. (Compo Expert), Haifa Group, ICL Group Ltd, New Mountain Capital (Florikan) and Nutrien Ltd. (sorted alphabetically).
Additional Benefits:
- The market estimate (ME) sheet in Excel format
- 3 months of analyst support
TABLE OF CONTENTS
1 EXECUTIVE SUMMARY & KEY FINDINGS
2 REPORT OFFERS
3 INTRODUCTION
- 3.1 Study Assumptions & Market Definition
- 3.2 Scope of the Study
- 3.3 Research Methodology
4 KEY INDUSTRY TRENDS
- 4.1 Acreage Of Major Crop Types
- 4.1.1 Field Crops
- 4.1.2 Horticultural Crops
- 4.2 Average Nutrient Application Rates
- 4.2.1 Primary Nutrients
- 4.2.1.1 Field Crops
- 4.2.1.2 Horticultural Crops
- 4.2.1 Primary Nutrients
- 4.3 Regulatory Framework
- 4.4 Value Chain & Distribution Channel Analysis
5 MARKET SEGMENTATION (includes market size in Value in USD and Volume, Forecasts up to 2030 and analysis of growth prospects)
- 5.1 Coating Type
- 5.1.1 Polymer Coated
- 5.1.2 Polymer-Sulfur Coated
- 5.1.3 Others
- 5.2 Crop Type
- 5.2.1 Field Crops
- 5.2.2 Horticultural Crops
- 5.2.3 Turf & Ornamental
- 5.3 Country
- 5.3.1 Canada
- 5.3.2 Mexico
- 5.3.3 United States
- 5.3.4 Rest of North America
6 COMPETITIVE LANDSCAPE
- 6.1 Key Strategic Moves
- 6.2 Market Share Analysis
- 6.3 Company Landscape
- 6.4 Company Profiles
- 6.4.1 AgroLiquid
- 6.4.2 Grupa Azoty S.A. (Compo Expert)
- 6.4.3 Haifa Group
- 6.4.4 ICL Group Ltd
- 6.4.5 New Mountain Capital (Florikan)
- 6.4.6 Nutrien Ltd.
7 KEY STRATEGIC QUESTIONS FOR FERTILIZER CEOS
8 APPENDIX
- 8.1 Global Overview
- 8.1.1 Overview
- 8.1.2 Porter's Five Forces Framework
- 8.1.3 Global Value Chain Analysis
- 8.1.4 Market Dynamics (DROs)
- 8.2 Sources & References
- 8.3 List of Tables & Figures
- 8.4 Primary Insights
- 8.5 Data Pack
- 8.6 Glossary of Terms
 控释肥料市场-全球产业规模、份额、趋势、机会和预测,按类型、最终用途、应用方式、地区和竞争格局划分,2020-2030年预测
 全球控释肥料(CRF)市场按类型、功能、产品等级、应用方法、最终用途和地区划分-预测至2030年
 缓释性肥市场按包覆类型、作物类型、释放期、养分类型、应用、最终用途和销售管道划分-2025-2032 年全球预测包衣肥料市场-全球产业规模、份额、趋势、机会和预测(按类型、作物类型、地区和竞争情况划分,2020-2030 年)控制释放液态氮市场按产品类型、包衣类型、形态、释放机制、施用方法、作物类型、最终用户和分销管道划分 - 全球预测 2025-2030
 全球硝化抑制剂及尿素酶抑制剂市场分析及预测(至2032年):依产品类型、营养类型、作物类型、施用方法、通路、最终用户及地区划分
 2025年全球控制释放肥市场报告
 2025-2033年控释肥料市场(按类型、形式、应用和地区)报告
 硝化抑制剂及脲酶抑制剂市场机会、成长动力、产业趋势分析及 2025 - 2034 年预测2032 年控制释放和缓释性肥市场预测:按类型、作物类型、应用类型和地区分類的全球分析