


 |
市场调查报告书
商品编码
1693540
北美肥料:市场占有率分析、产业趋势与统计、成长预测(2025-2030)North America Fertilizers - Market Share Analysis, Industry Trends & Statistics, Growth Forecasts (2025 - 2030) |
||||||
价格
※ 本网页内容可能与最新版本有所差异。详细情况请与我们联繫。
简介目录
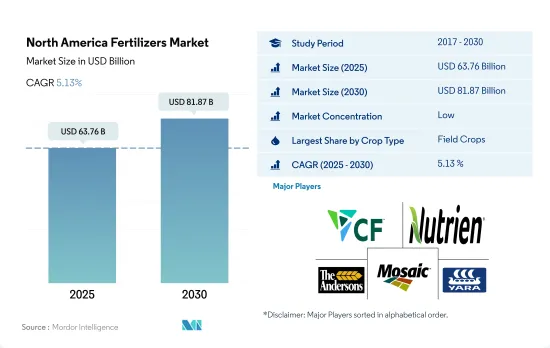
北美肥料市场规模预计在 2025 年将达到 637.6 亿美元,预计到 2030 年将达到 818.7 亿美元,预测期内(2025-2030 年)的复合年增长率为 5.13%。
预计增加产量和提高产量对肥料的需求不断增长将推动市场成长。
- 北美地区的肥料使用以田间作物为主,预计2022年市场规模将达672亿美元。这是由于该地区田间作物种植规模较大,占农业用地总面积的95.0%以上。美国占该地区可用耕地面积的69.0%,其中84.0%用于种植田间作物。
- 草坪和观赏作物是第二大肥料市场,2022 年价值 53 亿美元。随着可支配收入和生活水准的提高,观赏植物在房主中越来越受欢迎,施肥对于维持这些植物的健康和外观至关重要,预计这将推动市场成长。
- 园艺作物仅占农业用地总量的7.3%,而至2022年,园艺作物约占肥料市场总量的5.3%。儘管2018年至2021年园艺作物的种植面积下降了2.5%,但预计该地区对水果和蔬菜的需求将推动市场在2023年至2030年期间以6.1%的复合年增长率增长。种植面积的减少直接影响到使用更多的肥料来提高产量和满足需求。
- 此外,为提高作物产量和品质而增加化肥使用量、耕地面积减少以及需要增加产量以满足日益增长的需求等因素也在推动市场成长。因此,预计2023年至2030年间北美肥料市场价值将以4.9%的复合年增长率成长。
美国粮食种植面积增加推动市场成长
- 在北美,美国和墨西哥占据化肥市场价值和数量的80.0%以上。儘管北美拥有丰富的磷酸盐和钾肥资源,但一半以上的氮肥和85.0%以上的钾肥都仰赖进口。
- 美国和墨西哥是该地区最大的化肥消费国,主要原因是两国耕地面积大,分别占北美耕地面积的66.8%和18.7%。近年来,肥料科技进步帮助农民实现了效益最大化。
- 美国是该地区最大的市场,2022 年约占整个化肥市场的 49.3%。美国的优势主要在于其用于种植谷物作物的面积大,并且可以透过施肥解决各种营养缺陷问题。
- 整体而言,在北美,尤其是美国和加拿大,农业正随着现代技术的进步而变得更加机械化。这些技术改进正在推动该地区对更有效率、更永续肥料的需求。
- 2019-2020 年的供应链中断导致该地区化肥的价值和产量下降。但2020年至2021年,受化肥需求回升、投入成本上升等因素影响,化肥价格大幅上涨。
- 在北美地区,美国和墨西哥是最大的已开发国家。大多数跨国公司都位置该地区,这使得种植者和农民可以轻鬆获得化肥产品。
北美肥料市场趋势
补贴和其他政府财政支持正在促进田间作物。
- 北美的农场种植多种作物,以田间作物为主。玉米、棉花、水稻、大豆和小麦是该地区的主要田间作物。美国、加拿大和墨西哥对该地区的农业生产贡献巨大。 2022年,田间作物将占北美总种植面积的约97.6%,其中谷物和油籽占据市场主导地位。
- 美国占据市场主导地位,研究期间,作物种植总面积达 1.357 亿公顷。农田作物和园艺占该面积的大部分,2022年分别占97.2%和2.8%。然而,从2018年到2019年,作物种植面积大幅下降,主要原因是不利的环境条件导致德克萨斯和休士顿等地区发生严重洪灾。
- 种植最广泛的作物是玉米,大部分种植在美国中西部地区,传统上称为“玉米带”,大致覆盖印第安纳州西部、伊利诺伊州、爱荷华州、密苏里州、内布拉斯加州东部和堪萨斯州东部,这些地区主要作物玉米和大豆。它是大米的主要出口国,该地区的水稻种植集中在四个主要区域。因此,该地区田间作物市场潜力的不断增加,加上政府资金投入和保护力度的加大,预计将积极推动该地区田间作物面积的扩大。
在所有主要营养元素中,氮是田间作物最常施用的营养元素,相当于每公顷 229.8 公斤。
- 水稻、玉米、小麦和油菜籽等田间作物是该地区营养消费量最大的作物。 2022 年,水稻位居榜首,主要养分消耗量约为每公顷 140.85 公斤,紧随其后的是油菜籽/油菜籽,消耗量为每公顷 118.40 公斤。谷物种植面积广阔,因此需要更多的氮肥。这种密集耕作会耗尽土壤养分,因此需要增加施肥才能达到最佳生长。
- 氮肥将占据养分使用的绝大部分,到2022年将占到约74.0%,田间作物用量将达229.8公斤/公顷。儘管如此,氮缺乏仍然是该地区的一个主要问题。因此,氮供应主要靠土壤施氮。一旦进入土壤,氮就会转化为矿物质硝酸盐,使植物更容易吸收。特别值得注意的是油菜籽,它在美国广泛种植。
- 油菜籽具有工业用途,特别是在生产润滑剂、液压油和塑胶方面。施肥率取决于土壤品质和降雨模式,但油菜籽的氮需求通常为每英亩 100 至 150 磅。磷肥和钾肥的施用量根据土壤的不同而不同,但 AgMRC 建议的施用量分别为每英亩 0 至 80 磅和每英亩 0 至 140 磅。
- 鑑于主要营养元素在作物营养中的关键作用,由于土壤贫化和淋溶等问题,预计未来几年其施用率将大幅增加。
北美肥料行业概况。
北美肥料市场分散,前五大公司占35.62%的市占率。该市场的主要企业有:CF Industries Holdings, Inc.、Nutrien Ltd.、The Andersons Inc.、The Mosaic Company 和 Yara International ASA(按字母顺序排列)
其他福利
- Excel 格式的市场预测 (ME) 表
- 3个月的分析师支持
目录
第一章执行摘要和主要发现
第二章 报告要约
第三章 引言
- 研究假设和市场定义
- 研究范围
- 调查方法
第四章 产业主要趋势
- 主要作物种植面积
- 田间作物
- 园艺作物
- 平均养分施用量
- 微量营养素
- 田间作物
- 园艺作物
- 主要营养素
- 田间作物
- 园艺作物
- 次要宏量营养素
- 田间作物
- 园艺作物
- 微量营养素
- 灌溉农田
- 法律规范
- 价值炼和通路分析
第五章市场区隔
- 类型
- 复合型
- 直的
- 微量营养素
- 硼
- 铜
- 铁
- 锰
- 钼
- 锌
- 其他的
- 氮
- 硝酸铵
- 无水氨
- 尿素
- 其他的
- 磷酸
- DAP
- MAP
- SSP
- TSP
- 其他的
- 钾
- MoP
- SoP
- 其他的
- 次要营养物质
- 钙
- 镁
- 硫
- 形式
- 传统的
- 特别的
- CRF
- 液体肥料
- SRF
- 水溶性
- 施肥方式
- 受精
- 叶面喷布
- 土壤
- 作物类型
- 田间作物
- 园艺作物
- 草坪和观赏植物
- 原产地
- 加拿大
- 墨西哥
- 美国
- 北美其他地区
第六章竞争格局
- 关键策略趋势
- 市场占有率分析
- 商业状况
- 公司简介
- CF Industries Holdings, Inc.
- Haifa Group
- ICL Group Ltd
- Koch Industries Inc.
- Nutrien Ltd.
- Sociedad Quimica y Minera de Chile SA
- The Andersons Inc.
- The Mosaic Company
- Wilbur-Ellis Company LLC
- Yara International ASA
第七章:CEO面临的关键策略问题
第 8 章 附录
- 世界概况
- 概述
- 五力分析框架
- 全球价值链分析
- 市场动态(DRO)
- 资讯来源及延伸阅读
- 图片列表
- 关键见解
- 资料包
- 词彙表
简介目录
Product Code: 92605
The North America Fertilizers Market size is estimated at 63.76 billion USD in 2025, and is expected to reach 81.87 billion USD by 2030, growing at a CAGR of 5.13% during the forecast period (2025-2030).
The rising need of fertilizers to increase production and improve yield is anticipated to fuel the growth of the market
- Field crops dominate in fertilizer usage in North America, with a market value of USD 67.2 billion in the year 2022. This is due to the region's large-scale cultivation of field crops, which occupy over 95.0% of the total agricultural land. The United States accounts for 69.0% of the available arable land in the region, with 84.0% of it being used for field crop cultivation.
- Turf and ornamental crops are the second-largest market for fertilizers, valued at USD 5.3 billion in the year 2022. Ornamental plants are becoming increasingly popular among homeowners as disposable income and living standards rise, which is expected to fuel the growth of the market as fertilization is essential to maintain the health and appearance of these plants.
- Horticultural crops, accounting for just 7.3% of the total agricultural land, represented roughly 5.3% of the total fertilizer market value in 2022. Despite a 2.5% decrease in horticulture cultivation area between 2018 and 2021, the demand for fruits and vegetables in the region is expected to drive the market at a CAGR of 6.1% during 2023-2030. The decreased acreage directly influences the use of more fertilizers to increase production and meet demand.
- Furthermore, factors such as the increase in fertilizer usage for the improving yield and quality of the crops coupled with reducing arable land and the need to increase production to meet the growing demand are driving the growth of the market. Therefore, the North American fertilizers market value is expected to record a 4.9% CAGR during 2023-2030.
Higher cultivation areas under cereal crops in the United States propel the market growth
- In North America, the United States and Mexico constitute more than 80.0% of the fertilizers market value and volume. Even though North America has phosphate and potash resources, the region is a net importer of more than half nitrogenous and over 85.0% potash from international sources.
- The United States and Mexico are the largest consumers of fertilizers in the region, which is majorly due to the higher cultivation areas holding 66.8% and 18.7% of the total crop acreage of North America. Additional scientific and technical advancements in fertilizers in recent years have helped farmers maximize fertilizer benefits.
- The United States is the largest market in the region, accounting for about 49.3% of the total fertilizers market value in 2022. The dominance of the United States is mainly due to the higher cultivation areas under cereal crops and various nutrient deficiencies that are addressed by fertilization.
- Generally, in North America, agriculture has been mechanized with the latest technology, particularly in the United States and Canada. These technological improvements demand more efficient and sustainable fertilizers in the region.
- The supply chain disruptions in 2019-2020 declined the fertilizer value and volume in the region. However, between 2020 and 2021, the demand recovery for fertilizers and increased input costs resulted in a spike in the fertilizer value.
- In the North American region, the United States and Mexico are the biggest and most advanced economies. Most of the multinational companies are situated in the region, giving growers and farmers an advantage in terms of fertilizer product availability.
North America Fertilizers Market Trends
The financial support by the government, such as subsidies, has contributed to the expansion of field crops
- A wide array of crops are grown on North American farms, mainly covering field crops. Corn, cotton, rice, soybean, and wheat are some of the dominating field crops across the region. The United States, Canada, and Mexico are major contributors to the region's agricultural output. In 2022, field crops covered around 97.6% of the overall cultivation in North America, with cereals and oilseeds dominating the market.
- The United States dominates the market, with 135.7 million hectares of the overall area under crop cultivation during the study period. Field crops and horticulture cover the majority of the area, and they accounted for shares of 97.2% and 2.8%, respectively, in 2022. However, during 2018-2019, the country witnessed a significant dip in crop acreages, mainy due to unfavorable environmental conditions that resulted in heavy floods in areas like Texas and Houston.
- The most cultivated crop is corn, the majority of which is grown in a region known as the 'Corn Belt' traditional area in the midwestern United States, roughly covering western Indiana, Illinois, Iowa, Missouri, eastern Nebraska, and eastern Kansas, in which corn (maize) and soybeans are the dominant crops. It is the major rice exporter, and rice cultivation in the region is mainly concentrated in 4 regions, with three in the South and one in California. Therefore, the increased market potential for the region's field crop, coupled with the increased government funding and protection, is anticipated to positively drive the area under field crop cultivation in the region.
Among all the primary nutrients, nitrogen is applied in a higher quantity to field crops, which is equivalent to 229.8 kg/hectare
- Field crops, including rice, corn/maize, wheat, and rapeseed/canola, rank high in nutrient consumption in the region. In 2022, rice led the pack, consuming around 140.85 kg/hectare of primary nutrients, closely followed by rapeseed/canola at 118.40 kg/hectare. Cereals, being extensively cultivated, exhibit a higher appetite for nitrogen-based fertilizers. This intensive cultivation depletes soil nutrients, necessitating increased fertilizer application for optimal growth.
- Nitrogen dominates the primary nutrient usage, accounting for approximately 74.0% in 2022, translating to 229.8 kg/hectare for field crops. Despite this, nitrogen deficiency remains a significant concern in the region. Consequently, nitrogen supplements are predominantly provided through soil application. Once in the soil, nitrogen converts into mineral nitrate, facilitating easy absorption by plants. Notably, rapeseed, a key nitrogen consumer, enjoys widespread cultivation in the United States.
- Rapeseed finds industrial applications, notably in the production of oils for lubricants, hydraulic fluids, and plastics. While fertilizer usage hinges on soil quality and rainfall patterns, rapeseed's nitrogen requirements typically range from 100 to 150 lbs./acre. Phosphorus and potassium fertility rates exhibit soil-dependent variations, yet the recommended rates, as per AgMRC, span from 0 to 80 lbs./acre and 0 to 140 lbs./acre, respectively.
- Given the pivotal role of primary nutrients in crop nutrition, their application rates are poised for a significant uptick in the coming years, driven by concerns like soil depletion and leaching.
North America Fertilizers Industry Overview
The North America Fertilizers Market is fragmented, with the top five companies occupying 35.62%. The major players in this market are CF Industries Holdings, Inc., Nutrien Ltd., The Andersons Inc., The Mosaic Company and Yara International ASA (sorted alphabetically).
Additional Benefits:
- The market estimate (ME) sheet in Excel format
- 3 months of analyst support
TABLE OF CONTENTS
1 EXECUTIVE SUMMARY & KEY FINDINGS
2 REPORT OFFERS
3 INTRODUCTION
- 3.1 Study Assumptions & Market Definition
- 3.2 Scope of the Study
- 3.3 Research Methodology
4 KEY INDUSTRY TRENDS
- 4.1 Acreage Of Major Crop Types
- 4.1.1 Field Crops
- 4.1.2 Horticultural Crops
- 4.2 Average Nutrient Application Rates
- 4.2.1 Micronutrients
- 4.2.1.1 Field Crops
- 4.2.1.2 Horticultural Crops
- 4.2.2 Primary Nutrients
- 4.2.2.1 Field Crops
- 4.2.2.2 Horticultural Crops
- 4.2.3 Secondary Macronutrients
- 4.2.3.1 Field Crops
- 4.2.3.2 Horticultural Crops
- 4.2.1 Micronutrients
- 4.3 Agricultural Land Equipped For Irrigation
- 4.4 Regulatory Framework
- 4.5 Value Chain & Distribution Channel Analysis
5 MARKET SEGMENTATION (includes market size in Value in USD and Volume, Forecasts up to 2030 and analysis of growth prospects)
- 5.1 Type
- 5.1.1 Complex
- 5.1.2 Straight
- 5.1.2.1 Micronutrients
- 5.1.2.1.1 Boron
- 5.1.2.1.2 Copper
- 5.1.2.1.3 Iron
- 5.1.2.1.4 Manganese
- 5.1.2.1.5 Molybdenum
- 5.1.2.1.6 Zinc
- 5.1.2.1.7 Others
- 5.1.2.2 Nitrogenous
- 5.1.2.2.1 Ammonium Nitrate
- 5.1.2.2.2 Anhydrous Ammonia
- 5.1.2.2.3 Urea
- 5.1.2.2.4 Others
- 5.1.2.3 Phosphatic
- 5.1.2.3.1 DAP
- 5.1.2.3.2 MAP
- 5.1.2.3.3 SSP
- 5.1.2.3.4 TSP
- 5.1.2.3.5 Others
- 5.1.2.4 Potassic
- 5.1.2.4.1 MoP
- 5.1.2.4.2 SoP
- 5.1.2.4.3 Others
- 5.1.2.5 Secondary Macronutrients
- 5.1.2.5.1 Calcium
- 5.1.2.5.2 Magnesium
- 5.1.2.5.3 Sulfur
- 5.2 Form
- 5.2.1 Conventional
- 5.2.2 Speciality
- 5.2.2.1 CRF
- 5.2.2.2 Liquid Fertilizer
- 5.2.2.3 SRF
- 5.2.2.4 Water Soluble
- 5.3 Application Mode
- 5.3.1 Fertigation
- 5.3.2 Foliar
- 5.3.3 Soil
- 5.4 Crop Type
- 5.4.1 Field Crops
- 5.4.2 Horticultural Crops
- 5.4.3 Turf & Ornamental
- 5.5 Country
- 5.5.1 Canada
- 5.5.2 Mexico
- 5.5.3 United States
- 5.5.4 Rest of North America
6 COMPETITIVE LANDSCAPE
- 6.1 Key Strategic Moves
- 6.2 Market Share Analysis
- 6.3 Company Landscape
- 6.4 Company Profiles
- 6.4.1 CF Industries Holdings, Inc.
- 6.4.2 Haifa Group
- 6.4.3 ICL Group Ltd
- 6.4.4 Koch Industries Inc.
- 6.4.5 Nutrien Ltd.
- 6.4.6 Sociedad Quimica y Minera de Chile SA
- 6.4.7 The Andersons Inc.
- 6.4.8 The Mosaic Company
- 6.4.9 Wilbur-Ellis Company LLC
- 6.4.10 Yara International ASA
7 KEY STRATEGIC QUESTIONS FOR FERTILIZER CEOS
8 APPENDIX
- 8.1 Global Overview
- 8.1.1 Overview
- 8.1.2 Porter's Five Forces Framework
- 8.1.3 Global Value Chain Analysis
- 8.1.4 Market Dynamics (DROs)
- 8.2 Sources & References
- 8.3 List of Tables & Figures
- 8.4 Primary Insights
- 8.5 Data Pack
- 8.6 Glossary of Terms
02-2729-4219
+886-2-2729-4219
 硼肥市场-全球产业规模、份额、趋势、机会和预测,依来源、应用、区域和竞争格局划分,2020-2030年预测全球粪肥市场-产业规模、份额、趋势、机会及预测,依类型、形态、应用、区域及竞争格局划分,2020-2030年预测昆虫肥料市场-全球产业规模、份额、趋势、机会和预测,按类型、形态、应用、地区和竞争格局划分,2020-2030年预测海藻肥料市场-全球产业规模、份额、趋势、机会和预测,按形态(液体和粉末)、应用(农场、花园及其他)、地区和竞争格局划分,2020-2030年预测聚合物包膜肥料市场-全球产业规模、份额、趋势、机会和预测,按类型、作物类型、地区和竞争格局划分,2020-2030年预测
 按营养类型、形态、施用方法、作物类型、品种和地区分類的启动肥市场规模、份额和增长分析 - 2025-2032 年行业预测
 硅肥市场:预测(2025-2030 年)
 胶囊肥料市场依营养成分、释放机制、作物用途及地区划分
 几丁质肥料市场:按应用、最终用户、类型、原材料、配方和通路- 全球预测(2025-2032年)化肥市场按产品类型、作物类型、包装、施用方法、最终用户和分销管道划分-2025-2032年全球预测
▼