


 |
市场调查报告书
商品编码
1693550
美国化肥:市场占有率分析、产业趋势与统计、成长预测(2025-2030 年)United States Fertilizers - Market Share Analysis, Industry Trends & Statistics, Growth Forecasts (2025 - 2030) |
||||||
※ 本网页内容可能与最新版本有所差异。详细情况请与我们联繫。
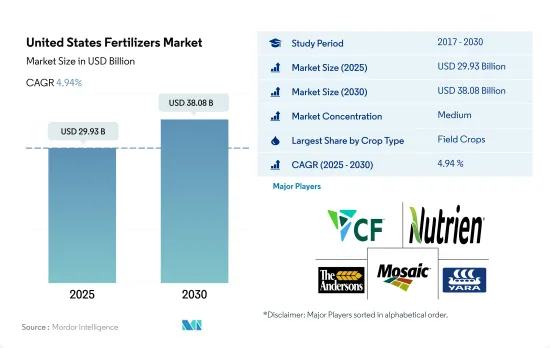
预计 2025 年美国肥料市场规模将达到 299.3 亿美元,到 2030 年将达到 380.8 亿美元,预测期内(2025-2030 年)的复合年增长率为 4.94%。
田间作物因种植面积大而占市场主导地位。
- 田间作物占美国肥料市场的大部分份额,2022 年占 87.2%。玉米是美国种植最广泛的作物,大部分种植在被称为玉米带的地区。美国种植作物是大豆。与玉米一样,农民主要在美国中西部各州种植大豆。
- 作物作物主要产自 10 个州,其中加州、佛罗里达州和奥勒冈的销量领先。 2022年,常规肥料将占最大份额,达到77.6%,其次是特种肥料,占22.4%。常规肥料占比高是由于农民对常规肥料的采用率高,且与专用肥料相比价格较低。
- 草坪和观赏作物占美国肥料市场的 10.3%。在美国,草坪和观赏植物的肥料使用量正在增加,但这是一个普遍的趋势。这种趋势通常是由人们对修剪整齐的草坪、花园和景观的渴望所驱动的。预计该市场从 2023 年到 2030 年的复合年增长率将达到 4.2%。
- 2022年,传统肥料占比最大,为77.8%。传统肥料通常比其他替代品更具成本效益,使其成为大规模农业和商业景观美化的实用选择。
- 对主要田间作物的需求不断增加、水果和草的种植面积不断扩大以及政府强调自给自足的政策导致了温室生产观赏花卉等战略的发展。预计这一发展将对该领域的成长做出重大贡献,预计 2023 年至 2030 年期间该领域的复合年增长率为 4.7%。
美国肥料市场趋势
由于农业用地有限,需要利用农业投入来提高农业生产力。
- 在美国,人口将从2020年的3.359亿增加到2022年的3.382亿。自2000年以来,耕地面积减少了近5,000万英亩,到2022年将达到8.934亿英亩。有限的农业用地表明需要透过使用农业投入来提高农业生产力。人们长期以来一直使用肥料来提高作物的产量。美国四大主要作物为玉米、棉花、大豆及小麦,2022年这四大农作物种植面积将占主要作物面积的65.7%以上。
- 大豆和玉米是美国种植面积最大的两种作物。 2022年大豆种植面积最大,占美国耕地面积的25.8%,其次是玉米,占25.7%,小麦占11.1%。这些作物大部分生长在被称为「玉米带」的地区,该地区涵盖印第安纳州西部、伊利诺伊州、爱荷华州、密苏里州、内布拉斯加州东部和堪萨斯州东部。该地区主要产玉米和大豆。根据美国农业部的数据,美国是主要的米出口国,其主要种植区有四个地区:
- 农业供应製造商正在开发创新产品,帮助农民精准施肥。这使得农民能够降低成本,同时提高种植效率。该国田间作物拥有巨大的市场潜力,随着政府资金和支持的增加,该领域的作物种植有望实现积极成长。
氮缺乏是美国作物最普遍的营养问题之一。
- 该国农田作物产业主要养分(氮、钾、磷)的平均施用量约为166.61公斤/公顷。氮为45.93%,钾为28.11%,磷为25.96%。
- 田间作物中,油菜籽/油菜籽的平均一次养分施用量为284.92公斤/公顷,为田间作物中最高。在主要养分中,氮肥施用量最高,平均施用量为229.60公斤/公顷。这是因为植物代谢需要大量的氮,而氮是叶绿素和胺基酸的主要成分。
- 在美国,玉米是第二田间作物,平均主要养分施用率为 245.40 公斤/公顷,其次是油菜籽。玉米产量约占全国田间作物总产量的31.44%。具体来说,玉米需要大约50.06%的氮、23.77%的磷和26.17%的钾,占总养分施用量的大部分。
- 主要营养素在增强植物酵素的功能、促进植物细胞生长和促进重要的生化过程方面发挥着至关重要的作用。这些主要营养素的缺乏会对植物健康产生严重影响,阻碍生长并影响作物产量。相反,为了满足日益增长的生产力需求,田间作物的主要养分施用量预计会增加。
美国化肥产业概况
美国肥料市场适度整合,前五大公司占57.61%。该市场的主要企业有:CF Industries Holdings, Inc.、Nutrien Ltd.、The Andersons Inc.、The Mosaic Company 和 Yara International ASA(按字母顺序排列)
其他福利
- Excel 格式的市场预测 (ME) 表
- 3个月的分析师支持
目录
第一章执行摘要和主要发现
第二章 报告要约
第三章 引言
- 研究假设和市场定义
- 研究范围
- 调查方法
第四章 产业主要趋势
- 主要作物种植面积
- 田间作物
- 园艺作物
- 平均养分施用量
- 微量营养素
- 田间作物
- 园艺作物
- 主要营养素
- 田间作物
- 园艺作物
- 次要宏量营养素
- 田间作物
- 园艺作物
- 微量营养素
- 灌溉农田
- 法律规范
- 价值炼和通路分析
第五章市场区隔
- 类型
- 复合型
- 直的
- 微量营养素
- 硼
- 铜
- 铁
- 锰
- 钼
- 锌
- 其他的
- 氮
- 硝酸铵
- 无水氨
- 尿素
- 其他的
- 磷酸
- DAP
- MAP
- SSP
- TSP
- 钾
- MoP
- SoP
- 其他的
- 次要营养物质
- 钙
- 镁
- 硫
- 形式
- 传统的
- 特别的
- CRF
- 液体肥料
- SRF
- 水溶性
- 施肥方式
- 受精
- 叶面喷布
- 土壤
- 作物类型
- 田间作物
- 园艺作物
- 草坪和观赏植物
第六章竞争格局
- 关键策略趋势
- 市场占有率分析
- 商业状况
- 公司简介
- CF Industries Holdings, Inc.
- Haifa Group
- ICL Group Ltd
- Koch Industries Inc.
- Nutrien Ltd.
- Sociedad Quimica y Minera de Chile SA
- The Andersons Inc.
- The Mosaic Company
- Wilbur-Ellis Company LLC
- Yara International ASA
第七章:CEO面临的关键策略问题
第 8 章 附录
- 世界概况
- 概述
- 五力分析框架
- 全球价值链分析
- 市场动态(DRO)
- 资讯来源及延伸阅读
- 图片列表
- 关键见解
- 资料包
- 词彙表
The United States Fertilizers Market size is estimated at 29.93 billion USD in 2025, and is expected to reach 38.08 billion USD by 2030, growing at a CAGR of 4.94% during the forecast period (2025-2030).
Field crops dominated the market owing to their larger cultivation area
- Field crops hold a major share of the US fertilizer market, as they accounted for 87.2% in 2022. The largest crop in the United States in terms of total production is corn, the majority of which grows in a region known as the Corn Belt. The second-largest crop grown in the United States is soybeans. Like corn, farmers primarily grow soybeans in the Midwestern states.
- Horticulture production primarily occurs in 10 states, with California, Florida, and Oregon leading the country in sales. Conventional fertilizers occupied a maximum share of 77.6% in 2022, followed by specialty fertilizers with 22.4%. The higher share of conventional fertilizers is due to the higher adoption of conventional fertilizers by farmers and their lower prices compared to specialty fertilizers.
- Turf and ornamental crops contribute to 10.3% of the US fertilizer market. The increased use of fertilizers in turf and ornamental plants in the United States is a common trend. This trend is often driven by the desire for well-manicured lawns, gardens, and landscapes. The market is expected to register a CAGR of 4.2% from 2023 to 2030.
- Conventional fertilizers occupied a maximum share of 77.8% in 2022. Conventional fertilizers are often more cost-effective than other alternatives, making them a practical choice for large-scale agriculture and commercial landscaping.
- The rising demand for major field crops, the expansion of cultivated areas for fruits and turf, and the government's emphasis on self-sufficiency have led to the development of strategies like greenhouse production of ornamental flowers. This development is expected to significantly contribute to segmental growth, with a projected CAGR of 4.7% between 2023 and 2030.
United States Fertilizers Market Trends
The limited farmland indicates the need to enhance agricultural productivity by employing agri-inputs
- In the United States, the population increased from 335.9 million in 2020 to 338.2 million in 2022. From 2000, the total farmland area decreased by almost 50 million acres, reaching a total of 893.4 million acres as of 2022. The limited farmland indicates the need to increase agricultural productivity with the use of agri inputs. Fertilizers have been used for a long time to increase the productivity of crops. The four major crops in the United States are corn, cotton, soybean, and wheat, which account for more than 65.7% of the principal crop acreage in 2022.
- Soybean and corn are the two largest crops grown in the United States. In 2022, soybeans had the highest area under cultivation, accounting for 25.8% of the total arable land in the United States, followed by corn at 25.7% and wheat at 11.1%. The majority of these crops are grown in a region known as the "Corn Belt," which covers western Indiana, Illinois, Iowa, Missouri, eastern Nebraska, and eastern Kansas. The production of corn (maize) and soybeans dominates this area. Additionally, the United States is a major exporter of rice, with most of the cultivation happening in four regions, three of which are in the South and one in California, according to the USDA.
- Manufacturers of farm inputs are developing innovative products to assist farmers with the precise application of fertilizers. This helps farmers reduce the cost of cultivation while increasing efficiency. The country's field crops have immense market potential, and with increased government funding and support, they are expected to drive positive growth in crop cultivation in this area.
Nitrogen deficiency is one of the most prevalent crop nutrient problems across cropping areas in the United States
- The average application rate of primary nutrients (nitrogen, potassium, and phosphorus) in the country's field crops industry stands at approximately 166.61 kg/hectare. Nitrogen constitutes 45.93%, potassium accounts for 28.11%, and phosphorus makes up 25.96% of the total primary nutrient application in field crops.
- In field crops, rapeseed/ canola was applied with an average primary nutrient application rate of 284.92 kg/hectare, which is the highest in field crops. In primary nutrients, nitrogen occupies first place with an average application rate of 229.60 kg/hectare. This is because nitrogen is required in large amounts for plant metabolism, and it is a major component of chlorophyll and amino acids.
- In the United States, corn/maize stands as the second-largest field crop, with an average primary nutrient application rate of 245.40 kg/hectare, followed by rapeseed/canola. Corn production constitutes approximately 31.44% of the country's total field crop output. Specifically, corn requires about 50.06% of nitrogen, 23.77% of phosphorus, and 26.17% of potash, making up the lion's share of the total nutrient application.
- Primary nutrients play a pivotal role in enhancing plant enzyme function, bolstering plant cell growth, and facilitating crucial biochemical processes. Any deficiency in these primary nutrients can significantly impact plant health, stunting growth and hampering crop yields. In response, the application of primary nutrients in field crops is expected to rise, driven by the need to meet escalating productivity demands.
United States Fertilizers Industry Overview
The United States Fertilizers Market is moderately consolidated, with the top five companies occupying 57.61%. The major players in this market are CF Industries Holdings, Inc., Nutrien Ltd., The Andersons Inc., The Mosaic Company and Yara International ASA (sorted alphabetically).
Additional Benefits:
- The market estimate (ME) sheet in Excel format
- 3 months of analyst support
TABLE OF CONTENTS
1 EXECUTIVE SUMMARY & KEY FINDINGS
2 REPORT OFFERS
3 INTRODUCTION
- 3.1 Study Assumptions & Market Definition
- 3.2 Scope of the Study
- 3.3 Research Methodology
4 KEY INDUSTRY TRENDS
- 4.1 Acreage Of Major Crop Types
- 4.1.1 Field Crops
- 4.1.2 Horticultural Crops
- 4.2 Average Nutrient Application Rates
- 4.2.1 Micronutrients
- 4.2.1.1 Field Crops
- 4.2.1.2 Horticultural Crops
- 4.2.2 Primary Nutrients
- 4.2.2.1 Field Crops
- 4.2.2.2 Horticultural Crops
- 4.2.3 Secondary Macronutrients
- 4.2.3.1 Field Crops
- 4.2.3.2 Horticultural Crops
- 4.2.1 Micronutrients
- 4.3 Agricultural Land Equipped For Irrigation
- 4.4 Regulatory Framework
- 4.5 Value Chain & Distribution Channel Analysis
5 MARKET SEGMENTATION (includes market size in Value in USD and Volume, Forecasts up to 2030 and analysis of growth prospects)
- 5.1 Type
- 5.1.1 Complex
- 5.1.2 Straight
- 5.1.2.1 Micronutrients
- 5.1.2.1.1 Boron
- 5.1.2.1.2 Copper
- 5.1.2.1.3 Iron
- 5.1.2.1.4 Manganese
- 5.1.2.1.5 Molybdenum
- 5.1.2.1.6 Zinc
- 5.1.2.1.7 Others
- 5.1.2.2 Nitrogenous
- 5.1.2.2.1 Ammonium Nitrate
- 5.1.2.2.2 Anhydrous Ammonia
- 5.1.2.2.3 Urea
- 5.1.2.2.4 Others
- 5.1.2.3 Phosphatic
- 5.1.2.3.1 DAP
- 5.1.2.3.2 MAP
- 5.1.2.3.3 SSP
- 5.1.2.3.4 TSP
- 5.1.2.4 Potassic
- 5.1.2.4.1 MoP
- 5.1.2.4.2 SoP
- 5.1.2.4.3 Others
- 5.1.2.5 Secondary Macronutrients
- 5.1.2.5.1 Calcium
- 5.1.2.5.2 Magnesium
- 5.1.2.5.3 Sulfur
- 5.2 Form
- 5.2.1 Conventional
- 5.2.2 Speciality
- 5.2.2.1 CRF
- 5.2.2.2 Liquid Fertilizer
- 5.2.2.3 SRF
- 5.2.2.4 Water Soluble
- 5.3 Application Mode
- 5.3.1 Fertigation
- 5.3.2 Foliar
- 5.3.3 Soil
- 5.4 Crop Type
- 5.4.1 Field Crops
- 5.4.2 Horticultural Crops
- 5.4.3 Turf & Ornamental
6 COMPETITIVE LANDSCAPE
- 6.1 Key Strategic Moves
- 6.2 Market Share Analysis
- 6.3 Company Landscape
- 6.4 Company Profiles
- 6.4.1 CF Industries Holdings, Inc.
- 6.4.2 Haifa Group
- 6.4.3 ICL Group Ltd
- 6.4.4 Koch Industries Inc.
- 6.4.5 Nutrien Ltd.
- 6.4.6 Sociedad Quimica y Minera de Chile SA
- 6.4.7 The Andersons Inc.
- 6.4.8 The Mosaic Company
- 6.4.9 Wilbur-Ellis Company LLC
- 6.4.10 Yara International ASA
7 KEY STRATEGIC QUESTIONS FOR FERTILIZER CEOS
8 APPENDIX
- 8.1 Global Overview
- 8.1.1 Overview
- 8.1.2 Porter's Five Forces Framework
- 8.1.3 Global Value Chain Analysis
- 8.1.4 Market Dynamics (DROs)
- 8.2 Sources & References
- 8.3 List of Tables & Figures
- 8.4 Primary Insights
- 8.5 Data Pack
- 8.6 Glossary of Terms
 2025-2033年日本肥料市场报告(依产品类型、产品、产品形态、作物类型和地区)
 启动肥料市场机会、成长动力、产业趋势分析及 2025 - 2034 年预测
 2025年全球化肥料市场报告2025年全球生物炭肥料市场报告2025年全球螯合肥料市场报告
 2032 年肥料市场预测:按产品类型、形态、作物类型、应用和地区分類的全球分析
 2025-2029年全球肥料市场
 中东和非洲肥料:市场占有率分析、行业趋势和统计数据、成长预测(2025-2030 年)中国化肥:市场占有率分析、产业趋势与统计、成长预测(2025-2030年)亚太化肥:市场占有率分析、产业趋势与成长预测(2025-2030 年)