


 |
市场调查报告书
商品编码
1693672
北美干混砂浆:市场占有率分析、行业趋势和成长预测(2025-2030 年)North America Dry Mix Mortar - Market Share Analysis, Industry Trends & Statistics, Growth Forecasts (2025 - 2030) |
||||||
价格
※ 本网页内容可能与最新版本有所差异。详细情况请与我们联繫。
简介目录
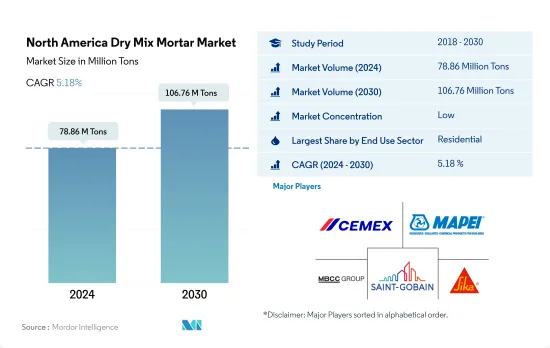
北美干混砂浆市场规模预计在 2024 年为 7,886 万吨,预计到 2030 年将达到 1.0676 亿吨,预测期内(2024-2030 年)的复合年增长率为 5.18%。
预计美国工业建筑领域即将建成的製造设施将推动干混砂浆的需求。
- 干混砂浆在住宅和商业建筑计划中都发挥着至关重要的作用。它广泛用于石灰外墙、水泥浆、磁砖黏合剂和接缝填料等应用。 2022年,北美占据全球干混砂浆市场的大部分份额,约占23%。根据地方政府旨在加强建筑业的倡议,预计 2023 年市场将增加 350 万吨。
- 2022年,住宅领域将成为干混砂浆市场的主导力量,产量达4,350万吨。预计这一趋势将持续到 2023 年,优惠的房屋抵押贷款利率和政府支持的经济适用住宅计划将推动对住宅的需求。具体而言,2023 年的预测显示,住宅占地面积预计将增加 1.32 亿平方英尺,住宅建筑中使用的干混砂浆量将增加 3.94%。
- 在各个建筑领域中,工业部门预计将以最高速度成长,预测期内预计复合年增长率为 7.51%。特别是在美国,随着製造设施的建设,预计需求将激增。需求成长是由于政府的倡议,如《基础设施投资和就业法案》(IIJA)、《通货膨胀控制法案》(IRA)和《住房基础设施投资保护法》(CHIPS),这些倡议为私人和公共建设活动提供税收优惠和直接资金。
预计快速成长的墨西哥住宅和商业建筑业将推动北美对干混砂浆的需求。
- 干混砂浆由波特兰水泥、混合均匀的砂浆砂和精选外加剂的特殊混合物组成。它广泛用于水泥浆、灰泥、抹灰等。 2022 年,北美干混砂浆市场规模与 2021 年相比成长了 5.95%,而墨西哥和美国等国家分别录得 20.7% 和 4.06% 的成长率。 2023 年,北美干混砂浆市场以金额为准预计将比 2022 年增长 4.95%,这主要得益于住宅、商业、基础设施和工业领域的大型建设计划。
- 2022年,美国占据干混砂浆的大部分份额,为5,340万吨。推动这一成长的是,美国建筑业吸引了17,929亿美元的投资,比2021年增长10.2%,其中住宅、土木工程和非住宅计划占主导地位。预计2022年美国干混砂浆市场将成长4.06%,2023年将成长5.19%。
- 预计墨西哥干混砂浆市场将以 6.84% 的复合年增长率成长,在数量方面超过北美市场。受世界银行集团计画支持的经济适用住宅推动,该国住宅建设正在激增。此外,由于美国-墨西哥-加拿大协议(USMCA)以及与中国日益紧张的关係等因素改变了供应链动态,墨西哥的仓库和仓储设施建设正在增加,进一步推动了对干混砂浆的需求。
北美干混砂浆市场趋势
美国和其他主要国家的商业设施建设计划可能会推动商业房地产的成长。
- 在北美,2022 年新增商业占地面积较 2021 年增加了 4%,这主要是由于加拿大和墨西哥同期的成长率分别约为 7% 和 24%。由于在家工作趋势的下降以及随着企业在全部区域的扩张而对市中心的需求增加,预计 2023 年该行业的新占地面积将比 2022 年增长约 6%。
- 由于新冠疫情及其影响(包括供应链中断和经济不确定性),该行业在 2020-2021 年遭受了显着损失。因此,2020年和2021年新占地面积分别与前一年同期比较下降12.96%和8.39%。加拿大是该产业受影响最严重的国家,2020 年该国新建占地面积较去年与前一年同期比较下降 25.05%。
- 就规模而言,商业领域新增占地面积预计在预测期内(2023-2030 年)的复合年增长率为 4%,这主要归因于美国等主要国家即将开展的商业建设活动。例如,103 街和安提阿路的混合用途重建项目、EllIoT 和 Sossaman 路数据中心、门罗街区混合用途开发项目以及伍德赛德广场的重建项目都是预计将于 2023 年在全国各地启动的一些大型商业计划。据估计,该产业在墨西哥的成长最快,预计 2030 年新增占地面积将达到 1.92 亿平方英尺,而 2022 年为 1.36 亿平方英尺。
受收入成长、低利率和新居住者涌入的推动,加拿大预计将引领北美住宅产业的成长。
- 2022年,儘管住宅飙升,但北美住宅新占地面积仍成长5.03%。值得注意的是,到 2022 年初,美国房屋抵押贷款利率已从 3.2% 飙升至 7.5% 左右。预计 2023 年这一飙升趋势将持续,新建占地面积将成长 3.45%。据估计,到 2023 年 5 月,美国将建造 163 万套住宅,较 2022 年 4 月以来建造的 180 万套大幅增长。
- 2020年,该地区的住宅产业遭遇挫折,新建占地面积减少了9,000万平方英尺,这主要是由于新冠疫情的不利影响。这些干扰包括关闭、流动性限制和新建筑需求减少。例如,2020 年加拿大新建住宅中多用户住宅数量急剧下降了 51.9%。然而,随着2021年经济从疫情的影响中復苏,该产业也出现復苏,新增占地面积增加了2.89亿平方英尺。其中,美国和加拿大新建住宅占地面积分别成长14.5%和19.7%。
- 就建筑面积而言,该地区新建占地面积预计在 2023 年至 2030 年期间的复合年增长率为 3.67%。由于收入增加、利率较低以及新居住者(主要是千禧世代和 Z 世代)的涌入,组建家庭并寻求拥有住房,预计加拿大将引领这一成长。
北美干混砂浆产业概况
北美干混砂浆市场分散,前五大公司占11.20%的市占率。该市场的主要企业包括 CEMEX、SAB de CV、MAPEI SpA、MBCC Group、Saint-Gobain、Sika AG 等。
其他福利
- Excel 格式的市场预测 (ME) 表
- 3个月的分析师支持
目录
第一章执行摘要和主要发现
第二章 报告要约
第三章 引言
- 研究假设和市场定义
- 研究范围
- 调查方法
第四章 产业主要趋势
- 最终用途细分趋势
- 商业的
- 工业/设施
- 基础设施
- 住宅
- 重大基础设施计划(目前和已宣布)
- 法律规范
- 价值炼和通路分析
第五章市场区隔
- 最终用途部分
- 商业的
- 工业/设施
- 基础设施
- 住宅
- 应用
- 混凝土保护与维修
- 水泥浆
- 绝缘和饰面系统
- 石膏
- 使成为
- 磁砖胶
- 防水浆料
- 其他的
- 国家
- 加拿大
- 墨西哥
- 美国
第六章竞争格局
- 关键策略趋势
- 市场占有率分析
- 商业状况
- 公司简介
- Ardex Group
- Cementos Moctezuma
- CEMEX, SAB de CV
- CRH
- FORTALEZA MATERIALES, SAB DE CV
- LATICRETE International, Inc.
- MAPEI SpA
- MBCC Group
- Saint-Gobain
- Sika AG
第七章:CEO面临的关键策略问题
第 8 章 附录
- 世界概况
- 概述
- 五力分析框架(产业吸引力分析)
- 全球价值链分析
- 市场动态(DRO)
- 资讯来源及延伸阅读
- 图片列表
- 关键见解
- 数据包
- 词彙表
简介目录
Product Code: 93228
The North America Dry Mix Mortar Market size is estimated at 78.86 million Tons in 2024, and is expected to reach 106.76 million Tons by 2030, growing at a CAGR of 5.18% during the forecast period (2024-2030).
Upcoming manufacturing facilities in the US industrial construction sector are expected to drive the demand for dry-mix mortar
- Dry-mix mortar plays a pivotal role in both residential and commercial building projects. It finds extensive use in applications like stucco, grouts, tile adhesives, and joint fillers. In 2022, North America held a significant share of approximately 23% of the global dry-mix mortar market. In 2023, the market was projected to witness a growth of 3.5 million tons, driven by the initiatives of the regional governments aimed at bolstering the construction sector.
- In 2022, the residential segment emerged as the dominant force in the dry-mix mortar market, accounting for a substantial 43.5 million tons. The trend was set to continue in 2023, with factors such as favorable mortgage rates and government-backed affordable housing schemes fueling demand for new residential units. Notably, the forecast for 2023 indicated a projected increase of 132 million square feet in residential floor area, driving a 3.94% growth in the volume of dry-mix mortar used in residential construction.
- Among various construction segments, the industrial sector is poised for the highest growth rate, with a projected CAGR of 7.51% in volume during the forecast period. The United States, in particular, is expected to witness a surge in demand driven by a wave of manufacturing facility construction. This uptick can be attributed to government initiatives like the Infrastructure Investment and Jobs Act (IIJA), Inflation Reduction Act (IRA), and CHIPS Act, which offer tax incentives and direct funding for both private and public construction endeavors.
Mexico's fastest-growing residential and commercial construction sectors are predicted to bolster the demand for dry-mix mortar in North America
- Dry-mix mortar comprises a special blend of Portland cement, well-graded mortar sand, and selected admixtures. It is widely used in grouts, plasters, renders, etc. In 2022, the North American dry-mix mortar market grew by 5.95% in volume compared to 2021, with countries like Mexico and the United States recording growth rates of 20.7% and 4.06%, respectively. In 2023, the North American dry-mix mortar market was estimated to grow by 4.95% in value compared to 2022, owing to large-scale construction projects spread across the residential, commercial, infrastructure, and industrial sectors.
- In 2022, the United States dominated the dry-mix mortar landscape, accounting for a sizable 53.4 million tons. Bolstering this growth, the US construction sector attracted investments totaling USD 1792.9 billion, a 10.2% surge from 2021, with a focus on residential, civil engineering, and non-residential projects. This surge in construction fueled a 4.06% uptick in the US dry-mix mortar market in 2022, and the sector was poised to expand by 5.19% in volume in 2023.
- With a projected CAGR of 6.84% in volume, the Mexican dry-mix mortar market is expected to outpace its North American counterparts. The country's push for affordable housing, supported by programs from the World Bank Group, is expected to drive a surge in residential construction. Additionally, as supply chain dynamics shift due to factors like the United States-Mexico-Canada Agreement (USMCA) and heightened tensions with China, Mexico is witnessing an uptick in warehouse and storage facility construction, further bolstering its dry-mix mortar demand.
North America Dry Mix Mortar Market Trends
Upcoming commercial construction in leading economies, such as the United States, may propel the growth of commercial construction
- In North America, the new floor area construction in the commercial sector was 4% higher in 2022 compared to 2021, primarily due to Canada and Mexico, which recorded growth rates of about 7% and 24%, respectively, during the same period. The new floor area construction of the sector was estimated to increase by around 6% in 2023 compared to 2022 due to the growth in demand for commercial spaces as the work-from-home trend declined and businesses expanded across the region.
- The sector witnessed noticeable losses during 2020 and 2021 because of the COVID-19 pandemic and its impact, such as disruptions in supply chains and economic uncertainty. As a result, the new floor area constructions in 2020 and 2021 declined by 12.96% and 8.39% compared to their respective previous years. The sector was most affected in Canada in 2020, such that the new floor area construction declined by 25.05% over the previous year.
- The commercial sector's new floor area construction is expected to register a CAGR of 4% in terms of volume during the forecast period (2023-2030) due to upcoming commercial construction activities, primarily in leading economies such as the United States. For instance, 103rd Street and Antioch Road mixed-use redevelopment, Elliot and Sossaman Road data center, Monroe Block mixed-use complex, and Woodside Square redevelopment were some large commercial projects that were expected to commence in the country in 2023. The sector is estimated to witness the most growth in Mexico, with the new floor area construction estimated to reach 192 million sq. ft by 2030 compared to 136 million sq. ft in 2022.
Canada is expected to lead the residential sector's growth in North America, driven by rising incomes, low interest rates, and an influx of new residents
- In 2022, the residential sector in North America saw a 5.03% growth in new floor area construction despite soaring housing prices. Notably, mortgage rates in the United States surged from 3.2% to approximately 7.5% by early 2022. This surge was expected to persist in 2023, with new floor area construction rising by 3.45%. By May 2023, the United States was estimated to hit 1.63 million new home constructions, marking a significant surge from 1.8 million units since April 2022.
- In 2020, the region's residential sector faced a setback, witnessing a 90-million sq. ft drop in new floor area construction, primarily due to the negative impact of the COVID-19 pandemic. These disruptions included lockdowns, liquidity constraints, and a dampened demand for new buildings. For instance, in 2020, new residential construction in Canada saw a steep 51.9% decline in multi-family homebuilding. However, in 2021, with the economies recovering from the impact of the pandemic, the sector also rebounded, with a notable 289 million sq. ft increase in new floor area construction. Specifically, the United States and Canada saw volume growths of 14.5% and 19.7%, respectively, in new residential construction.
- The region's new floor area construction is projected to witness a CAGR of 3.67% in terms of volume from 2023 to 2030. Canada is expected to lead this growth, driven by rising incomes, low interest rates, and an influx of new residents, particularly millennials and Gen Z, who are forming their own households and seeking homeownership.
North America Dry Mix Mortar Industry Overview
The North America Dry Mix Mortar Market is fragmented, with the top five companies occupying 11.20%. The major players in this market are CEMEX, S.A.B. de C.V., MAPEI S.p.A., MBCC Group, Saint-Gobain and Sika AG (sorted alphabetically).
Additional Benefits:
- The market estimate (ME) sheet in Excel format
- 3 months of analyst support
TABLE OF CONTENTS
1 EXECUTIVE SUMMARY & KEY FINDINGS
2 REPORT OFFERS
3 INTRODUCTION
- 3.1 Study Assumptions & Market Definition
- 3.2 Scope of the Study
- 3.3 Research Methodology
4 KEY INDUSTRY TRENDS
- 4.1 End Use Sector Trends
- 4.1.1 Commercial
- 4.1.2 Industrial and Institutional
- 4.1.3 Infrastructure
- 4.1.4 Residential
- 4.2 Major Infrastructure Projects (current And Announced)
- 4.3 Regulatory Framework
- 4.4 Value Chain & Distribution Channel Analysis
5 MARKET SEGMENTATION (includes market size, forecasts up to 2030 and analysis of growth prospects.)
- 5.1 End Use Sector
- 5.1.1 Commercial
- 5.1.2 Industrial and Institutional
- 5.1.3 Infrastructure
- 5.1.4 Residential
- 5.2 Application
- 5.2.1 Concrete Protection and Renovation
- 5.2.2 Grouts
- 5.2.3 Insulation and Finishing Systems
- 5.2.4 Plaster
- 5.2.5 Render
- 5.2.6 Tile Adhesive
- 5.2.7 Water Proofing Slurries
- 5.2.8 Other Applications
- 5.3 Country
- 5.3.1 Canada
- 5.3.2 Mexico
- 5.3.3 United States
6 COMPETITIVE LANDSCAPE
- 6.1 Key Strategic Moves
- 6.2 Market Share Analysis
- 6.3 Company Landscape
- 6.4 Company Profiles
- 6.4.1 Ardex Group
- 6.4.2 Cementos Moctezuma
- 6.4.3 CEMEX, S.A.B. de C.V.
- 6.4.4 CRH
- 6.4.5 FORTALEZA MATERIALES, S.A.B. DE C.V
- 6.4.6 LATICRETE International, Inc.
- 6.4.7 MAPEI S.p.A.
- 6.4.8 MBCC Group
- 6.4.9 Saint-Gobain
- 6.4.10 Sika AG
7 KEY STRATEGIC QUESTIONS FOR CONCRETE, MORTARS AND CONSTRUCTION CHEMICALS CEOS
8 APPENDIX
- 8.1 Global Overview
- 8.1.1 Overview
- 8.1.2 Porter's Five Forces Framework (Industry Attractiveness Analysis)
- 8.1.3 Global Value Chain Analysis
- 8.1.4 Market Dynamics (DROs)
- 8.2 Sources & References
- 8.3 List of Tables & Figures
- 8.4 Primary Insights
- 8.5 Data Pack
- 8.6 Glossary of Terms
02-2729-4219
+886-2-2729-4219
 东协干混砂浆:市占率分析、产业趋势与统计、成长预测(2026-2031)干混砂浆:市场占有率分析、产业趋势与统计、成长预测(2026-2031)欧洲干粉砂浆:市场占有率分析、产业趋势与统计、成长预测(2026-2031)
 2026年全球干混砂浆添加剂和化学品市场报告
 塔式干粉砂浆搅拌站市场按产品类型、搅拌能力、应用、最终用途和分销管道划分-2026-2032年全球预测自流平砂浆添加剂市场按类型、形态、应用、终端用户产业和分销管道划分,全球预测,2026-2032年预拌建筑砂浆市场(依产品类型、形态、包装类型、应用、最终用途及通路划分)-2026-2032年全球预测
 干混砂浆添加剂和化学品市场规模、份额和成长分析(按添加剂类型、化学品类型、应用、最终用户和地区划分)—2026-2033年产业预测
 干混砂浆市场规模、份额和成长分析(按产品类型、粘合剂类型、添加剂、最终用户、技术、应用和地区划分)—产业预测(2026-2033 年)
 全球干混砂浆市场:依产品种类、塑化剂种类、应用、黏结剂系统及地区划分(至2032年)
▼