


 |
市场调查报告书
商品编码
1849911
北美数位电子看板:市场份额分析、行业趋势、统计数据和成长预测(2025-2030 年)North America Digital Signage - Market Share Analysis, Industry Trends & Statistics, Growth Forecasts (2025 - 2030) |
||||||
※ 本网页内容可能与最新版本有所差异。详细情况请与我们联繫。
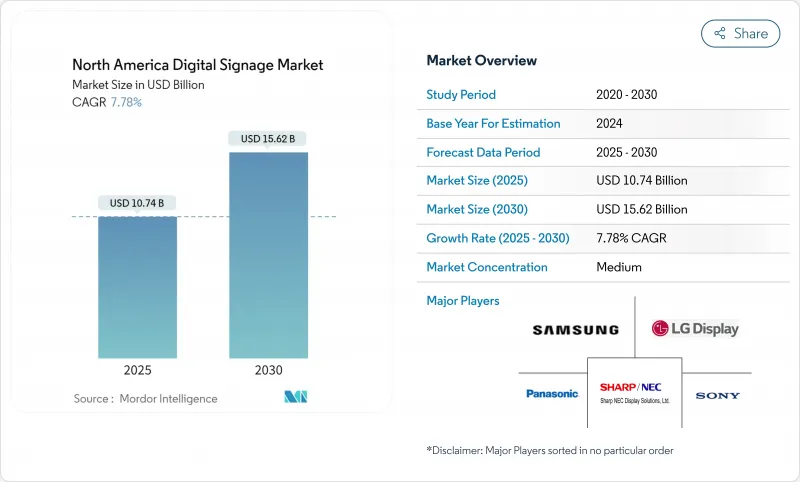
预计2025年北美数位电子看板市场规模将达到107.4亿美元,到2030年将达到156.2亿美元。
零售商店、交通枢纽和企业园区不再将萤幕视为被动的广告牌,而是将其视为数据丰富的客户参与工具。互动式格式、透明LED建筑幕墙和程式化采购正在改变收益的计算方式,而液晶面板成本的下降和「硬体+软体」捆绑优惠正吸引中小企业进入升级週期。关税变化、能源效率法规和在地化正在重塑供应商格局,但多门市品牌的持续资本投资使需求曲线保持上升趋势。
北美数位电子看板看板市场趋势与洞察
承包解决方案的进步加速了美国零售连锁店的部署
自2023年以来,整合萤幕、媒体播放机、软体、内容模板和远端监控的捆绑产品在全国范围内的推广速度加快了37%。零售集团目前正在数百家门市实现体验标准化,同时根据当地存量基准进行促销活动。采用这种模式的驱动力是订阅定价而非资本支出:60%尚未部署数位电子看板的企业计划在两年内加入。采用这种模式的连锁店报告称,参与度提升了22%,平均购物金额提升了18%,证实了其正从成本中心转变为收益驱动力。
利用行动数据的情境感知广告可提高加拿大广告商的投资报酬率
匿名行动电话讯号为内容调度人员提供即时受众预测。加拿大的一项试验研究表明,与传统户外广告相比,户外广告的投资报酬率提高了41%,零售商的参与度提高了27%,转换率提高了19%。地理围栏技术使品牌能够重新定位透过行动电话接触到的路人,将实体印象和数位后续行动整合在一起,而无需储存个人识别资讯。
基于位置的定位和脸部分析的隐私问题
美国的州级法案和加拿大的《数位宪章》正在强化知情同意规则,并迫使商家从脸部辨识转向匿名人口统计。调查显示,68%的加拿大年轻人反对在商业活动中进行人脸分析,迫使零售商在声誉风险和个人化服务效益之间做出权衡。
細項分析
2024年,硬体将占据北美数位电子看板市场份额的56.9%,其中以资本密集萤幕和媒体播放机为主。儘管硬体占据领先地位,但随着云端仪表板、人工智慧调度引擎和受众分析将买家的关注点从一次性安装转向终身价值,软体市场份额的复合年增长率仍达8.8%。订阅套餐目前占平台收益的43%,将供应商奖励与持续的内容优化相结合。硬体製造商预先提供许可证和託管服务,实现无缝采购,使零售商无需与多家供应商捆绑。
由于终端用户缺乏内部频宽来更新庞大场馆内的宣传活动,规划、布线、校准、现场维护和创新设计等服务层级正在稳步扩展。提供端到端网路管理的整合商正在赢得多年期合同,确保年金可预测,同时将故障率保持在服务水准阈值以下。最新媒体播放器内建的边缘人工智慧功能可降低频宽成本并实现局部决策,例如在安静时段静音或标记故障 LED 以便主动维修。
到2024年,LCD和传统LED将保持46.8%的市场份额,凭藉成本效益和成熟的供应链,为主流计划提供支援。目前,透明LED显示器可以在不遮挡视线的情况下打开店面橱窗,透明度超过80%,客流量也因此增加了两位数。然而,透明LED显示器以其超过80%的透光率重新定义了建筑,使零售商能够在不遮挡视线的情况下,为店面橱窗注入活力。这种形式的复合年增长率预计为11.2%,是北美数数位电子看板市场成长最快的形式,尤其是在高端零售商、汽车展示室和体验式快闪店领域。
OLED 正在进入高端市场,其近乎无限的对比度和离轴清晰度使其高昂的价格物有所值。窄像素间距 LED 用于控制室和广播场景的手持观看,而坚固耐用的投影机则用于不规则的建筑幕墙和临时活动。媒体播放机正在从被动播放盒发展为具有设备内分析功能的小型边缘伺服器,可以缓衝连接中断并保持播放完整性。
北美数位电子看板位看板市场报告按组件(硬体、软体、服务)、硬体(LCD/LED 显示器、OLED 显示器等)、安装位置(室内、室外)、显示器尺寸(32 吋以下、32-52 吋等)、安装位置(店内、店内/路边)、终端用户市场(零售、运输等)和国家/地区细分。市场预测以美元计算。
其他福利:
- Excel 格式的市场预测 (ME) 表
- 3个月的分析师支持
目录
第一章 引言
- 研究假设和市场定义
- 调查范围
第二章调查方法
第三章执行摘要
第四章 市场状况
- 市场概况
- 市场驱动因素
- 承包解决方案的进步加速了美国零售连锁店的采用
- 利用行动数据的情境感知广告为加拿大广告主带来投资报酬率
- 4K/8K电视墙整合增强了美国主要机场的体验
- 墨西哥智慧城市计画在市中心推广户外数位电子看板
- 液晶面板价格下降导致北美公司采用率上升
- 程序化 DOOH 平台可提高广告主支出和萤幕使用率
- 市场限制
- 关于基于位置的定位和脸部分析的隐私问题
- 大型显示器的能源效率法规更加严格
- 高亮度LED元件供应链不稳定
- 本地独立速食店的资本投资障碍
- 产业生态系统分析
- 分销通路分析
- 监管环境—资料隐私和环境标籤标准
- 技术简介
- 美国数位电子看板解决方案的演变
- 关键科技趋势—电视墙、4K/8K、POS、社群媒体整合
- 波特五力分析
- 新进入者的威胁
- 买方的议价能力
- 供应商的议价能力
- 替代品的威胁
- 竞争对手之间的竞争
第五章市场规模与成长预测(价值)
- 按组件
- 硬体
- 软体
- 服务
- 依硬体类型
- LCD/LED显示器
- OLED显示器
- 媒体播放机
- 投影机/投影萤幕
- 透明LED显示器
- 其他硬体
- 按位置
- 室内的
- 户外
- 按显示尺寸
- 32英吋或更小
- 32至52英寸
- 52吋或以上
- 按安装位置
- 商店内部
- 商店外/街上
- 按最终用户
- 零售
- 运输
- 饭店业
- 公司
- 教育
- 卫生保健
- 政府
- 体育和娱乐场所
- 其他最终用户
- 按国家
- 美国
- 加拿大
- 墨西哥
第六章 竞争态势
- 市场集中度
- 策略趋势
- 市占率分析
- 公司简介
- Samsung Electronics Co., Ltd.
- LG Display Co., Ltd.
- SHARP NEC Display Solutions, Ltd.
- Sony Group Corporation
- Panasonic Corporation
- Cisco Systems, Inc.
- Planar Systems, Inc.(Leyard)
- Barco NV
- Daktronics, Inc.
- BrightSign LLC
- STRATACACHE Inc.(Scala)
- Broadsign International, LLC
- Christie Digital Systems USA, Inc.
- AOPEN Inc.
- Goodview Electronics
- Hitachi, Ltd.
- Peerless-AV
- Elo Touch Solutions, Inc.
- Mvix Digital Signage
- Four Winds Interactive
第七章 市场机会与未来展望
The North America digital signage market is valued at USD 10.74 billion in 2025 and is forecast to climb to USD 15.62 billion by 2030, reflecting a steady 7.78% CAGR.
Growth comes from retailers, transportation hubs and corporate campuses that now treat screens as data-rich customer-engagement tools rather than passive billboards. Hardware still anchors most projects, yet cloud software and analytics subscriptions are expanding margins for vendors and easing roll-outs for end-users.Interactive formats, transparent LED facades and programmatic buying are reshaping return-on-investment calculations, while declining LCD panel costs and bundled "hardware-plus-software" offers are pulling small businesses into the upgrade cycle. Tariff shifts, energy-efficiency rules and localized manufacturing are redrawing supplier maps, but sustained capital spending by multi-site brands keeps the demand curve intact.
North America Digital Signage Market Trends and Insights
Evolution of Turnkey Solutions Accelerating Deployment Across U.S. Retail Chains
Bundled offerings that merge screens, media players, software, content templates and remote monitoring have shortened national roll-outs by 37% since 2023. Retail groups now standardize experiences across hundreds of stores while tailoring promotions to local inventory levels. Subscription pricing, rather than capital outlay, encourages adoption: 60% of enterprises without digital signage intend to subscribe within two years. Chains adopting this model report 22% higher engagement and 18% uplift in average basket value, confirming the pivot from cost center to revenue driver.
Context-Aware Advertising Leveraging Mobile Data Enhances ROI for Canadian Advertisers
Anonymized cellphone signals now feed real-time audience estimates into content schedulers. Canadian pilots show ROI gains of 41% over traditional out-of-home buying, plus 27% higher engagement and 19% conversion lifts in retail settings. Geofencing lets brands retarget exposed passers-by on their phones, knitting together physical impressions and digital follow-ups without storing personal identifiers.
Privacy Concerns Regarding Location-Based Targeting & Facial Analytics
State-level U.S. bills and Canada's Digital Charter are tightening consent rules, forcing vendors to shift from face recognition to anonymous demographic counts. Surveys indicate 68% of Canadian youth oppose facial analysis in commerce, prompting retailers to weigh reputational risk against personalization benefits.
Other drivers and restraints analyzed in the detailed report include:
- Integration of 4K/8K Video Walls Powers Experiential Venues in Major U.S. Airports
- Smart-City Initiatives Driving Outdoor Digital Signage Roll-outs in Mexican Urban Centers
- Rising Energy-Efficiency Regulations for Large-Format Displays
For complete list of drivers and restraints, kindly check the Table Of Contents.
Segment Analysis
Hardware captured 56.9% of North America digital signage market share in 2024, anchored by capital-intensive screens and media players. Despite this lead, the software slice is advancing at an 8.8% CAGR as cloud dashboards, AI scheduling engines and audience analytics shift buyer focus from one-time installs to lifetime value. Subscription bundles now comprise 43% of platform revenue, aligning vendor incentives with continuous content optimisation. Hardware makers increasingly pre-load licenses and managed services, creating seamless procurement and freeing retailers from juggling multiple suppliers.
The services tier-covering planning, cabling, calibration, on-site maintenance and creative design-expands steadily because end-users lack in-house bandwidth to refresh campaigns across sprawling estates. Integrators that manage networks end-to-end win multi-year contracts, locking in predictable annuities while keeping failure rates below service-level thresholds. Edge-AI features embedded in modern media players reduce bandwidth costs and enable localised decisions-such as muting audio during quiet hours or flagging malfunctioning LEDs for proactive repairs.
LCD and conventional LED kept 46.8% share in 2024, anchoring mainstream projects thanks to cost efficiency and mature supply chains. Transparent LED now unlocks storefront windows without blocking sightlines, delivering more than 80% transparency and lifting foot traffic by double-digit percentages.Their dominance secures bulk-procurement economies and simplified spares inventory. Transparent LED sheets, however, are rewriting architectural norms with over 80% light transmission, allowing retailers to animate shop windows without blocking sight-lines. Forecast 11.2% CAGR positions the format as the fastest-growing slice of North America digital signage market, particularly in luxury retail, automotive showrooms and experiential pop-ups.
OLED enters premium arenas where near-infinite contrast ratios and off-axis clarity justify higher ticket prices. Narrow pixel-pitch LEDs fill control rooms and broadcast sets that view screens at arm's length, while ruggedised projectors still serve irregular facades and temporary events. Media players graduate from passive playback boxes to miniature edge servers capable of on-device analytics, buffering against connectivity outages and preserving playback integrity.
The North America Digital Signage Market Report is Segmented by Component (Hardware, Software, Services), Hardware (LCD/LED Display, OLED Display, and More), Location (Indoor, and Outdoor), Display Size (Sub 32 Inches, 32 - 52 Inches, and More), Installation Location (In-Store, and Out-of-Store/Roadside), End-User Vertical (Retail, Transportation, and More), and Country. The Market Forecasts are Provided in Terms of Value in (USD).
List of Companies Covered in this Report:
- Samsung Electronics Co., Ltd.
- LG Display Co., Ltd.
- SHARP NEC Display Solutions, Ltd.
- Sony Group Corporation
- Panasonic Corporation
- Cisco Systems, Inc.
- Planar Systems, Inc. (Leyard)
- Barco NV
- Daktronics, Inc.
- BrightSign LLC
- STRATACACHE Inc. (Scala)
- Broadsign International, LLC
- Christie Digital Systems USA, Inc.
- AOPEN Inc.
- Goodview Electronics
- Hitachi, Ltd.
- Peerless-AV
- Elo Touch Solutions, Inc.
- Mvix Digital Signage
- Four Winds Interactive
Additional Benefits:
- The market estimate (ME) sheet in Excel format
- 3 months of analyst support
TABLE OF CONTENTS
1 INTRODUCTION
- 1.1 Study Assumptions and Market Definition
- 1.2 Scope of the Study
2 RESEARCH METHODOLOGY
3 EXECUTIVE SUMMARY
4 MARKET LANDSCAPE
- 4.1 Market Overview
- 4.2 Market Drivers
- 4.2.1 Evolution of Turnkey Solutions Accelerating Deployment Across United States Retail Chains
- 4.2.2 Context-Aware Advertising Leveraging Mobile Data Enhances ROI for Canadian Advertisers
- 4.2.3 Integration of 4K/8K Video Walls Powers Experiential Venues in Major United States Airports
- 4.2.4 Smart-City Initiatives Driving Outdoor Digital Signage Roll-outs in Mexican Urban Centers
- 4.2.5 Decline in LCD Panel Prices Expands Adoption Among SMBs Across North America
- 4.2.6 Programmatic DOOH Platforms Increasing Advertiser Spend and Screen Utilisation
- 4.3 Market Restraints
- 4.3.1 Privacy Concerns Regarding Location-Based Targeting and Facial Analytics
- 4.3.2 Rising Energy-Efficiency Regulations for Large-Format Displays
- 4.3.3 Supply-Chain Volatility for High-Brightness LED Components
- 4.3.4 Capex Barriers for Independent QSRs in Rural Areas
- 4.4 Industry Ecosystem Analysis
- 4.5 Distribution Channel Analysis
- 4.6 Regulatory Landscape - Data-Privacy and Environmental Display Standards
- 4.7 Technology Snapshot
- 4.7.1 Evolution of Digital Signage Solutions in the United States
- 4.7.2 Key Technological Trends - Video Walls, 4K/8K, POS and Social Media Integration
- 4.8 Porter's Five Forces Analysis
- 4.8.1 Threat of New Entrants
- 4.8.2 Bargaining Power of Buyers
- 4.8.3 Bargaining Power of Suppliers
- 4.8.4 Threat of Substitutes
- 4.8.5 Intensity of Competitive Rivalry
5 MARKET SIZE AND GROWTH FORECASTS (VALUES)
- 5.1 By Component
- 5.1.1 Hardware
- 5.1.2 Software
- 5.1.3 Services
- 5.2 By Hardware Type
- 5.2.1 LCD/LED Display
- 5.2.2 OLED Display
- 5.2.3 Media Players
- 5.2.4 Projectors/Projection Screens
- 5.2.5 Transparent LED Displays
- 5.2.6 Other Hardware
- 5.3 By Location
- 5.3.1 Indoor
- 5.3.2 Outdoor
- 5.4 By Display Size
- 5.4.1 Below 32 Inches
- 5.4.2 32 - 52 Inches
- 5.4.3 Above 52 Inches
- 5.5 By Installation Location
- 5.5.1 In-Store
- 5.5.2 Out-of-Store/Roadside
- 5.6 By End-user Vertical
- 5.6.1 Retail
- 5.6.2 Transportation
- 5.6.3 Hospitality
- 5.6.4 Corporate
- 5.6.5 Education
- 5.6.6 Healthcare
- 5.6.7 Government
- 5.6.8 Sports and Entertainment Venues
- 5.6.9 Other End-users
- 5.7 By Country
- 5.7.1 United States
- 5.7.2 Canada
- 5.7.3 Mexico
6 COMPETITIVE LANDSCAPE
- 6.1 Market Concentration
- 6.2 Strategic Moves
- 6.3 Market Share Analysis
- 6.4 Company Profiles (includes Global level Overview, Market level overview, Core Segments, Financials as available, Strategic Information, Market Rank/Share for key companies, Products and Services, and Recent Developments)
- 6.4.1 Samsung Electronics Co., Ltd.
- 6.4.2 LG Display Co., Ltd.
- 6.4.3 SHARP NEC Display Solutions, Ltd.
- 6.4.4 Sony Group Corporation
- 6.4.5 Panasonic Corporation
- 6.4.6 Cisco Systems, Inc.
- 6.4.7 Planar Systems, Inc. (Leyard)
- 6.4.8 Barco NV
- 6.4.9 Daktronics, Inc.
- 6.4.10 BrightSign LLC
- 6.4.11 STRATACACHE Inc. (Scala)
- 6.4.12 Broadsign International, LLC
- 6.4.13 Christie Digital Systems USA, Inc.
- 6.4.14 AOPEN Inc.
- 6.4.15 Goodview Electronics
- 6.4.16 Hitachi, Ltd.
- 6.4.17 Peerless-AV
- 6.4.18 Elo Touch Solutions, Inc.
- 6.4.19 Mvix Digital Signage
- 6.4.20 Four Winds Interactive
7 MARKET OPPORTUNITIES AND FUTURE OUTLOOK
- 7.1 White-space and Unmet-Need Assessment
 数位数位电子看板市场(按组件、类型、萤幕尺寸、解析度、位置和应用)—2025-2032 年全球预测
 2025年银行与金融数位电子看板全球市场报告全球数位电子看板市场报告(2025 年)
 数位电子看板:市场占有率分析、产业趋势、统计数据和成长预测(2025-2030 年)
 数位数位电子看板市场规模、份额、趋势分析报告:按类型、组件、技术、萤幕大小、解析度、内容类别、应用、位置、细分预测,2025-2030 年美国数位电子看板市场:市场份额分析、行业趋势、统计数据和成长预测(2025-2030 年)
 日本数位看板市场报告(按类型、组件、技术、应用、位置、规模和地区)2025-2033
 数位电子看板的全球市场:各零件,各显示器画素,显示器亮度,各显示器尺寸,各产品,各用途,安装地点,各业界,各地区,市场规模,产业动态,机会分析与预测(2025年~2033年)美国铝製标誌市场:市场规模、份额、趋势分析(按应用和最终用途)、细分市场预测(2025-2030 年)
 Frost Radar:2025年数位电子看板解决方案