


 |
市场调查报告书
商品编码
1851198
美国数位电子看板市场:市场份额分析、行业趋势、统计数据和成长预测(2025-2030 年)United States Digital Signage - Market Share Analysis, Industry Trends & Statistics, Growth Forecasts (2025 - 2030) |
||||||
※ 本网页内容可能与最新版本有所差异。详细情况请与我们联繫。
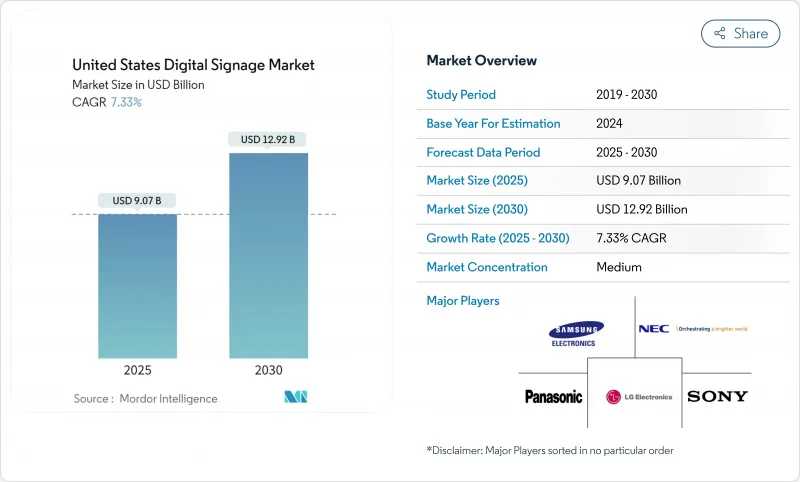
美国数位电子看板市场预计到 2025 年将达到 90.7 亿美元,到 2030 年将达到 129.2 亿美元,年复合成长率为 7.33%。
程序化购买数位户外广告 (DOOH) 库存的兴起、大型零售商的数位转型以及显示器与智慧建筑平台的融合,是推动美国数位数位电子看板市场当前扩张的三大结构性成长引擎。全国 DOOH 广告支出与更广泛的户外行业同步增长,预计到 2025 年初,户外广告行业的总收入将超过 90 亿美元,其中约三分之一的收入目前来自数位广告。虽然硬体仍然占据收入的大部分,但利润池正转向经常性软体和服务,这主要得益于绩效验证分析、基于订阅的内容管理系统和创新服务的推动。节能型 OLED、高亮度 LCD 和反射式电子纸显示器为终端用户提供了丰富的技术选择,使他们能够更精准地满足特定场所的视觉、永续性和成本目标。
美国数位电子看板市场趋势与洞察
美国户外数位广告支出激增
数位户外广告(DOOH)程序化交易平台使广告主能够近乎即时地交易广告曝光率,从而提升了静态户外媒体无法实现的衡量和归因能力。超过四分之三的受访消费者表示,他们在看到DOOH讯息后采取了行动,这增强了广告主对这种广告形式的信心。通讯业者透过一系列引人注目的收购进入了这一领域,这些收购表明,覆盖全国的光纤和5G网路不仅可以提供网路连接,还可以实现广告变现。人工智慧产生的创新迭代缩短了宣传活动的准备时间,并使内容能够根据当地天气、交通状况和受众群体进行定制,从而进一步提高了广告支出回报率。由于与联网电视采购采用相同的资料层,跨萤幕频次和覆盖范围管理正变得日益常规,这巩固了DOOH作为全通路行销关键支柱的地位。
零售业的数位转型
在美国,实体店购物仍然占据主导地位,连锁店正将展示内容嵌入过道、货架和收银台区域,以促进增量购买或与电商促销活动相配合。零售商正在重新构想门市模式,使库存、客户互动工具和视觉讯息都来自共用的即时资料湖。快餐店的数位菜单板、大型超市的无限货架自助服务终端以及杂货店的电子货架标籤,都是这一趋势的鲜明体现。南部和西部地区的早期部署已证明,促销商品能够带来收入成长,这促使其他地区加快了推广预算核准。
资料隐私和选择加入合规性障碍
一些州已颁布与《加州消费者隐私法案》类似的法规,要求场馆运作者在采集和处理生物辨识或行为资料前必须获得使用者的明确同意。例如,费城规定白天显示器亮度最高不得超过 6500 尼特,夜间不得超过 450 尼特,并强制要求配备自动调光功能。这些要求迫使系统整合商必须建立安全的资料管道、审核日誌并遵循隐私设计原则,从而增加了工程和法律成本。全国性广告商因此不得不调整宣传活动以适应各地不同的标准,从而削弱了规模经济效益。
细分市场分析
硬体部分占了64.8%的市场收入份额。服务收入预计将以8.2%的复合年增长率成长,这将重塑美国数位电子看板市场的价值获取格局。儘管硬体在2024年仍将占到近三分之二的收入,但买家越来越倾向于云端基础的内容管理、网路监控和分析,这些服务可以将一次性资本支出转化为可预测的营运成本。因此,许多製造商将显示器、媒体播放机和现场维护服务捆绑到多年订阅服务中。全国连锁店的部署表明,这些服务透过消除专案上门维护和自动更新数千块萤幕的内容,降低了整体拥有成本。
託管服务还包括创新开发、资料整合和宣传活动优化。这些功能对缺乏内部设计或IT资源但仍希望最大限度提升用户参与度的零售商、医疗保健机构和市政当局极具吸引力。人工智慧工具能够检测客流模式和人口统计数据,使服务合作伙伴能够部署与特定情境相关的播放列表,从而提高宣传活动的针对性。预计这种向服务模式的持续转变将推动美国数位数位电子看板市场走向更高利润率,并促进那些能够为全国性支持网络提供资金的公司之间的整合。
儘管液晶显示器 (LCD) 和直视型 LED 显示器仍占据 71.5% 的市场份额,但 OLED 显示器 9.9% 的复合年增长率 (CAGR) 凸显了市场对高端视觉性能的明显需求。零售旗舰店、企业大厅和高端酒店场所都将 OLED 显示器近乎无限的对比度和超宽视角视为品牌差异化的关键因素。多家美国西部财富 500 强企业的园区正在将其入口大厅的电视墙从 LED 显示器更换为拼接式 OLED 显示屏,以提升市场份额。
OLED的能源效率也符合企业的永续性计画。软式电路板使建筑师能够将显示器弯曲贴合在柱子上,或打造可固定在天花板上的条形显示屏,从而实现刚性LCD无法实现的各种设计可能性。投影技术目前仍主要应用于礼堂等小众场所,而电子纸则适用于阳光直射和电池供电的设备。 OLED製造成本的持续下降有望扩大其应用范围,并帮助该技术在美国数位电子看板市场站稳脚跟。
美国数位电子看板市场报告按组件(硬体、软体、服务)、显示技术(LCD/LED、OLED、投影、其他)、萤幕尺寸(小于 32 吋、32 吋至 52 吋、其他)、安装位置(室内、室外)、最终用户(零售、运输、酒店和快餐店、银行、金融服务和保险、教育、东北部
其他福利:
- Excel格式的市场预测(ME)表
- 3个月的分析师支持
目录
第一章 引言
- 研究假设和市场定义
- 调查范围
第二章调查方法
第三章执行摘要
第四章 市场情势
- 市场概览
- 市场驱动因素
- 美国户外数位广告支出激增
- 零售业数位转型势在必行
- 承包指示牌即服务
- 情境感知和程序化广告的成长
- 智慧建筑和指示牌网路集成
- 采用低功耗电子纸和反射式显示器
- 市场限制
- 资料隐私和选择加入合规性障碍
- 大型/互动式显示器需要高资本投入
- 中小企业内容管理的营运复杂性
- 城市对户外照明/夜间照明的规定更加严格
- 生态系分析
- 技术展望
- 波特五力分析
- 供应商的议价能力
- 买方的议价能力
- 新进入者的威胁
- 替代品的威胁
- 竞争对手之间的竞争
第五章 市场规模与成长预测
- 按组件
- 硬体
- LCD/LED显示器
- OLED显示器
- 媒体播放机
- 投影机和投影仪
- 其他硬体
- 软体
- 服务
- 硬体
- 透过显示技术
- LCD/LED
- 有机发光二极体
- 投影
- 电子纸和反光材料
- 按萤幕尺寸
- 小于 32 英寸
- 32英寸至52英寸
- 52吋或以上
- 按安装位置
- 室内的
- 户外
- 最终用户
- 零售
- 运输
- 饭店和快餐
- BFSI
- 教育
- 政府和公共机构
- 卫生保健
- 公司及商业办公室
- 娱乐和体育场馆
- 按地区
- 东北
- 中西部
- 南部
- 西
第六章 竞争情势
- 市场集中度
- 策略趋势
- 市占率分析
- 公司简介
- Samsung Electronics Co., Ltd.
- LG Display Co., Ltd.
- NEC Corporation
- Stratacache, Inc.
- Daktronics, Inc.
- Sony Group Corporation
- Panasonic Holdings Corporation
- Sharp NEC Display Solutions of America, Inc.
- Christie Digital Systems USA, Inc.
- Barco NV
- Planar Systems, Inc.
- BrightSign LLC
- Four Winds Interactive LLC
- Broadsign International, LLC
- Navori Labs SA
- Cisco Systems, Inc.
- Goodview Electronics Co., Ltd.
- Toshiba America Business Solutions, Inc.
- Peerless-AV(Peerless Industries, Inc.)
- Watchfire Signs, LLC
- Rise Vision, Inc.
第七章 市场机会与未来展望
The United States digital signage market is valued at USD 9.07 billion in 2025 and is projected to reach USD 12.92 billion by 2030, translating into a 7.33% CAGR.
Rising programmatic buying of digital-out-of-home (DOOH) inventory, large-scale retail digital transformation, and the embedding of displays into smart-building platforms are the three structural growth engines behind the current expansion of the United States digital signage market. National DOOH ad spending is scaling in tandem with the broader out-of-home sector, which crossed USD 9 billion in total revenue in early 2025 and now derives roughly one-third of that revenue from digital formats. Hardware continues to dominate revenue, yet proof-of-performance analytics, subscription-based content management systems, and creative services are shifting profit pools toward recurring software and services lines. Energy-efficient OLED, high-brightness LCD, and reflective e-paper displays give end users a widening menu of technology choices, enabling more precise alignment with venue-specific visual, sustainability, and cost objectives
United States Digital Signage Market Trends and Insights
Surge in United States DOOH Ad-Spend
DOOH programmatic exchanges now allow advertisers to trade impressions almost in real time, elevating measurability and attribution in ways previously unattainable in static outdoor media. More than three-quarters of surveyed consumers reported taking action after seeing a DOOH message, reinforcing advertiser confidence in the format. Telecommunications operators have entered the space through high-profile acquisitions, a signal that nationwide fiber and 5G networks can be monetized through advertising as well as connectivity. AI-generated creative iterations cut campaign setup times and allow content to adjust to local weather, traffic, or audience demographics, which further boosts return on ad spend. Because the same data layers power connected-TV buying, cross-screen frequency and reach management are becoming routine, solidifying DOOH as a critical pillar in omnichannel marketing.
Retail Digital-Transformation Mandates
Brick-and-mortar still captures the majority of U.S. shopping activity, prompting chains to embed displays into aisles, shelves, and checkout zones to encourage incremental purchases and to synchronize with e-commerce promotions. Retailers are re-architecting stores so that inventory, customer-relationship tools, and visual messaging all draw from a shared real-time data lake. Digital menu boards in quick-service restaurants, endless-aisle kiosks in big-box stores, and electronic shelf labels in grocery stores are visible manifestations of the same imperative: curate, inform, and transact in context. Early deployments in the South and West demonstrate revenue uplifts on promoted SKUs, which are accelerating budget approvals for rollouts across other regions.
Data-Privacy and Opt-In Compliance Hurdles
Multiple states have enacted statutes that parallel the California Consumer Privacy Act, compelling venue operators to obtain explicit consent before capturing or processing biometric and behavioral data. Municipal codes now regulate display luminance - for instance, Philadelphia limits maximum brightness to 6,500 nits by day and 450 nits at night while mandating automated dimming controls. Such requirements force integrators to embed secure data pipelines, audit logs, and privacy-by-design principles, adding both engineering and legal costs. National advertisers must subsequently tailor campaigns for a patchwork of local standards, dampening scale economies.
Other drivers and restraints analyzed in the detailed report include:
- Turnkey Signage-as-a-Service Offerings
- Context-Aware and Programmatic Advertising Growth
- High Capex for Large-Format/Interactive Displays
For complete list of drivers and restraints, kindly check the Table Of Contents.
Segment Analysis
The hardware segment accounts for 64.8% of the revenue market share. Services revenue is forecast to grow at an 8.2% CAGR, reshaping value capture inside the United States digital signage market. Although hardware generated almost two-thirds of 2024 revenue, buyers increasingly favor cloud-based content management, network monitoring, and analytics that convert one-time capital expense into predictable operating expense. Many manufacturers, therefore, bundle displays, media players, and field maintenance under multi-year subscriptions. National chain rollouts illustrate that services lower the total cost of ownership by eliminating ad-hoc truck rolls and by automating content updates across thousands of screens.
Managed services also encompass creative development, data integration, and campaign optimization. These capabilities appeal to retailers, healthcare providers, and municipalities lacking in-house design or IT resources yet seeking to maximize engagement. With AI tools detecting traffic patterns and demographics, service partners can deploy context-specific playlists that improve campaign relevance. Continued migration toward services is expected to nudge the United States digital signage market toward higher gross margin profiles, reinforcing consolidation among firms able to fund nationwide support networks.
LCD and direct-view LED continue to account for 71.5% of revenue, yet OLED's 9.9% CAGR underscores a discernible shift toward premium visual performance. Retail flagships, corporate lobbies, and high-end hospitality venues cite OLED's near-infinite contrast and ultra-wide viewing angles as brand differentiation levers. Several Fortune 500 campuses in the West region have migrated entrance lobby video walls from LED to tiled OLED canvases, evidencing wallet share gains.
OLED's energy efficiency also dovetails with corporate sustainability programs, a factor that carries weight in jurisdictions employing emissions reporting. Flexible substrates allow architects to curve displays around pillars or create ceiling-mounted ribbons, unlocking design possibilities unattainable with rigid LCD. Projection remains a niche for auditoriums, while e-paper addresses sun-facing or battery-powered assets. Continued cost declines in OLED manufacturing are anticipated to expand addressable applications, giving the technology a growing footprint within the United States digital signage market.
United States Digital Signage Market Report is Segmented by Component (Hardware, Software and Services), Display Technology (LCD/LED, OLED, Projections, and More), Screen Size (Less Than 32-Inch, 32-Inch - 52-Inch, and More), Installation Location (Indoor, and Outdoor), End User (Retail, Transportation, Hospitality and QSR, BFSI, Education, Healthcare, and More) and Geography (Northeast, Midwest, South, and West).
List of Companies Covered in this Report:
- Samsung Electronics Co., Ltd.
- LG Display Co., Ltd.
- NEC Corporation
- Stratacache, Inc.
- Daktronics, Inc.
- Sony Group Corporation
- Panasonic Holdings Corporation
- Sharp NEC Display Solutions of America, Inc.
- Christie Digital Systems USA, Inc.
- Barco NV
- Planar Systems, Inc.
- BrightSign LLC
- Four Winds Interactive LLC
- Broadsign International, LLC
- Navori Labs SA
- Cisco Systems, Inc.
- Goodview Electronics Co., Ltd.
- Toshiba America Business Solutions, Inc.
- Peerless-AV (Peerless Industries, Inc.)
- Watchfire Signs, LLC
- Rise Vision, Inc.
Additional Benefits:
- The market estimate (ME) sheet in Excel format
- 3 months of analyst support
TABLE OF CONTENTS
1 INTRODUCTION
- 1.1 Study Assumptions and Market Definition
- 1.2 Scope of the Study
2 RESEARCH METHODOLOGY
3 EXECUTIVE SUMMARY
4 MARKET LANDSCAPE
- 4.1 Market Overview
- 4.2 Market Drivers
- 4.2.1 Surge in United States DOOH ad-spend
- 4.2.2 Retail digital-transformation mandates
- 4.2.3 Turnkey signage-as-a-service offerings
- 4.2.4 Context-aware and programmatic advertising growth
- 4.2.5 Smart-building integration with signage networks
- 4.2.6 Low-power e-paper and reflective displays adoption
- 4.3 Market Restraints
- 4.3.1 Data-privacy and opt-in compliance hurdles
- 4.3.2 High capex for large-format/interactive displays
- 4.3.3 Operational complexity for SME content management
- 4.3.4 Stricter city ordinances on outdoor brightness/curfews
- 4.4 Industry Ecosystem Analysis
- 4.5 Technological Outlook
- 4.6 Porter's Five Forces Analysis
- 4.6.1 Bargaining Power of Suppliers
- 4.6.2 Bargaining Power of Buyers
- 4.6.3 Threat of New Entrants
- 4.6.4 Threat of Substitutes
- 4.6.5 Intensity of Competitive Rivalry
5 MARKET SIZE AND GROWTH FORECASTS (VALUES)
- 5.1 By Component
- 5.1.1 Hardware
- 5.1.1.1 LCD/LED Displays
- 5.1.1.2 OLED Displays
- 5.1.1.3 Media Players
- 5.1.1.4 Projection Screens and Projectors
- 5.1.1.5 Other Hardware
- 5.1.2 Software
- 5.1.3 Services
- 5.1.1 Hardware
- 5.2 By Display Technology
- 5.2.1 LCD/LED
- 5.2.2 OLED
- 5.2.3 Projection
- 5.2.4 e-Paper and Reflective
- 5.3 By Screen Size
- 5.3.1 Less than 32-inch
- 5.3.2 32-inch to 52-inch
- 5.3.3 Greater than 52-inch
- 5.4 By Installation Location
- 5.4.1 Indoor
- 5.4.2 Outdoor
- 5.5 By End User
- 5.5.1 Retail
- 5.5.2 Transportation
- 5.5.3 Hospitality and QSR
- 5.5.4 BFSI
- 5.5.5 Education
- 5.5.6 Government and Public Institutions
- 5.5.7 Healthcare
- 5.5.8 Corporate and Commercial Offices
- 5.5.9 Entertainment and Sports Venues
- 5.6 By Geography
- 5.6.1 Northeast
- 5.6.2 Midwest
- 5.6.3 South
- 5.6.4 West
6 COMPETITIVE LANDSCAPE
- 6.1 Market Concentration
- 6.2 Strategic Moves
- 6.3 Market Share Analysis
- 6.4 Company Profiles (includes Global level Overview, Market level overview, Core Segments, Financials as available, Strategic Information, Market Rank/Share, Products and Services, Recent Developments)
- 6.4.1 Samsung Electronics Co., Ltd.
- 6.4.2 LG Display Co., Ltd.
- 6.4.3 NEC Corporation
- 6.4.4 Stratacache, Inc.
- 6.4.5 Daktronics, Inc.
- 6.4.6 Sony Group Corporation
- 6.4.7 Panasonic Holdings Corporation
- 6.4.8 Sharp NEC Display Solutions of America, Inc.
- 6.4.9 Christie Digital Systems USA, Inc.
- 6.4.10 Barco NV
- 6.4.11 Planar Systems, Inc.
- 6.4.12 BrightSign LLC
- 6.4.13 Four Winds Interactive LLC
- 6.4.14 Broadsign International, LLC
- 6.4.15 Navori Labs SA
- 6.4.16 Cisco Systems, Inc.
- 6.4.17 Goodview Electronics Co., Ltd.
- 6.4.18 Toshiba America Business Solutions, Inc.
- 6.4.19 Peerless-AV (Peerless Industries, Inc.)
- 6.4.20 Watchfire Signs, LLC
- 6.4.21 Rise Vision, Inc.
7 MARKET OPPORTUNITIES AND FUTURE OUTLOOK
- 7.1 White-space and Unmet-need Assessment
 数位电子看板:市场占有率分析、产业趋势与统计、成长预测(2026-2031)
 数位电子看板市场规模、份额、趋势及预测(按类型、组件、技术、应用、位置、规模和地区划分),2026-2034年
 2026年全球数位侧窗显示器市场报告
 2026-2030年全球数位电子看板市场
 商用大型指示牌市场按技术、安装方式、萤幕大小、触控功能和应用划分-全球预测(2026-2032 年)投影数位电子看板看板市场:按组件、连接方式、安装类型、显示类型、应用和最终用户划分,全球预测,2026-2032年织物标牌市场:按织物类型、印刷技术、应用、终端用户产业和分销管道划分-2026-2032年全球预测欧洲数位电子看板市场:市场占有率分析、产业趋势与统计、成长预测(2026-2031)
 工业显示系统市场规模、份额和成长分析(按显示类型、面板尺寸、技术/功能、最终用途产业和地区划分)-2026-2033年产业预测
 数位看板市场按类型、应用、最终用户产业、国家及地区划分-全球产业分析、市场规模、市场占有率及2025-2032年预测