


 |
市场调查报告书
商品编码
1906995
印尼太阳能市场:市场占有率分析、产业趋势与统计、成长预测(2026-2031)Indonesia Solar Energy - Market Share Analysis, Industry Trends & Statistics, Growth Forecasts (2026 - 2031) |
||||||
※ 本网页内容可能与最新版本有所差异。详细情况请与我们联繫。
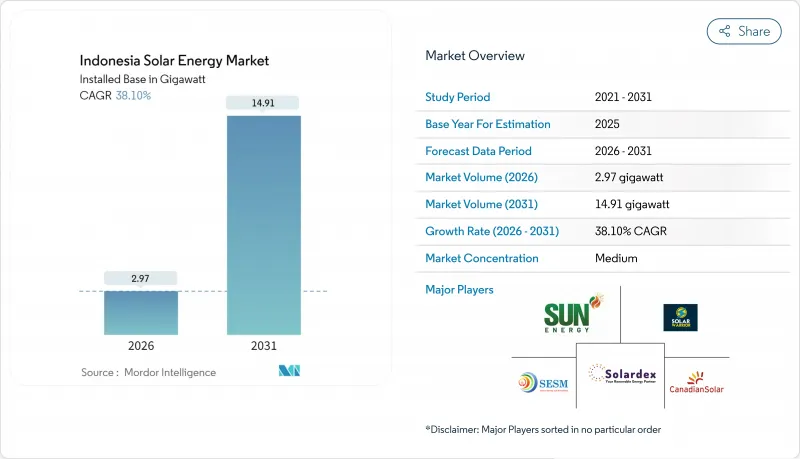
预计印尼太阳能市场将从 2025 年的 2.15 吉瓦成长到 2026 年的 2.97 吉瓦,到 2031 年达到 14.91 吉瓦,2026 年至 2031 年的复合年增长率为 38.10%。
这一成长轨迹得益于雅加达政府削减柴油补贴、政策转向大规模太阳能发电和分散式太阳能发电系统、推出5746吉瓦屋顶太阳能发电框架,以及印尼国家电力公司(PLN)承诺在其2025-2034年电力供应计画(RUPTL)中安装17.1吉瓦太阳能发电。这些因素表明,资本正从燃煤发电领域进行决定性重新配置。到了2024年,组件平均售价下降约50%,运输成本也趋于正常化。印尼的EPC竞标也始终满足PLN每千瓦时1200印尼币的电价上限,使得印尼阳光充足的省份的太阳能市场价格低于市电平价。随着爪哇岛和巴淡岛的RE100製造商签署了为期20年的屋顶光伏发电合同,企业可再生能源购电协议(RE-PPA)数量激增。这些合约保证了范围2的排放排量和长期的价格稳定。儘管面临电网吸收能力和外汇风险,但大型开发商仍受到207吉瓦技术潜力、200亿美元的爪哇-东帝汶电力计划(JETP)承诺以及2022年第112号总统令下监管规定的吸引,计划在爪哇岛、苏门答腊岛和苏拉威西岛外汇计划。
印尼太阳能市场趋势与洞察
政府屋顶奖励加速去中心化应用
能源和矿产资源部 (MEMR) 第 2/2024 号条例终止了净计量电价机制,并以 5.746 吉瓦的配额制取代。该条例明确了併网规则,保障了印尼国家电力公司 (PLN) 的收入,同时保留了商业系统的税收优惠。雅加达省长第 38/2024 号法令强制要求新建面积超过 500 平方公尺的商业建筑安装屋顶太阳能光电系统。该法令同样适用于西爪哇和峇里岛。配额制与此相结合,建构了一个透明的能源供应管道,为开发商提供了清晰的商业前景,直至 2028 年。该制度限制了剩余发电量的配额上限,并鼓励居民自用,同时允许建造能够吸收白天发电量的大规模商业设施。开发商正在加快设计进度,以便儘早锁定配额,他们预计在 2027 年住宅市场重新开放时,监管框架将会更加严格。同时,地方政府的处罚和许可奖励正在加强合规性,从而扩大印尼人口稠密都市区的太阳能市场。
组件平均售价下降导致平准化能源成本低于市电平价。
多晶硅现货价格从2023年的每公斤30美元跌至2024年第四季的每公斤8美元,晶体硅组件的平均售价(ASP)也因此减半。这使得印尼国家电力公司(PLN)近期竞标中的EPC竞标低至每印尼币1050印尼盾。标准化的运费进一步降低了中国一级组件的到岸成本15-20%,使得东努沙登加拉和南加里曼丹的平准化度电成本(LCOE)低于燃煤发电的基准水准。为此,开发商提交的提案电协议(PPA)数量已超过PLN计画在2025-2034年间实现的17.1吉瓦太阳能装置容量。然而,由于製造商持续清理高成本库存,利润率压力仍然存在,迫使印尼企业对冲订单时间风险。根据期货曲线,如果中国工厂的运转率维持在每年 600 吉瓦以上,预计到 2026 年,印尼的太阳能市场将受益于低于 70 美元/千瓦时的收费系统。
强制性国内贸易往来(TKDN)可改善计划经济效益。
儘管印尼能源和矿产资源部 (MEMR) 第 191/2024 号法令将国内可转换配额 (TKDN) 门槛降低至 20%,但由于国内多晶硅和晶圆工厂数量不足,开发商仍面临 12% 至 18% 的更高工程总承包 (EPC) 成本。 PT Len Industri 公司的 600MW 生产线仍是唯一符合规定的主要供应来源,但交货週期长达九个月。这迫使公用事业规模的开发商重新谈判购电协议 (PPA) 的时间表,或接受部分进口罚款。印尼国家电力公司 (PLN) 仍然不愿提高关税,导致利润空间压缩,并波及整个供应链。目前,一些独立发电商 (IPP) 正在从国内供应商批量采购系统平衡设备,以超过 20% 的阈值,但审核可能会使商业营运证书的发放延迟长达 90 天。除非新的吉瓦级工厂在 2027 年前开始商业运营,否则 TKDN 规则将继续阻碍印尼太阳能市场的发展。
细分市场分析
预计到2025年,太阳能光电发电将占印尼太阳能市场的100%,并在2031年之前以38.10%的复合年增长率成长。由于印尼大部分地区的太阳辐射量(直接法向辐射,DNI)仅为1400-1600千瓦时/平方米,远低于商业性太阳热能发电(CSP)保持竞争力所需的2000千瓦时/平方米的阈值,因此CSP在商业上仍然不可行。由于CSP的高成本4000-6000美元/千瓦,而光伏发电的成本仅为800-1200美元/千瓦,投资者正将资金集中投入晶体硅组件。在土地资源有限的爪哇岛,开发商为了提高10-15%的发电量,预计到2024年,双面组件和拓普康(TOPCon)组件将占进口总量的60%。儘管价格受到压缩,但符合 IEC 61215 和 IEC 61730 标准保证了融资可行性,进一步巩固了光伏发电在印尼太阳能市场的主导地位。
第二代电池技术透过在固定配额下降低额定功率输出,加速了发电成长并降低了弃光风险。隆基和天合光能预计在2024年分别交付超过500兆瓦的双面组件,主要用于浮体式太阳能电站和柴油热电联产专案。随着组件能量密度的提高,开发商预计到2027年,土地需求将减少7%,这将有助于降低爪哇岛农村地区的社区接受度,同时也将提高计划的内部收益率(IRR)。
印尼太阳能市场报告按技术(光伏和聚光型太阳热能发电)、併网类型(併网和离网)以及最终用户(大型企业、商业/工业和住宅)进行细分。市场规模和预测以装置容量(吉瓦)为单位。
其他福利:
- Excel格式的市场预测(ME)表
- 3个月的分析师支持
目录
第一章 引言
- 研究假设和市场定义
- 调查范围
第二章调查方法
第三章执行摘要
第四章 市场情势
- 市场概览
- 市场驱动因素
- 加强政府对屋顶净计量电价的奖励措施(2023年)
- 全球模组平均售价(ASP)和运输成本下降
- RE100成员製造商对企业可再生能源购电协议的需求
- 在离岛上改用柴油混合动力发电可以减轻PLN的补贴负担。
- 雅加达及各省的屋顶安装义务法规
- 苏拉威西镍冶炼厂的自发电需求
- 市场限制
- 40% 国内贸易经销 (TKDN) 法规推高成本
- 电网吸收配额和输出削减风险
- 缺乏国家对浮体式太阳能购电协议的担保
- 独立发电公司印尼盾兑外汇对冲成本上升
- 供应链分析
- 监管环境
- 技术展望
- 波特五力模型
- 新进入者的威胁
- 供应商的议价能力
- 买方的议价能力
- 替代品的威胁
- 产业间竞争
- PESTEL 分析
第五章 市场规模与成长预测
- 透过技术
- 光伏(PV)
- 聚光型太阳热能发电(CSP)
- 按网格类型
- 併网
- 离网
- 最终用户
- 实用规模
- 商业和工业(C&I)
- 住宅
- 按成分(定性分析)
- 光学模组/面板
- 逆变器(组串式、集中式、微型)
- 安装和追踪系统
- 系统周边设备和电气设备
- 储能和混合整合
第六章 竞争情势
- 市场集中度
- 策略性倡议(併购、伙伴关係、购电协议)
- 市场占有率分析(主要企业的市场排名和份额)
- 公司简介
- PT Surya Utama Nuansa(SUN Energy)
- PT TotalEnergies Eren Indonesia
- PT Sumber Energi Sukses Makmur(SES)
- PT Sumber Energi Surya Nusantara(SESNA)
- PT Solardex Energy Indonesia
- Canadian Solar Inc.
- Trina Solar Co. Ltd.
- LONGi Green Energy Technology Co. Ltd.
- First Solar Inc.
- JA Solar Technology Co. Ltd.
- Risen Energy Co. Ltd.
- PT Len Industri(Persero)
- PT PLN Nusantara Power
- Akuo Energy Indonesia
- ACWA Power Indonesia
- Vena Energy Indonesia
- Masdar Indonesia
- PT Xurya Daya Indonesia
- Enernet Global Indonesia
第七章 市场机会与未来展望
The Indonesia Solar Energy Market is expected to grow from 2.15 gigawatt in 2025 to 2.97 gigawatt in 2026 and is forecast to reach 14.91 gigawatt by 2031 at 38.10% CAGR over 2026-2031.
Jakarta's pivot from diesel subsidies toward grid-scale and distributed photovoltaic systems, the 5.746 GW rooftop quota framework, and PLN's commitment to 17.1 GW of solar capacity in its RUPTL 2025-2034 blueprint, together underpin this growth trajectory, signaling a decisive reallocation of capital away from coal baseload. Module average selling prices fell nearly 50% during 2024, shipping costs normalized, and Indonesian EPC bidders routinely met PLN's ceiling tariff of IDR 1,200 per kWh, which pushed the Indonesian solar energy market below grid-parity levels in high-irradiance provinces. Corporate renewable-power purchase agreements (RE-PPAs) surged as RE100 manufacturers in Java and Batam locked in twenty-year rooftop contracts that guarantee Scope 2 abatement and long-term price certainty. Utility-scale developers attracted by the archipelago's 207 GW technical potential, the USD 20 billion JETP commitment, and regulatory clarity under Presidential Regulation 112/2022 are queueing projects in Java, Sumatra, and Sulawesi despite grid-absorption quotas and foreign-exchange risks.
Indonesia Solar Energy Market Trends and Insights
Government Rooftop Incentives Accelerate Distributed Adoption
MEMR Regulation 2/2024 ended net-metering and replaced it with a 5.746 GW quota, clarifying interconnection rules and protecting PLN revenues while sustaining tax allowances for commercial systems. Jakarta's Governor Regulation 38/2024 now obliges the installation of rooftop solar on new commercial buildings exceeding 500 m2, a mandate mirrored in West Java and Bali. Together with the quota, this delivers a transparent pipeline that boosts developer visibility until 2028. The mechanism caps excess-generation credits, steering households toward self-consumption yet unlocking larger corporate installations that can absorb daytime output. Developers have accelerated engineering timelines to secure quota allocations early, anticipating tighter windows once the residential segment restarts in 2027. At the same time, municipal fines and permitting incentives ensure higher compliance, thereby expanding the Indonesian solar energy market in densely populated urban districts.
Module ASP Declines Compress Levelized Costs Below Grid Parity
Polysilicon spot prices declined from USD 30/kg in 2023 to USD 8/kg by Q4 2024, halving crystalline-silicon module ASPs and enabling EPC bids as low as IDR 1,050 per kWh in recent PLN tenders. Normalized freight rates shaved another 15-20% off landed costs for Chinese Tier-1 modules, pushing levelized electricity costs beneath coal benchmarks in East Nusa Tenggara and South Kalimantan. Developers responded by lodging unsolicited PPA proposals that already exceed PLN's 17.1 GW solar allocation for 2025-2034. Yet margin pressure remains as manufacturers offload high-priced inventory, compelling Indonesian firms to hedge order timing. Forward curves indicate that if Chinese factory utilization stays above 600 GW annually, the Indonesian solar energy market will benefit from sub-USD 0.07 kWh tariffs through 2026.
TKDN Local-Content Mandate Elevates Project Economics
MEMR Decree 191/2024 trimmed the TKDN threshold to 20%, yet developers still face 12-18% higher EPC costs because Indonesia lacks polysilicon and wafer plants, leaving PT Len Industri's 600 MW line as the chief compliant source. Queue times stretch to nine months, compelling utility-scale sponsors to renegotiate PPA schedules or accept partial-import penalties. PLN remains reluctant to uplift tariffs, forcing margin compression that cascades through the supply chain. Several IPPs now bundle balance-of-system gear from domestic suppliers to surpass the 20% threshold, although audits can delay commercial-operation certificates by up to 90 days. Unless new gigawatt-scale factories reach commercial operation before 2027, the TKDN rule will continue to hinder the Indonesian solar energy market.
Other drivers and restraints analyzed in the detailed report include:
- RE100 Corporate Commitments Drive C&I PPA Volume
- Diesel Displacement in Eastern Archipelago Eases Fiscal Strain
- Grid-Absorption Constraints Trigger Curtailment Incidents
For complete list of drivers and restraints, kindly check the Table Of Contents.
Segment Analysis
Solar PV accounted for 100.00% of the Indonesian solar energy market size in 2025 and is forecast to advance at a 38.10% CAGR through 2031. CSP remains commercially unviable because most Indonesian sites record 1,400-1,600 kWh/m2 DNI, which is well below the 2,000 kWh/m2 threshold that CSP needs to remain competitive. PV capex of USD 800-1,200 kW undercuts CSP's USD 4,000-6,000 kW, so investors concentrate capital on crystalline-silicon routes. Bifacial and TOPCon modules captured 60% of 2024 imports as developers chase 10-15% yield gains in land-constrained Java. Compliance with IEC 61215 and IEC 61730 standards upholds bankability despite price compression, further reinforcing PV's exclusive status in the Indonesian solar energy market.
Second-generation cell technologies accelerate yield improvements, mitigating curtailment risks by enabling lower nameplate sizing for fixed quotas. LONGi and Trina each delivered over 500 MW of bifacial shipments in 2024, primarily for floating PV and hybrid diesel sites. As module energy density rises, developers forecast a 7% drop in land requirements by 2027, alleviating community-acceptance barriers in peri-urban Java while bolstering project IRRs.
The Indonesia Solar Energy Market Report is Segmented by Technology (Solar Photovoltaic and Concentrated Solar Power), Grid Type (On-Grid and Off-Grid), and End-User (Utility-Scale, Commercial and Industrial, and Residential). The Market Sizes and Forecasts are Provided in Terms of Installed Capacity (GW).
List of Companies Covered in this Report:
- PT Surya Utama Nuansa (SUN Energy)
- PT TotalEnergies Eren Indonesia
- PT Sumber Energi Sukses Makmur (SES)
- PT Sumber Energi Surya Nusantara (SESNA)
- PT Solardex Energy Indonesia
- Canadian Solar Inc.
- Trina Solar Co. Ltd.
- LONGi Green Energy Technology Co. Ltd.
- First Solar Inc.
- JA Solar Technology Co. Ltd.
- Risen Energy Co. Ltd.
- PT Len Industri (Persero)
- PT PLN Nusantara Power
- Akuo Energy Indonesia
- ACWA Power Indonesia
- Vena Energy Indonesia
- Masdar Indonesia
- PT Xurya Daya Indonesia
- Enernet Global Indonesia
Additional Benefits:
- The market estimate (ME) sheet in Excel format
- 3 months of analyst support
TABLE OF CONTENTS
1 Introduction
- 1.1 Study Assumptions & Market Definition
- 1.2 Scope of the Study
2 Research Methodology
3 Executive Summary
4 Market Landscape
- 4.1 Market Overview
- 4.2 Market Drivers
- 4.2.1 Government rooftop-net-metering incentives strengthened (2023)
- 4.2.2 Declining global module ASPs and shipping costs
- 4.2.3 Corporate RE-PPA demand from RE100 manufacturers
- 4.2.4 Diesel-hybrid swaps on remote islands cut PLN subsidy burden
- 4.2.5 Jakarta & provincial mandatory-rooftop by-laws
- 4.2.6 Sulawesi nickel-smelter self-generation requirement
- 4.3 Market Restraints
- 4.3.1 40 % TKDN local-content rule inflates costs
- 4.3.2 Grid-absorption quota & curtailment risk
- 4.3.3 Lack of sovereign guarantee for floating-PV PPAs
- 4.3.4 High IDR-FX hedging costs for IPPs
- 4.4 Supply-Chain Analysis
- 4.5 Regulatory Landscape
- 4.6 Technological Outlook
- 4.7 Porters Five Forces
- 4.7.1 Threat of New Entrants
- 4.7.2 Bargaining Power of Suppliers
- 4.7.3 Bargaining Power of Buyers
- 4.7.4 Threat of Substitutes
- 4.7.5 Industry Rivalry
- 4.8 PESTLE Analysis
5 Market Size & Growth Forecasts
- 5.1 By Technology
- 5.1.1 Solar Photovoltaic (PV)
- 5.1.2 Concentrated Solar Power (CSP)
- 5.2 By Grid Type
- 5.2.1 On-Grid
- 5.2.2 Off-Grid
- 5.3 By End-User
- 5.3.1 Utility-Scale
- 5.3.2 Commercial and Industrial (C&I)
- 5.3.3 Residential
- 5.4 By Component (Qualitative Analysis)
- 5.4.1 Solar Modules/Panels
- 5.4.2 Inverters (String, Central, Micro)
- 5.4.3 Mounting and Tracking Systems
- 5.4.4 Balance-of-System and Electricals
- 5.4.5 Energy Storage and Hybrid Integration
6 Competitive Landscape
- 6.1 Market Concentration
- 6.2 Strategic Moves (M&A, Partnerships, PPAs)
- 6.3 Market Share Analysis (Market Rank/Share for key companies)
- 6.4 Company Profiles (includes Global level Overview, Market level overview, Core Segments, Financials as available, Strategic Information, Products & Services, and Recent Developments)
- 6.4.1 PT Surya Utama Nuansa (SUN Energy)
- 6.4.2 PT TotalEnergies Eren Indonesia
- 6.4.3 PT Sumber Energi Sukses Makmur (SES)
- 6.4.4 PT Sumber Energi Surya Nusantara (SESNA)
- 6.4.5 PT Solardex Energy Indonesia
- 6.4.6 Canadian Solar Inc.
- 6.4.7 Trina Solar Co. Ltd.
- 6.4.8 LONGi Green Energy Technology Co. Ltd.
- 6.4.9 First Solar Inc.
- 6.4.10 JA Solar Technology Co. Ltd.
- 6.4.11 Risen Energy Co. Ltd.
- 6.4.12 PT Len Industri (Persero)
- 6.4.13 PT PLN Nusantara Power
- 6.4.14 Akuo Energy Indonesia
- 6.4.15 ACWA Power Indonesia
- 6.4.16 Vena Energy Indonesia
- 6.4.17 Masdar Indonesia
- 6.4.18 PT Xurya Daya Indonesia
- 6.4.19 Enernet Global Indonesia
7 Market Opportunities & Future Outlook
- 7.1 White-space & Unmet-Need Assessment
 太阳能发电系统市场:2026-2032年全球市场预测(依产品、系统规模、安装类型及应用划分)
 2026年全球太阳能市场报告
 太阳能发电系统市场分析及预测(至2035年):依类型、产品类型、服务、技术、组件、应用、安装类型、最终用户、功能及设备划分
 东南亚太阳能:市场占有率分析、产业趋势与统计、成长预测(2026-2031)泰国太阳能:市场占有率分析、产业趋势与统计、成长预测(2026-2031)西班牙太阳能:市场份额分析、行业趋势和统计数据、成长预测(2026-2031 年)越南太阳能市场:市场占有率分析、产业趋势与统计、成长预测(2026-2031年)
 太阳能解决方案市场 - 全球产业规模、份额、趋势、机会及预测(按类型、应用、地区和竞争格局划分,2021-2031年)义大利太阳能市场:市场占有率分析、产业趋势与统计、成长预测(2026-2031)菲律宾太阳能市场:市场占有率分析、产业趋势与统计、成长预测(2026-2031年)