


 |
市场调查报告书
商品编码
1911343
印尼润滑油市场:市场占有率分析、产业趋势、统计数据和成长预测(2026-2031年)Indonesia Lubricants - Market Share Analysis, Industry Trends & Statistics, Growth Forecasts (2026 - 2031) |
||||||
※ 本网页内容可能与最新版本有所差异。详细情况请与我们联繫。
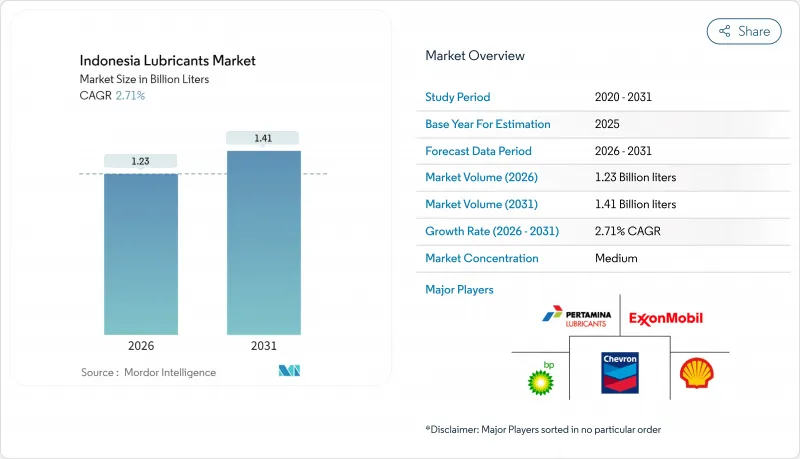
2025年印尼润滑油市场价值为12亿公升,预计到2031年将达到14.1亿公升,而2026年为12.3亿公升,预测期(2026-2031年)复合年增长率为2.71%。
即便电动车政策即将出台,印尼市场对润滑油的需求依然强劲,这反映了印尼工业的稳定扩张、完善的基础设施规划以及庞大的汽车保有量。虽然矿物油产品仍占总销售量的三分之二,但随着车队营运商寻求更低的生命週期营运成本,延长换油週期的趋势日益明显,高端合成油的市场需求也加速成长。从壳牌新建的润滑脂工厂到埃克森美孚的现场MACHINEXT服务,跨国公司的产能扩张充分展现了技术、在地化生产和分销网络如何塑造竞争优势。同时,强制性的SNI认证、B40生物柴油的引入以及原油价格的波动加剧了成本压力,促使企业升级产品系列,转向防腐蚀添加剂和生物基混合油。印尼拥有17,000个岛屿,供应链的复杂性带来了物流方面的挑战,尤其是在为偏远地区的高价值采矿和工业应用提供润滑油方面。
印尼润滑油市场趋势及洞察
汽车拥有量不断增加
印尼汽车产业的蓬勃发展正推动润滑油消费,这主要得益于乘用车数量的成长以及物流网路中商用车辆车队的现代化。根据国际汽车製造商协会(OICA)预测,印尼2024年的汽车产量将达到119万辆。自动挡摩托车的普及催生了对专用于自动挡应用的润滑油配方的需求。电子商务的扩张和「最后一公里」配送的盛行提高了车辆运转率,导致润滑油更换频率高于传统消费模式。政府大力推广电动车,并计划在2040年前逐步淘汰内燃机,这在一定程度上限制了汽车润滑油需求的成长。区域分销网络难以有效服务印尼的离岛岛屿,造成供应瓶颈,阻碍了新兴汽车丛集的市场渗透。
工业和製造业的快速成长
印尼製造业的蓬勃发展与金属加工、发电和重型机械应用领域工业润滑油消费量的成长直接相关。作为全球最大的镍生产国,印尼进一步扩大了冶炼过程中对特殊金属加工液和液压系统润滑油的需求。製造业投资催生了新的工业基础设施,需要初始润滑油加註和持续的维护保养。埃克森美孚于2024年6月推出的MACHINEXT原位润滑管理技术,展示了数位化优化如何延长设备使用寿命并降低整体拥有成本。虽然製造业集中在爪哇岛带来了物流优势,但也限制了资源丰富的周边地区的成长潜力,这些地区的基础建设落后于工业投资。
宏观经济和商品价格波动抑制了产能运转率。
受宏观经济不确定性和商品价格波动的影响,印尼润滑油产业面临产能运转率挑战,抑制了工业活动和消费支出。目前,印尼国内润滑油产业的运转率约为60%。全球供应链中断和汇率波动影响基础油进口成本,迫使製造商调整定价策略并考虑其对需求弹性的影响。棕榈油和采矿等出口依赖型产业会经历週期性衰退,导致商品价格疲软时期工业润滑油消费量下降。製造业产能集中在爪哇岛,造成区域发展不平衡,外岛企业在经济动盪时期难以确保供应链的可靠性。强制性SNI标准下的监管合规成本增加了中小企业在利润率压缩时期难以承受的营运成本。
细分市场分析
到2025年,汽车机油将占印尼润滑油市场份额的35.80%,这反映了印尼以车辆为中心的润滑油消费模式以及内燃机在乘用车和商用车领域的主导地位。液压油将成为成长最快的产品类型,2026年至2031年的复合年增长率将达到3.51%,这主要得益于基础建设和采矿设备的发展,这些领域对高性能液压系统的需求日益增长。工业机油应用于发电和船舶领域,而变速箱油则受益于摩托车行业自动变速箱的日益普及。齿轮油为印尼的重型和工业机械提供支持,尤其是在加里曼丹和苏拉威西的采矿作业中。
加工处理油,包括橡胶加工油和白油,供应印尼的轮胎製造和石化业;金属加工油则支持该国不断扩张的製造业。涡轮机油和变压器油用于发电基础设施,而润滑脂则广泛应用于各种领域,从汽车底盘润滑到工业轴承系统。产品组合正朝着专业配方方向发展,这反映了印尼工业日益复杂化以及原始设备製造商(OEM)规格的影响力不断增强,这些规格要求使用符合API、JASO和ACEA等国际标准的高性能润滑油。
印尼润滑油市场报告按产品类型(汽车引擎油、工业引擎油、变速箱油、齿轮油、煞车油、液压油、润滑脂等)、终端用户产业(汽车、船舶、航太、重型机械、工业)和基础油类型(矿物油、合成油、半合成油、生物基油)进行细分。市场预测以公升为单位。
其他福利:
- Excel格式的市场预测(ME)表
- 3个月的分析师支持
目录
第一章 引言
- 研究假设和市场定义
- 调查范围
第二章调查方法
第三章执行摘要
第四章 市场情势
- 市场概览
- 市场驱动因素
- 汽车拥有量不断增长的趋势
- 工业和製造业的快速成长
- 全国基础设施建设和蓬勃发展的采矿活动
- 船舶和渔船队的现代化
- 生物柴油相关润滑油污染推动了对优质添加剂的需求
- 市场限制
- 宏观经济和商品价格波动限制了产能运转率。
- 延长合成机油更换週期可降低每辆车的机油消耗量。
- 油价波动正在挤压利润空间,并影响对价格敏感的买家。
- 价值链分析
- 法律规范
- 终端用户趋势
- 汽车产业
- 製造业
- 发电业
- 波特五力模型
- 供应商的议价能力
- 买方的议价能力
- 新进入者的威胁
- 替代品的威胁
- 竞争程度
第五章 市场规模与成长预测
- 依产品类型
- 汽车引擎油
- 工业机油
- 变速箱油
- 齿轮油
- 煞车油
- 油压
- 润滑脂
- 加工油(包括橡胶加工油和白油)
- 金属加工油
- 涡轮机油
- 变压器油
- 其他产品类型
- 按最终用户行业划分
- 车
- 搭乘用车
- 商用车辆
- 摩托车
- 船
- 航太
- 重型机械
- 建造
- 矿业
- 农业
- 工业的
- 发电
- 冶金/金属加工
- 纺织业
- 石油和天然气
- 其他终端用户产业
- 车
- 依基础油类型
- 矿物油性润滑剂
- 合成润滑油
- 半合成润滑油
- 生物性润滑剂
第六章 竞争情势
- 市场集中度
- 策略趋势
- 市占率(%)/排名分析
- 公司简介
- BP Plc(Castrol)
- Chevron Corporation
- Exxon Mobil Corporation
- FUCHS
- Gulf Oil International Ltd
- Idemitsu Kosan Co., Ltd.
- PETRONAS Lubricants International
- PT Pertamina Lubricants
- PT Wiraswasta Gemilang Indonesia
- Shell plc
- The Lubrizol Corporation
- TOP 1 Oil Products Company
- TotalEnergies
第七章 市场机会与未来展望
第八章:执行长面临的关键策略挑战
The Indonesian Lubricants Market was valued at 1.20 billion liters in 2025 and estimated to grow from 1.23 billion liters in 2026 to reach 1.41 billion liters by 2031, at a CAGR of 2.71% during the forecast period (2026-2031).
Demand continues to track Indonesia's steady industrial expansion, resolute infrastructure pipeline, and resilient vehicle parc, even as electric-mobility policies loom. Mineral-oil products still account for two-thirds of volume, yet the premium shift to synthetics accelerates because extended drain intervals appeal to fleet operators seeking lower lifetime operating costs. Capacity additions by multinationals-from Shell's new grease plant to ExxonMobil's on-site MACHINEXT service-underline how technology, localized production, and distribution reach shape competitive advantage. Meanwhile, mandatory SNI certification, B40 biodiesel adoption, and volatile crude prices intensify cost pressures, prompting portfolio upgrades toward anti-corrosion additives and bio-based blends. Supply-chain complexity across 17,000 islands creates logistical challenges, particularly for reaching high-value mining and industrial applications in outer regions.
Indonesia Lubricants Market Trends and Insights
Growing Automotive Parc Expansion
Indonesia's expanding automotive sector drives lubricant consumption through both passenger vehicle growth and commercial fleet modernization across the archipelago's logistics networks. According to the International Organization of Motor Vehicle Manufacturers (OICA), the country produced 1.19 million vehicles in 2024. The shift toward automatic transmission motorcycles creates demand for specialized lubricant formulations for matic applications. E-commerce expansion and the proliferation of last-mile delivery increase vehicle utilization rates, leading to a higher frequency of lubricant replacement beyond traditional consumer patterns. The government's push for electric vehicles and its planned phase-out of internal combustion engines by 2040 creates a structural ceiling for growth in automotive lubricant volumes. Regional distribution networks struggle to efficiently serve Indonesia's outer islands, creating supply bottlenecks that limit market penetration in emerging automotive clusters.
Rapid Industrial and Manufacturing Growth
Indonesia's manufacturing sector momentum directly translates to heightened industrial lubricant consumption across metalworking, power generation, and heavy equipment applications. The country's position as the world's largest nickel producer amplifies demand for specialized metalworking fluids and hydraulic systems lubricants in smelting operations. Manufacturing investment creates new industrial capacity requiring initial lubricant fills and ongoing maintenance programs. ExxonMobil's MACHINEXT on-site lubrication management technology, launched in June 2024, demonstrates how digital optimization reduces the total cost of ownership while extending equipment life cycles. The concentration of manufacturing on Java Island creates logistical advantages but limits growth potential in resource-rich outer regions where infrastructure development lags behind industrial investment.
Macroeconomic and Commodity-Price Volatility Dampening Cap-Utilization
Indonesia's lubricant industry faces capacity utilization challenges due to macroeconomic uncertainty and fluctuations in commodity prices, which dampen industrial activity and consumer spending patterns. The domestic industry operates at approximately 60% capacity utilization. Global supply chain disruptions and currency volatility impact base oil import costs, forcing manufacturers to adjust their pricing strategies and consider the effect on demand elasticity. Export-dependent sectors, such as palm oil and mining, experience cyclical downturns that reduce industrial lubricant consumption during commodity price slumps. The concentration of manufacturing capacity on Java island creates regional imbalances, while outer island operations struggle with supply chain reliability during economic turbulence. Regulatory compliance costs under mandatory SNI standards add operational overhead that smaller players cannot easily absorb during periods of margin compression.
Other drivers and restraints analyzed in the detailed report include:
- Nation-wide Infrastructure and Mining Activity Boom
- Marine and Fisheries Fleet Modernization
- Longer Drain-Interval Synthetic Formulations Lowering Volume/Vehicle
For complete list of drivers and restraints, kindly check the Table Of Contents.
Segment Analysis
Automotive engine oil commands 35.80% Indonesia's lubricant market share in 2025, reflecting Indonesia's vehicle-centric lubricant consumption patterns and the dominance of internal combustion engines across passenger and commercial segments. Hydraulic fluids represent the fastest-growing product category, with a 3.51% CAGR for 2026-2031, driven by infrastructure construction and the expansion of mining equipment, which require high-performance hydraulic systems. Industrial engine oil serves power generation and marine applications, while transmission fluids benefit from the automatic transmission boom in the motorcycle industry. Gear oils support Indonesia's heavy equipment and industrial machinery base, particularly in mining operations across Kalimantan and Sulawesi.
Process oils, including rubber process oil and white oil, serve the tire manufacturing and petrochemical industries in Indonesia, while metalworking fluids support the country's expanding manufacturing sector. Turbine oils and transformer oils cater to the power generation infrastructure, while greases serve a diverse range of applications, from automotive chassis lubrication to industrial bearing systems. The evolution of the product mix toward specialized formulations reflects Indonesia's increasing industrial sophistication and the growing influence of OEM specifications, which demand performance lubricants that meet international standards, such as API, JASO, and ACEA certifications.
The Indonesia Lubricants Market Report is Segmented by Product Type (Automotive Engine Oil, Industrial Engine Oil, Transmission Fluids, Gear Oil, Brake Fluids, Hydraulic Fluids, Greases, and More), End-User Industry (Automotive, Marine, Aerospace, Heavy Equipment, and Industrial), and Base Stock Type (Mineral Oil-Based, Synthetic, Semi-Synthetic, and Bio-Based). The Market Forecasts are Provided in Terms of Volume (Liters).
List of Companies Covered in this Report:
- BP Plc (Castrol)
- Chevron Corporation
- Exxon Mobil Corporation
- FUCHS
- Gulf Oil International Ltd
- Idemitsu Kosan Co., Ltd.
- PETRONAS Lubricants International
- PT Pertamina Lubricants
- PT Wiraswasta Gemilang Indonesia
- Shell plc
- The Lubrizol Corporation
- TOP 1 Oil Products Company
- TotalEnergies
Additional Benefits:
- The market estimate (ME) sheet in Excel format
- 3 months of analyst support
TABLE OF CONTENTS
1 Introduction
- 1.1 Study Assumptions and Market Definition
- 1.2 Scope of the Study
2 Research Methodology
3 Executive Summary
4 Market Landscape
- 4.1 Market Overview
- 4.2 Market Drivers
- 4.2.1 Growing automotive parc expansion
- 4.2.2 Rapid industrial and manufacturing growth
- 4.2.3 Nation-wide infrastructure and mining activity boom
- 4.2.4 Marine and fisheries fleet modernization
- 4.2.5 Biodiesel-linked lubricant contamination driving premium additives
- 4.3 Market Restraints
- 4.3.1 Macroeconomic and commodity-price volatility dampening cap-utilization
- 4.3.2 Longer drain-interval synthetic formulations lowering volume/vehicle
- 4.3.3 Crude-oil price swings squeezing margins and price-sensitive buyers
- 4.4 Value Chain Analysis
- 4.5 Regulatory Framework
- 4.6 End-User Trends
- 4.6.1 Automotive Industry
- 4.6.2 Manufacturing Industry
- 4.6.3 Power Generation Industry
- 4.7 Porter's Five Forces
- 4.7.1 Bargaining Power of Suppliers
- 4.7.2 Bargaining Power of Buyers
- 4.7.3 Threat of New Entrants
- 4.7.4 Threat of Substitutes
- 4.7.5 Degree of Competition
5 Market Size and Growth Forecasts (Volume)
- 5.1 By Product Type
- 5.1.1 Automotive Engine Oil
- 5.1.2 Industrial Engine Oil
- 5.1.3 Transmission Fluids
- 5.1.4 Gear Oil
- 5.1.5 Brake Fluids
- 5.1.6 Hydraulic Fluids
- 5.1.7 Greases
- 5.1.8 Process Oil (Including Rubber Process Oil and White Oil)
- 5.1.9 Metalworking Fluids
- 5.1.10 Turbine Oil
- 5.1.11 Transformer Oil
- 5.1.12 Other Product Types
- 5.2 By End-user Industry
- 5.2.1 Automotive
- 5.2.1.1 Passenger Vehicles
- 5.2.1.2 Commercial Vehicles
- 5.2.1.3 Two-Wheelers
- 5.2.2 Marine
- 5.2.3 Aerospace
- 5.2.4 Heavy Equipment
- 5.2.4.1 Construction
- 5.2.4.2 Mining
- 5.2.4.3 Agriculture
- 5.2.5 Industrial
- 5.2.5.1 Power Generation
- 5.2.5.2 Metallurgy and Metalworking
- 5.2.5.3 Textiles
- 5.2.5.4 Oil and Gas
- 5.2.5.5 Other End-Use Industries
- 5.2.1 Automotive
- 5.3 By Base Stock Type
- 5.3.1 Mineral Oil-Based Lubricants
- 5.3.2 Synthetic Lubricants
- 5.3.3 Semi-Synthetic Lubricants
- 5.3.4 Bio-Based Lubricants
6 Competitive Landscape
- 6.1 Market Concentration
- 6.2 Strategic Moves
- 6.3 Market Share (%)/Ranking Analysis
- 6.4 Company Profiles (includes Global level Overview, Market level overview, Core Segments, Financials as available, Strategic Information, Market Rank/Share, Products and Services, Recent Developments)
- 6.4.1 BP Plc (Castrol)
- 6.4.2 Chevron Corporation
- 6.4.3 Exxon Mobil Corporation
- 6.4.4 FUCHS
- 6.4.5 Gulf Oil International Ltd
- 6.4.6 Idemitsu Kosan Co., Ltd.
- 6.4.7 PETRONAS Lubricants International
- 6.4.8 PT Pertamina Lubricants
- 6.4.9 PT Wiraswasta Gemilang Indonesia
- 6.4.10 Shell plc
- 6.4.11 The Lubrizol Corporation
- 6.4.12 TOP 1 Oil Products Company
- 6.4.13 TotalEnergies
7 Market Opportunities and Future Outlook
- 7.1 White-space and Unmet-need Assessment
8 Key Strategic Questions for CEOs
 东非润滑油市场:市场占有率分析、产业趋势与统计、成长预测(2026-2031年)拉丁美洲润滑油市场:市场占有率分析、产业趋势与统计、成长预测(2026-2031年)日本润滑油市场-份额分析、产业趋势与统计、成长预测(2026-2031)润滑油:市场占有率分析、产业趋势与统计、成长预测(2026-2031)马来西亚润滑油市场:市场占有率分析、产业趋势与统计、成长预测(2026-2031)
 日本润滑油市场报告(按产品类型、最终用户和地区划分,2026-2034年)
 水性润滑剂市场规模、份额及成长分析(按产品类型、通路及地区划分)-2026-2033年产业预测
 2025年全球开式齿轮润滑油市场报告
 干式润滑剂市场-2025年至2030年预测
 外科润滑剂市场按类型、应用、最终用户和分销管道划分-2025-2032年全球预测