


 |
市场调查报告书
商品编码
1911721
菲律宾电信行动网路营运商 - 市场占有率分析、产业趋势与统计、成长预测(2026-2031)Philippines Telecom MNO - Market Share Analysis, Industry Trends & Statistics, Growth Forecasts (2026 - 2031) |
||||||
※ 本网页内容可能与最新版本有所差异。详细情况请与我们联繫。
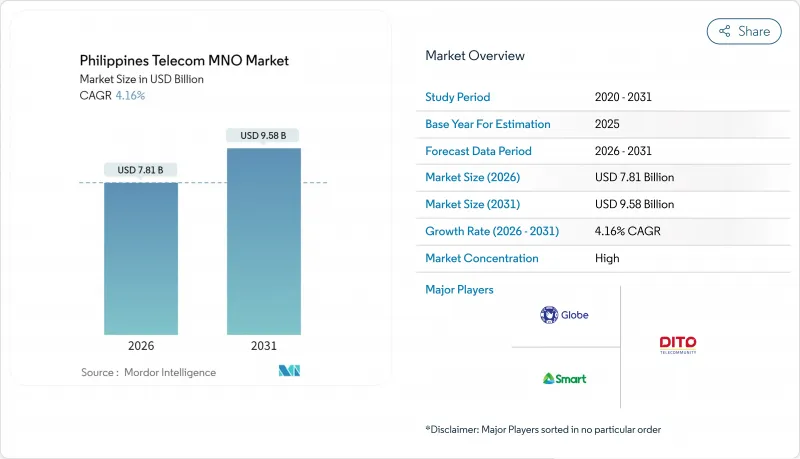
预计到 2026 年,菲律宾电信行动网路营运商 (MNO) 市场规模将达到 78.1 亿美元。
这代表着从 2025 年的 75 亿美元成长到 2031 年的 95.8 亿美元,2026 年至 2031 年的年复合成长率(CAGR)为 4.16%。
这项成长主要得益于行动资料服务的快速转型、频谱改革的推进以及5G网路的日趋成熟,目前5G网路已覆盖所有主要区域城市。计划于2026年举行的新频谱竞标以及强制性基地台共用规则正在降低准入门槛,并扩大服务欠缺地区的网路覆盖范围。影片串流媒体和行动游戏的数据流量持续推动收入成长,而基于金融科技的超级应用则透过将支付、小额贷款和娱乐功能整合到单一登入帐户中,提高了用户平均收入(ARPU)。在供应方面,通讯业者正加紧加强网路建设,以应对颱风可能造成的网路中断,并启用边缘资料中心来满足低延迟的企业运作。
菲律宾电信行动网路营运商市场趋势与洞察
影片游戏热潮导致行动数据消耗量增加
受高清串流媒体和行动电竞普及的推动,预计到2024年,菲律宾每月平均数据使用量将达到8.7GB,较2022年增长340%。在Globe Telecom的网路流量尖峰时段,影片流量占夜间流量的65%,因此该业者正在加速扩容其覆盖最密集的LTE和5G基地台。在游戏领域,竞技游戏需要低于30毫秒的延迟,这进一步推动了付费订阅用户的成长。全球串流媒体服务商对内容库的在地化以及菲律宾原创内容的推出,都刺激了数据需求的成长,并促进了用户获取。这些因素共同作用,使得行动数据成为菲律宾电信行动网路营运商(MNO)市场的主要收入来源。
5G部署加速和设备价格下降
2024年底,Smart Communications将在马尼拉大都会区实现95%的人口覆盖,入门级5G设备的价格也将首次降至10,000披索(约175美元)以下。覆盖范围的扩大和价格的降低,使得5G SIM卡用户数量年增了280%。根据《菲律宾连接器法案》(Connector Dong Pinoy Act),监管流程的简化将基地台许可证的前置作业时间从18个月缩短至6个月,使营运商能够提前在人口密集的城市走廊推出服务。设备製造商也透过电子钱包提供分期付款方案,进一步降低了用户接受5G服务的门槛。这些趋势支撑了菲律宾电信行动网路营运商(MNO)市场长期收入成长的预测。
营运商面临投资5G/光纤的压力
PLDT已为2023-2024财年(相当于业务收益的23%)编制了920亿披索(约16亿美元)的资本支出累计。这主要是由于5G基地台密度增加以及光纤到府(FTTH)在郊区的扩展。每个基地台站点,包括频谱和回程传输边缘升级,都需要比上一代4G网路多出40%-60%的资金。即将举行的频谱竞标可能会产生数亿美元的领先成本。因此,通讯业者优先考虑ARPU值高的地区,延后遍远地区的开发,从而减缓了普遍服务的推进速度。
细分市场分析
到2025年,行动资料服务将占菲律宾通讯业者收入的53.46%,巩固其在菲律宾行动网路营运商(MNO)市场的主导地位。随着5G普及率的提升,以及串流影片流量占高峰流量的60%以上,预计这一份额将进一步成长。受马尼拉大都会智慧城市建设和吕宋岛稻米产区农业监测计划等因素的推动,物联网(IoT)和机器对机器(M2M)服务将推动菲律宾电信MNO市场规模以4.28%的复合年增长率增长。语音通话收入持续下滑,自2020年以来已下降80%,原因是通讯应用逐渐取代了部分人与人之间的通讯。
为了应对这项挑战,通讯业者正将OTT影片和音乐订阅服务捆绑销售,以实现数据变现并维持客户参与。商业通讯API正在取代传统的短信,用于电子商务订单更新和双因素认证,从而缓解收入下滑。新兴的边缘云端服务,例如行动专用网路和网路切片,预计将成为下一波企业合约的基础。受这些趋势的影响,以数据为中心的服务产品预计将在预测期内推动菲律宾电信行动网路营运商(MNO)市场的扩张。
菲律宾电信行动网路营运商 (MNO) 市场按服务类型(语音服务、数据互联网服务、通讯服务、物联网和机器对机器 (M2M) 服务、OTT 和付费电视服务以及其他服务)和最终用户(企业、消费者)进行细分。市场预测以价值(美元)和用户数量(用户数)为单位。
其他福利
- Excel格式的市场预测(ME)表
- 3个月的分析师支持
目录
第一章 引言
- 研究假设和市场定义
- 调查范围
第二章调查方法
第三章执行摘要
第四章 市场情势
- 市场概览
- 监理与政策框架
- 当前频段拥有情形
- 电信业生态系统
- 宏观经济与外在因素
- 波特五力模型
- 竞争对手之间的竞争
- 新进入者的威胁
- 供应商的议价能力
- 买方的议价能力
- 替代品的威胁
- 领先行动网路营运商的关键绩效指标(2020-2025)
- 独立行动用户和渗透率
- 行动网路使用者数量和普及率
- 按接入技术分類的SIM卡连线数和渗透率
- 蜂巢式物联网/M2M连接
- 宽频连线(移动和固定)
- ARPU(每位用户平均收入)
- 每用户平均数据使用量(GB/月)
- 市场驱动因素
- 影片游戏热潮导致行动数据消耗量增加
- 加速部署 5G 和更经济实惠的设备
- 政府通用铁塔和频谱改革计划
- 企业数位转型与物联网连结需求
- 金融科技超级应用程式(例如 GCash)能够提高客户留存率和平均每用户收入 (ARPU)。
- 抗颱风网络需求推动了密集化建设
- 市场限制
- 通讯业者面临沉重的5G/光纤资本投资负担
- 遍远地区较低的每位用户平均收入限制了投资收益。
- 透过SIM卡註册方式取消预付合约
- 气候变迁导致的通讯中断增加将提高营运成本和客户流失风险。
- 技术展望
- 电信领域主要经营模式分析
- 定价模型和定价分析
第五章 市场规模与成长预测
- 通信总收入和每位用户平均收入
- 按服务类型
- 语音服务
- 数据和网际网路服务
- 通讯服务
- 物联网和机器对机器服务
- OTT和付费电视服务
- 其他服务(附加价值服务、漫游和国际服务、企业和批发服务等)
- 最终用户
- 公司
- 一般消费者
第六章 竞争情势
- 市场集中度
- 主要供应商的策略与投资动向(2023-2025)
- 2024年行动网路营运商市场占有率分析
- 行动网路服务产品基准分析
- 行动网路营运商概况(定期订阅、解约率、ARPU 等)
- 行动网路营运商公司简介*
- Globe Telecom
- Smart Communications
- DITO Telecommunity
第七章 市场机会与未来展望
The Philippines Telecom MNO Market size in 2026 is estimated at USD 7.81 billion, growing from 2025 value of USD 7.5 billion with 2031 projections showing USD 9.58 billion, growing at 4.16% CAGR over 2026-2031.
Growth is powered by the rapid pivot to mobile-data services, progressive spectrum reforms and the maturing 5G footprint that now blankets every regional capital. New frequency auctions scheduled for 2026, together with mandatory tower-sharing rules, are lowering entry barriers and widening coverage in underserved municipalities. Data traffic from video streaming and mobile gaming continues to drive incremental revenue, while fintech-anchored super-apps are lifting average revenue per user by bundling payments, micro-loans and entertainment under a single login. On the supply side, operators are racing to harden networks against typhoon-related outages and to bring edge data-centers online for low-latency enterprise workloads.
Philippines Telecom MNO Market Trends and Insights
Rising mobile-data consumption from video and gaming boom
Average monthly data use climbed to 8.7 GB in 2024, a 340% surge since 2022, as high-definition streaming and mobile esports moved into the mainstream. Video now absorbs 65% of peak evening traffic on Globe Telecom's network, prompting the operator to accelerate capacity upgrades on densest LTE and 5G sites. Gaming contributes a further uplift in premium plan uptake because competitive titles require latency below 30 ms. Localization of streaming catalogs by global providers has reinforced this data pull, with Filipino-language originals boosting subscriber acquisition. Together these factors have made mobile data the dominant revenue line in the Philippines telecom MNO market.
Accelerated 5G roll-out and device affordability
By late-2024 Smart Communications reported 95% population coverage in Metro Manila, while entry-level 5G handsets fell below PHP 10,000 (USD 175) for the first time. The confluence of coverage and cost has driven a 280% year-on-year increase in 5G SIMs. Regulatory streamlining under the Konektadong Pinoy Act trimmed tower-permit lead times from 18 months to 6 months, allowing operators to light up dense urban corridors ahead of schedule. Device manufacturers have also bundled installment schemes through e-wallets, further lowering adoption barriers. These trends underpin the long-run revenue uplift baked into the Philippines telecom MNO market forecasts.
Heavy 5G / fiber capex burden on operators
PLDT allocated PHP 92 billion (USD 1.6 billion) in capex during 2024-23% of service revenue-as it densified 5G radios and pushed fiber-to-the-home deeper into suburbs. Each 5G site needs 40-60% more cash than its 4G predecessor once spectrum, backhaul and edge upgrades are included. Upcoming spectrum auctions may add upfront costs running into hundreds of millions of USD. Consequently, carriers prioritize high-ARPU districts and postpone rural builds, slowing universal-service progress.
Other drivers and restraints analyzed in the detailed report include:
- Government common-tower and spectrum-reform programs
- Enterprise digital-transformation and IoT connectivity demand
- Low rural ARPU limiting ROI
For complete list of drivers and restraints, kindly check the Table Of Contents.
Segment Analysis
Mobile-data services generated 53.46% of 2025 operator revenue, confirming their primacy within the Philippines telecom MNO market. This share will widen as 5G penetration spreads beyond early adopters and as streaming video climbs beyond 60% of peak traffic loads. The Philippines telecom MNO market size attributable to IoT and M2M services is forecast to compound at 4.28% annually, underpinned by smart-city deployments in Metro Manila and agro-monitoring projects across Luzon's rice belt. Voice revenue continues its structural retreat-down 80% since 2020-as messaging apps absorb person-to-person traffic.
In response, operators bundle OTT video and music subscriptions, monetizing data while preserving engagement. Business messaging APIs are replacing legacy SMS for e-commerce order updates and two-factor authentication, mitigating revenue loss. Emerging edge-cloud services such as mobile private networks and network slicing are expected to anchor the next wave of enterprise contracts. These dynamics ensure that data-centric offerings will broaden the Philippines telecom MNO market over the forecast horizon.
The Philippines Telecom MNO Market is Segmented by Service Type (Voice Services, Data and Internet Services, Messaging Services, Iot and M2M Services, OTT and PayTV Services, Other Services), End User (Enterprises, Consumers). The Market Forecasts are Provided in Terms of Value (USD) and Volume (Subscribers).
List of Companies Covered in this Report:
- Globe Telecom
- Smart Communications
- DITO Telecommunity
Additional Benefits:
- The market estimate (ME) sheet in Excel format
- 3 months of analyst support
TABLE OF CONTENTS
1 INTRODUCTION
- 1.1 Study Assumptions and Market Definition
- 1.2 Scope of the Study
2 RESEARCH METHODOLOGY
3 EXECUTIVE SUMMARY
4 MARKET LANDSCAPE
- 4.1 Market Overview
- 4.2 Regulatory and Policy Framework
- 4.3 Spectrum Landscape and Competitive Holdings
- 4.4 Telecom Industry Ecosystem
- 4.5 Macroeconomic and External Drivers
- 4.6 Porter's Five Forces
- 4.6.1 Competitive Rivalry
- 4.6.2 Threat of New Entrants
- 4.6.3 Bargaining Power of Suppliers
- 4.6.4 Bargaining Power of Buyers
- 4.6.5 Threat of Substitutes
- 4.7 Key MNO KPIs (2020-2025)
- 4.7.1 Unique Mobile Subscribers and Penetration Rate
- 4.7.2 Mobile Internet Users and Penetration Rate
- 4.7.3 SIM Connections by Access Technology and Penetration
- 4.7.4 Cellular IoT / M2M Connections
- 4.7.5 Broadband Connections (Mobile and Fixed)
- 4.7.6 ARPU (Average Revenue Per User)
- 4.7.7 Average Data Usage per Subscription (GB/month)
- 4.8 Market Drivers
- 4.8.1 Rising mobile-data consumption from video and gaming boom
- 4.8.2 Accelerated 5G roll-out and device affordability
- 4.8.3 Government common-tower and spectrum-reform programs
- 4.8.4 Enterprise digital-transformation and IoT connectivity demand
- 4.8.5 Fin-tech super-apps (e.g., GCash) lifting stickiness and ARPU
- 4.8.6 Typhoon-resilient network requirements driving densification
- 4.9 Market Restraints
- 4.9.1 Heavy 5G / fibre capex burden on operators
- 4.9.2 Low rural ARPU limiting ROI
- 4.9.3 SIM Registration Act-driven prepaid de-activations
- 4.9.4 Climate-related outages raising opex and churn risk
- 4.10 Technological Outlook
- 4.11 Analysis of key business models in Telecom
- 4.12 Analysis of Pricing Models and Pricing
5 MARKET SIZE AND GROWTH FORECASTS (VALUE)
- 5.1 Overall Telecom Revenue and ARPU
- 5.2 Service Type
- 5.2.1 Voice Services
- 5.2.2 Data and Internet Services
- 5.2.3 Messaging Services
- 5.2.4 IoT and M2M Services
- 5.2.5 OTT and PayTV Services
- 5.2.6 Other Services (VAS, Roaming and International Services, Enterprise and Wholesale Services, etc.)
- 5.3 End-User
- 5.3.1 Enterprises
- 5.3.2 Consumer
6 COMPETITIVE LANDSCAPE
- 6.1 Market Concentration
- 6.2 Strategic Moves and Investments by key vendors, 2023-2025
- 6.3 Market share analysis for MNOs, 2024
- 6.4 Product Benchmarking Analysis for mobile network services
- 6.5 MNO snapshot (subscribers, churn rate, ARPU, etc.)
- 6.6 Company Profiles* of MNOs (Includes Business Overview | Service Portfolio | Financials | Business Strategy and Recent Developments | SWOT Analysis)
- 6.6.1 Globe Telecom
- 6.6.2 Smart Communications
- 6.6.3 DITO Telecommunity
7 MARKET OPPORTUNITIES AND FUTURE OUTLOOK
- 7.1 White-space and Unmet-Need Assessment
 2026-2030年全球虚拟行动服务业者(MVNO)服务市场
 中东和非洲行动通讯业者(MNO):市场份额分析、产业趋势、统计数据和成长预测(2026-2031 年)义大利电信行动网路业者:市场占有率分析、产业趋势与统计、成长预测(2026-2031 年)德国行动通讯业者(MNO):市场占有率分析、产业趋势与统计、成长预测(2026-2031 年)马来西亚行动通讯业者(MNO)市场占有率分析、产业趋势与统计、成长预测(2026-2031)
 5G MVNO市场:2025-2032年全球预测(按套餐类型、最终用户、设备类型、分销管道、垂直行业、定价模式和网路类型划分)行动虚拟网路营运商 (MVNO) 市场:2025-2032 年全球预测(按服务类型、分销管道、费率方案、最终用户产业和应用划分)
 2025年全球虚拟行动服务业者(MVNO)市场报告虚拟行动服务业者(MVNO):市场占有率分析、产业趋势、统计数据和成长预测(2025-2030 年)
 全球物联网虚拟行动服务业者(MVNO)市场