


 |
市场调查报告书
商品编码
1934581
美国石油和天然气:市场份额分析、行业趋势和统计数据、成长预测(2026-2031 年)United States Oil And Gas - Market Share Analysis, Industry Trends & Statistics, Growth Forecasts (2026 - 2031) |
||||||
※ 本网页内容可能与最新版本有所差异。详细情况请与我们联繫。
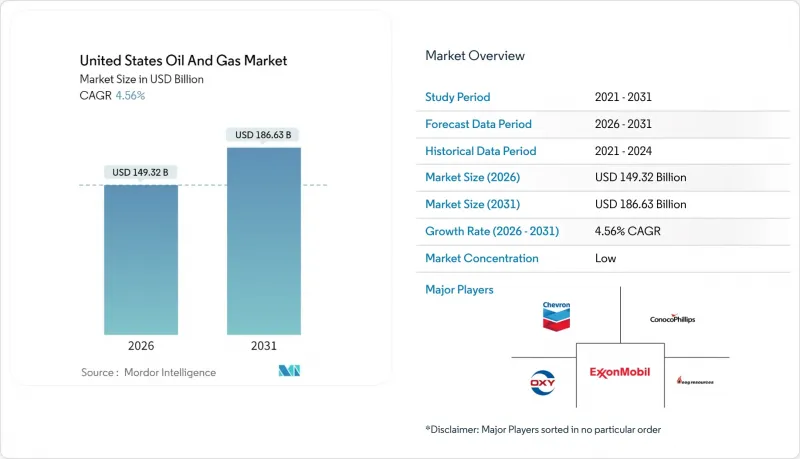
据估计,美国石油和天然气市场在 2026 年的价值为 1,493.2 亿美元,高于 2025 年的 1,428.1 亿美元,预计到 2031 年将达到 1,866.3 亿美元。
预计2026年至2031年年复合成长率(CAGR)为4.56%。
这一扩张得益于緻密油藏强劲的钻井产能、墨西哥湾沿岸液化天然气(LNG)工厂的快速扩张以及成熟盆地技术的稳步推广。结构性转变显而易见,出口导向成长超过了国内需求,预计到2028年将新增150亿立方英尺/日的LNG液化产能。儘管上游再投资较为温和,但效率的提昇在钻井平台钻机下降的情况下仍提高了产量。同时,大型併购案将油田集中在二迭纪盆地,透过共用基础设施降低了成本,并增强了损益平衡能力。
美国油气市场趋势与洞察
提高二迭纪盆地緻密油产量
先进的完井设计和人工智慧引导钻井技术将推动二迭纪盆地的石油产量在2024年达到每日630万桶,占美国石油总增产的60%,儘管钻机数量有所下降。更长的水平井段、更高的支撑剂用量以及即时压裂优化技术正在提高单井采收率并降低成本。埃克森美孚收购先锋公司旨在透过标准化作业和共用基础设施,进一步提高15%的产能。独立钻井公司也正在采用类似的策略以保持竞争力。因此,追求效率是提高产量的基础,也是保护美国油气市场免受价格波动影响的有效方法。
液化天然气出口能力快速成长
墨西哥湾沿岸新建的液化工厂正透过将国内供应与全球价格溢价连结起来,改变市场需求。 Venture Global公司的普拉克明斯终端将于2024年新增2,000万吨/年的产能,随后金山口终端也将新增1,560万吨/年的产能。出口激增推动了阿巴拉契亚盆地和海恩斯维尔盆地的钻探活动,一条耗资150亿美元的新管道将石油输送到南方。与全球市场更紧密的联繫将降低亨利港的季节性价格波动,提高生产商和中游运营商的可预测性,并进一步促进美国油气市场的扩张。
遵守美国环保署 OOOOb/c 甲烷排放法规的成本
自2024年起,甲烷排放超过设定阈值将受到附加税从每吨900美元起,到2026年将增加至每吨1,500美元。新增的监测和修復项目将使一口典型页岩油井的营运成本增加每桶2至4美元,对中小型生产商的影响尤其严重。合规要求将推动连续洩漏检测等技术的快速普及,并加速产业整合,从而改变美国油气市场的成本结构。
细分市场分析
预计到2025年,上游产业将占美国油气市场的71.85%,并在2031年之前维持4.84%的复合年增长率。中游产业将占18.40%,这主要得益于管线扩建和LNG接收站的建设;而下游炼油业在产能有限和排放法规日益严格的双重压力下,将维持9.75%的复合年增长率。目前,营运商的目标是在原油价格为每桶60美元的情况下,实现15%以上的内部收益率,并将资金集中投入高收益页岩气水平井和部分长期计划。康菲石油公司的Willow计划计划正是这一转变的体现,其30年的蕴藏量能够提供短期页岩气专案中罕见的现金流永续性。钻井效率的提高和审慎的再投资策略,使得上游产业成为美国油气市场持续成长的核心。
上游产业的主导地位得益于生产效率的快速提升,这使得损益平衡点一直低于每桶40美元。中游产业仍蕴藏着发展机会,液化天然气(LNG)的成长带动了储存和运输需求,但资本纪律抑制了投机性计划。下游产业的利润率因可再生柴油的竞争和监管成本的上升而不断下降。这些趋势共同巩固了上游产业对美国油气市场收入趋势的独特影响力。
其他福利:
- Excel格式的市场预测(ME)表
- 3个月的分析师支持
目录
第一章 引言
- 研究假设和市场定义
- 调查范围
第二章调查方法
第三章执行摘要
第四章 市场情势
- 市场概览
- 市场驱动因素
- 提高二迭纪盆地緻密油产量
- 液化天然气出口能力快速成长-(墨西哥湾沿岸地区新建工厂)
- 利用基于人工智慧的地震分析提高获利油井的产量
- 利用 IRA 45Q 和 45V税额扣抵抵免降低 CCS 成本
- 企业绿债券资金筹措中游扩张
- 先进塑胶对小众石油原料的需求
- 市场限制
- 根据美国环保署(EPA)的 OOOOb/c 计算的甲烷排放法规合规成本
- 加强州级的监管(如科罗拉多、新墨西哥州)
- 二迭纪盆地裂缝发育受水应力限制。
- WTI原油与布兰特原油价格持续存在价差,这对出口产生了负面影响。
- 供应链分析
- 监管环境
- 技术展望
- 原油产量和消费量预测
- 天然气生产与消费预测
- 已安装管道容量分析
- 非传统资源资本支出展望(緻密油、油砂、深水)
- 波特五力模型
- 供应商的议价能力
- 买方的议价能力
- 新进入者的威胁
- 替代品的威胁
- 竞争对手之间的竞争
- PESTEL 分析
第五章 市场规模与成长预测
- 按行业
- 上游部门
- 中游产业
- 下游产业
- 按地区
- 陆上
- 离岸
- 透过服务
- 建造
- 维护和检修
- 退休
第六章 竞争情势
- 市场集中度
- 策略趋势(併购、联盟、购电协议)
- 市场占有率分析(主要企业的市场排名和份额)
- 公司简介
- Exxon Mobil Corp.
- Chevron Corp.
- ConocoPhillips Co.
- EOG Resources Inc.
- Occidental Petroleum Corp.
- Pioneer Natural Resources Co.
- Phillips 66 Co.
- Valero Energy Corp.
- Marathon Petroleum Corp.
- Hess Corp.
- Devon Energy Corp.
- BP PLC
- Shell PLC
第七章 市场机会与未来展望
The United States Oil And Gas Market size in 2026 is estimated at USD 149.32 billion, growing from 2025 value of USD 142.81 billion with 2031 projections showing USD 186.63 billion, growing at 4.56% CAGR over 2026-2031.
Robust drilling productivity in tight-oil plays, the rapid build-out of Gulf Coast LNG trains, and steady technology diffusion into mature basins underpin this expansion. Structural change is evident as export-oriented growth outpaces domestic demand, with 15 billion cubic feet per day of new LNG liquefaction slated by 2028. Upstream reinvestment remains disciplined, yet efficiency gains allow production to rise even as rig counts fall. Meanwhile, mega-mergers concentrate Permian Basin acreage, unlocking shared infrastructure savings that strengthen breakeven resilience.
United States Oil And Gas Market Trends and Insights
Tight-oil Productivity Gains in the Permian
Advanced completion designs and AI-guided drilling lifted Permian Basin output to 6.3 million barrels per day in 2024, representing 60% of total US growth despite a leaner rig fleet. Longer laterals, higher proppant loading, and real-time frac optimization push recovery per well higher while trimming costs. ExxonMobil's integration of Pioneer aims for a further 15% uplift through standardized execution and shared infrastructure. Independent drillers mirror these tactics to remain competitive. Efficiency, therefore, anchors continued output gains that fortify the US oil and gas market against price swings
Surging LNG Export Capacity
New Gulf Coast liquefaction trains reshape demand by linking domestic supply to global price premia. Venture Global's Plaquemines terminal added 20 million tpa capacity in 2024, with Golden Pass to follow at 15.6 million tpa. The export surge boosts Appalachian and Haynesville drilling, while USD 15 billion of new pipelines funnel volumes south. Closer alignment with world markets tempers seasonal Henry Hub volatility, strengthening forward visibility for producers and midstream players, and reinforcing expansion in the US oil and gas market.
Methane-fee Compliance Costs Under EPA OOOOb/c
Beginning in 2024, methane emissions exceeding set thresholds incur fees starting at USD 900 per metric ton and rising to USD 1,500 by 2026. Added monitoring and repair programs raise operating costs by USD 2-4 per barrel for typical shale wells, hitting smaller producers hardest. Compliance demands speed consolidation and quick adoption of technology, such as continuous leak detection, to alter cost structures within the US oil and gas market.
Other drivers and restraints analyzed in the detailed report include:
- AI-driven Seismic Analytics for Marginal Well Recovery
- IRA 45Q & 45V Tax Credits Lowering CCS Costs
- Water-stress Limits on Permian Fracturing
For complete list of drivers and restraints, kindly check the Table Of Contents.
Segment Analysis
Upstream claimed 71.85% of the US oil and gas market size in 2025 and is on track for a 4.84% CAGR to 2031. Midstream captured 18.40%, buoyed by pipeline additions and LNG terminal build-outs, while downstream refining held 9.75% amid capacity limits and tighter emissions rules. Operators now target internal rates above 15% at USD 60 oil, steering capital toward high-return shale laterals and select long-cycle projects. ConocoPhillips' Willow development illustrates the shift, with 30-year reserves offering cash-flow depth rare in short-cycle shale projects. Drilling efficiency and disciplined reinvestment keep the upstream segment at the center of continued gains in the US oil and gas market.
Upstream's dominance rests on rapid productivity gains that hold costs near sub-USD 40 per barrel breakevens. Midstream remains an opportunity-rich sector as LNG growth drives storage and takeaway needs, yet capital discipline tempers speculative projects. Downstream margins are tightening amid competition from renewable diesel and the cost of regulatory upgrades. Together, these dynamics reinforce the upstream sector's outsized influence on revenue trends within the US oil and gas market.
The United States Oil and Gas Market Report is Segmented by Sector (Upstream, Midstream, and Downstream), Location (Onshore and Offshore), and Service (Construction, Maintenance and Turn-Around, and Decommissioning). The Market Sizes and Forecasts are Provided in Terms of Value (USD).
List of Companies Covered in this Report:
- Exxon Mobil Corp.
- Chevron Corp.
- ConocoPhillips Co.
- EOG Resources Inc.
- Occidental Petroleum Corp.
- Pioneer Natural Resources Co.
- Phillips 66 Co.
- Valero Energy Corp.
- Marathon Petroleum Corp.
- Hess Corp.
- Devon Energy Corp.
- BP PLC
- Shell PLC
Additional Benefits:
- The market estimate (ME) sheet in Excel format
- 3 months of analyst support
TABLE OF CONTENTS
1 Introduction
- 1.1 Study Assumptions & Market Definition
- 1.2 Scope of the Study
2 Research Methodology
3 Executive Summary
4 Market Landscape
- 4.1 Market Overview
- 4.2 Market Drivers
- 4.2.1 Tight-oil productivity gains in the Permian
- 4.2.2 Surging LNG export capacity -(new Gulf Coast trains)
- 4.2.3 AI-driven seismic analytics for marginal well recovery
- 4.2.4 IRA 45Q & 45V tax credits lowering CCS costs
- 4.2.5 Corporate green-bond funding for midstream build-out
- 4.2.6 Niche petro-feedstock demand from advanced plastics
- 4.3 Market Restraints
- 4.3.1 Methane-fee compliance costs under EPA OOOOb/c
- 4.3.2 Growing state-level setback rules (e.g., CO, NM)
- 4.3.3 Water-stress limits on Permian fracturing
- 4.3.4 Persistent WTI-Brent discount hurting exports
- 4.4 Supply-Chain Analysis
- 4.5 Regulatory Landscape
- 4.6 Technological Outlook
- 4.7 Crude-Oil Production & Consumption Outlook
- 4.8 Natural-Gas Production & Consumption Outlook
- 4.9 Installed Pipeline Capacity Analysis
- 4.10 Unconventional Resources CAPEX Outlook (tight oil, oil sands, deep-water)
- 4.11 Porter's Five Forces
- 4.11.1 Bargaining Power - Suppliers
- 4.11.2 Bargaining Power - Buyers
- 4.11.3 Threat of New Entrants
- 4.11.4 Threat of Substitutes
- 4.11.5 Competitive Rivalry
- 4.12 PESTLE Analysis
5 Market Size & Growth Forecasts
- 5.1 By Sector
- 5.1.1 Upstream
- 5.1.2 Midstream
- 5.1.3 Downstream
- 5.2 By Location
- 5.2.1 Onshore
- 5.2.2 Offshore
- 5.3 By Service
- 5.3.1 Construction
- 5.3.2 Maintenance and Turn-around
- 5.3.3 Decommissioning
6 Competitive Landscape
- 6.1 Market Concentration
- 6.2 Strategic Moves (M&A, Partnerships, PPAs)
- 6.3 Market Share Analysis (Market Rank/Share for key companies)
- 6.4 Company Profiles (includes Global level Overview, Market level overview, Core Segments, Financials as available, Strategic Information, Products & Services, and Recent Developments)
- 6.4.1 Exxon Mobil Corp.
- 6.4.2 Chevron Corp.
- 6.4.3 ConocoPhillips Co.
- 6.4.4 EOG Resources Inc.
- 6.4.5 Occidental Petroleum Corp.
- 6.4.6 Pioneer Natural Resources Co.
- 6.4.7 Phillips 66 Co.
- 6.4.8 Valero Energy Corp.
- 6.4.9 Marathon Petroleum Corp.
- 6.4.10 Hess Corp.
- 6.4.11 Devon Energy Corp.
- 6.4.12 BP PLC
- 6.4.13 Shell PLC
7 Market Opportunities & Future Outlook
- 7.1 White-space & Unmet-need Assessment
 2026年全球油气管道及相关结构建设市场报告
 石油和天然气市场规模、份额和成长分析(按产品类型、产业类型、部署类型、应用和地区划分)-2026-2033年产业预测
 英国石油天然气:市场占有率分析、产业趋势与统计、成长预测(2026-2031)越南石油天然气:市场占有率分析、产业趋势与统计、成长预测(2026-2031年)
 日本油气市场报告:按类型、应用和地区划分(2026-2034年)2026年全球油气市场报告
 石油和天然气营运维护服务市场(按维护类型、合约类型、资产类型、交付方式、能力、服务供应商和最终用户行业划分),全球预测,2026-2032年印尼油气:市场占有率分析、产业趋势与统计、成长预测(2026-2031)马来西亚油气:市场占有率分析、产业趋势、统计数据和成长预测(2026-2031)
 2032年油气市场预测:按产品类型、价值链、来源、运输基础设施、应用、最终用户和地区分類的全球分析