


 |
市场调查报告书
商品编码
1934699
美国跨境公路货运:市场占有率分析、产业趋势与统计数据、成长预测(2026-2031 年)United States Cross Border Road Freight Transport - Market Share Analysis, Industry Trends & Statistics, Growth Forecasts (2026 - 2031) |
||||||
※ 本网页内容可能与最新版本有所差异。详细情况请与我们联繫。
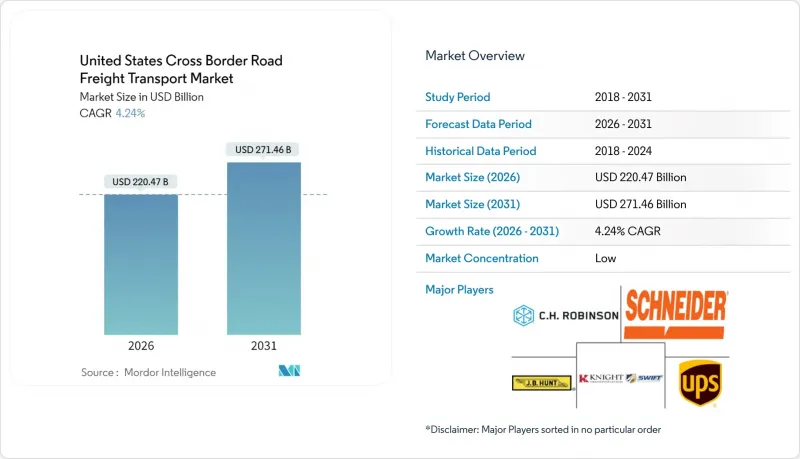
美国跨境公路货运市场预计将从 2025 年的 2,115.1 亿美元成长到 2026 年的 2,204.7 亿美元,预计到 2031 年将达到 2,714.6 亿美元,2026 年至 2031 年的复合年增长率为 4.24%。
美墨加协定(USMCA)贸易走廊内的近岸外包、电子商务的持续成长以及大规模的基础设施建设正在推动需求,而更严格的安全通讯协定和劳动力短缺则考验着网路的柔软性。墨西哥已超越中国成为美国最大的贸易伙伴,拥有密集的南北向卡车运输路线,每天的贸易额超过30亿美元。同时,由于碳定价机制,加拿大继续扮演着至关重要但成本高昂的角色。预计到2032年,加拿大的司机短缺将达到16万人,这推高了货运价格,同时也加速了提高运力运转率和定价准确性的技术应用。大型卡车运输公司之间的整合,例如DSV收购DB Schenker以及Ryder的收购攻势,正在实现跨境专用车队的规模经济。与此同时,一些专注于温控和电商主导的小包裹运输路线的营运商正在扩大市场份额。在 I-45 和 I-35 走廊进行的自动驾驶卡车试验以及人工智慧驱动的定价引擎正在减少空驶里程,并补充全天候长途运输能力,使技术成为竞争优势的核心。
美国跨境公路货运市场趋势与洞察
美墨加协定和近岸外包推动美墨货运量激增
美墨加协定(USMCA)的条款打造了一条价值1.3兆美元的贸易走廊,将促进墨西哥对美国的製造业出口,并已促成到2027年新增460亿美元的投资承诺。每月跨境卡车数量平均达到150万辆,比疫情前增加了166.3%,这给传统的边境基础设施带来了巨大压力,并随着北向工业货运接近饱和,承运商的定价权也随之增强。自2019年以来,墨西哥一侧的工业用地需求翻了一番,这印证了製造商优先考虑接近性而非遥远的亚洲供应链。汽车原始设备製造商(OEM)已经证明了乘数效应:在墨西哥组装厂每投资10亿美元,就会产生大规模的向北区域物流需求,从而强化美国跨境公路货运市场的成长动能。
将墨西哥汽车零件运回国内将活性化向北运输。
在贸易紧张局势下,亚洲零件製造商正纷纷在墨西哥位置工厂,以维持进入美国市场的管道,从而重塑汽车供应链。上海优尼森计划在2024年投资4亿美元,便是其中的典型例子。这些新进业者打破了航运路线的平衡,北向货运价格居高不下,而南向货运价格停滞不前,这使得资产重新配置变得更加复杂,并推高了某些方向的承运商利润。半导体和电池製造商也面临类似的趋势,进一步推高了北向货运量。即时视觉化平台对于防止货物被盗、协调运往美国的工厂和码头至关重要,有助于维持美国跨境公路货运市场的效率。
司机短缺推高公路货运费率
到2032年,劳动力短缺问题可能翻一番,职缺将达到16万个。公路货运费率将会上涨,而随着55岁以上人士退出劳动市场的速度快于新入行者,中小运输公司的抗风险能力将下降。儘管联邦汽车运输安全管理局(FMCSA)提供的4,800万美元津贴扩大了商用驾驶执照(CDL)的培训途径,但跨国营运需要额外的安全许可,这限制了候选人的范围。允许实习驾驶员进行商业运营的例外情况表明,运输公司迫切需要提高运力,而运力不足仍然是美国跨境公路货运市场最大的结构性限制。
细分市场分析
至2025年,製造业将占美国跨境公路货运市场份额的32.14%。这主要得益于复杂的汽车和工业供应链,这些供应链需要专用的整车运输能力和严格的准时交付可靠性。随着原始设备製造商(OEM)和一级供应商加大近岸外包投资,美国製造业相关路线的跨境公路货运市场规模预计将稳定成长。然而,由于金属和塑胶等大宗商品价格波动的影响,预计成长速度将放缓。随着跨境电子商务渗透率的提高,批发和零售货运量开始加速成长。随着面向消费者的企业寻求更频繁、更小批量的配送,预计该领域在2026年至2031年间的复合年增长率将达到4.92%。
多元化发展,涵盖电子产品、医疗设备和生鲜产品等,推动了货运品类的丰富化,需要更广泛的设备类型,并强化了零担货运和温控货运细分市场。批发商和零售商正在采用基于区块链的报关方式来加快清关速度,而汽车製造商则在扩展数位双胞胎建模技术以优化车道。这些变化共同巩固了製造业的基础性作用,同时也凸显了零售商在美国跨境公路货运市场运输网路设计中日益增长的影响力。
至2025年,非货柜货物将占美国跨境公路货运市场的85.05%。这主要是由于散装货物和大型汽车零件直接依赖卡车运输。对时效性要求较高的製成品避免了铁路转换,这巩固了卡车运输的运输方式优势,即使铁路的竞争力日益增强。
预计2026年至2031年间,货柜货运业将以4.82%的复合年增长率成长,这主要得益于多式联运服务的整合,以及基于区块链的追踪系统减少了单据错误并提高了透明度。使用40英尺货柜进口消费品的电商企业正在尝试沿着跨境。
其他福利:
- Excel格式的市场预测(ME)表
- 3个月的分析师支持
目录
第一章 引言
- 研究假设和市场定义
- 调查范围
第二章调查方法
第三章执行摘要
第四章 市场情势
- 市场概览
- 人口统计数据
- 按经济活动分類的GDP分配
- 按经济活动分類的GDP成长
- 经济表现及概况
- 电子商务产业的趋势
- 製造业趋势
- 运输和仓储业的GDP
- 物流绩效
- 道路长度
- 出口趋势
- 进口趋势
- 燃油价格趋势
- 卡车运输营运成本
- 公路货运量趋势
- 公路货运费率趋势
- 按交通方式分享
- 通货膨胀
- 法律规范
- 价值炼和通路分析
- 市场驱动因素
- 美墨加协定和近岸外包推动美墨货运量激增
- 将生产转移回墨西哥以增加向北运输汽车零件
- 电子商务的成长推动了对限时跨境包裹运输的需求。
- 扩建CTPAT快速通道可减少边境延误
- 自动驾驶卡车测试正在I-45和I-35贸易路线上进行
- 人工智慧定价平台正悄悄重塑市场版图
- 市场限制
- 司机短缺推高公路货运费率
- 加拿大的碳定价体系增加了美国卡车司机的隐性成本。
- 加强边防安全可能会导致无法预测的等待时间。
- 野火引发的道路封闭导緻美国和加拿大的高速公路交通中断
- 市场创新
- 波特五力分析
- 新进入者的威胁
- 买方的议价能力
- 供应商的议价能力
- 替代品的威胁
- 竞争对手之间的竞争
第五章 市场规模与成长预测
- 终端用户产业
- 农业、渔业、林业
- 建造
- 製造业
- 石油天然气、采矿和采石
- 批发和零售
- 其他的
- 卡车装载规范
- 整车运输 (FTL)
- 小批量货物(零担)
- 货柜运输
- 货柜运输
- 非货柜运输
- 距离
- 长途
- 短程交通
- 货物类型
- 液体货物
- 固体货物
- 温度控制
- 非温控型
- 温度控制
第六章 竞争情势
- 市场集中度
- 关键策略倡议
- 市占率分析
- 公司简介
- ArcBest Corporation
- ATS(Anderson Trucking Service)
- Bay and Bay Transportation
- CH Robinson Worldwide, Inc.
- CR England
- Covenant Logistics Group, Inc.
- CRST The Transportation Solution, Inc.
- DHL Group
- DSV A/S(Including DB Schenker)
- Estes Express Lines
- FedEx
- JB Hunt Transport, Inc.
- Knight-Swift Transportation Holdings, Inc.(Including Swift Transportation Company)
- Landstar System, Inc.
- Old Dominion Freight Line
- Penske Corporation, Inc.
- R+L Carriers
- Ryder System, Inc.
- Schneider National, Inc.
- United Parcel Service of America, Inc.(UPS)
- Werner Enterprises, Inc.
- XPO, Inc.
第七章 市场机会与未来展望
The United States cross border road freight transport market is expected to grow from USD 211.51 billion in 2025 to USD 220.47 billion in 2026 and is forecast to reach USD 271.46 billion by 2031 at 4.24% CAGR over 2026-2031.
Nearshoring within the USMCA trade corridor, sustained e-commerce expansion, and large-scale infrastructure upgrades are reinforcing demand even as tighter security protocols and labor shortages test network agility. Mexico has overtaken China as the United States' largest trading partner, creating dense south-north truck lanes that now channel more than USD 3 billion in daily commerce, while Canada retains a vital but costlier role due to carbon-pricing regimes. Persistent driver scarcity, widening to a projected 160,000-person deficit by 2032, is pushing rates higher and accelerating technology adoption that boosts equipment utilization and pricing precision. Consolidation among top carriers, exemplified by DSV's purchase of DB Schenker and Ryder's acquisition push, is enabling scale efficiencies in cross-border dedicated fleets even as niche operators gain share in temperature-controlled and e-commerce-led LTL lanes. Autonomous truck pilots on the Interstate 45 and Interstate 35 corridors and AI-enabled pricing engines are lowering empty miles and rounding out 24/7 long-haul capacity, placing technology at the heart of competitive advantage.
United States Cross Border Road Freight Transport Market Trends and Insights
USMCA and Near-Shoring Fueling a Mexico-U.S. Freight Surge
USMCA provisions have catalyzed a USD 1.3 trillion trade corridor that funnels manufacturing exports from Mexico to the United States and has already drawn USD 46 billion in new investment commitments through 2027. Monthly truck crossings average 1.5 million units, a 166.3% jump versus pre-pandemic flows, overwhelming legacy border infrastructure and lifting carrier pricing power as northbound industrial freight pushes capacity limits. Demand for industrial space along the Mexican side has doubled since 2019, confirming manufacturers' preference for proximity over distant Asian supply chains. Automotive OEMs illustrate the multiplier effect: every USD 1 billion poured into Mexican assembly plants triggers sizable localized logistics demand that migrates north, reinforcing the growth arc of the United States cross border road freight transport market.
Reshoring Sparking Stronger Northbound Auto-Parts Traffic from Mexico
Automotive supply chains continue to retool as Asian component makers site new Mexican factories to preserve U.S. market access amid trade frictions, exemplified by a USD 400 million investment by Shanghai Unison in 2024. These additions skew lane balance, with northbound trailers commanding premium spot rates while southbound rates stagnate, complicating asset repositioning and elevating carrier margins on preferred directions. Semiconductor and battery firms mirror this footprint, further amplifying northbound tonnage. Real-time visibility platforms are now indispensable for cargo-theft mitigation and for orchestrating inbound origin docks with U.S. destination plants, sustaining the efficiency of the United States cross border road freight transport market.
Driver Shortages Driving Up Line-Haul Rates
The labor crunch could double to 160,000 vacant seats by 2032 as the cohort aged over 55 exits in greater numbers than new entrants replace them, pushing line-haul rates higher and eroding small-carrier resilience. FMCSA grants worth USD 48 million are widening CDL training pathways, yet cross-border work demands additional security clearances that limit candidate pools. Exemptions allowing learner-permit holders to operate in revenue service signal how urgently fleets must shore up capacity, and this constraint is the largest structural drag on the United States cross border road freight transport market.
Other drivers and restraints analyzed in the detailed report include:
- E-Commerce Growth Boosting Demand for Time-Definite Cross-Border LTL
- Expanded CTPAT FAST Lanes Reducing Border Delays
- Canadian Carbon Pricing Adding Hidden Costs for U.S. Carriers
For complete list of drivers and restraints, kindly check the Table Of Contents.
Segment Analysis
Manufacturing generated 32.14% of the United States cross border road freight transport market share in 2025, anchored by complex automotive and industrial supply chains that require dedicated FTL capacity and stringent just-in-time reliability. The United States cross border road freight transport market size tied to manufacturing lanes is projected to expand steadily as OEMs and tier suppliers deepen near-shoring investments, although incremental gains moderate due to commodity price swings affecting metals and plastics. Wholesale and retail trade volumes have begun to rise faster as cross-border e-commerce penetration propels shipment counts; the segment is forecast to log a 4.92% CAGR (2026-2031) as consumer-facing firms press for more frequent, smaller-lot deliveries.
Diversification across electronics, healthcare equipment, and agricultural perishables enriches the shipment mix, calling for wider equipment varieties and bolstering LTL and temperature-controlled sub-markets. Wholesale and retail trade players embrace blockchain-enabled customs filing to compress clearance windows, while auto makers expand digital twin modeling for lane optimization. Together, these shifts reinforce manufacturing's anchor role yet spotlight retail's growing pull on carrier network design across the United States cross border road freight transport market.
Non-containerized freight held 85.05% of the United States cross border road freight transport market share in 2025, powered by bulk commodities and oversized auto components that depend on direct truck service. Time-sensitive manufacturing cargo sidesteps rail handoffs, cementing trucking's modal advantage despite rising rail competitiveness.
Containerized freight is poised for a 4.82% CAGR (2026-2031) as intermodal services integrate blockchain-supported tracking that slashes document errors and enhances visibility. E-tailers importing fast-moving goods in 40-ft boxes are experimenting with truck-rail transloads along the U.S.-Mexico Gulf corridor, tempering highway lane congestion. Non-containerized dominance will hold through 2030, yet incremental intermodal penetration signals carriers must broaden asset portfolios to capture rising container drayage revenue within the United States cross border road freight transport market.
The United States Cross Border Road Freight Transport Market Report is Segmented by End User Industry (Construction and More), Truckload Specification (Full-Truck-Load (FTL) and More), Containerization (Containerized and More), Distance (Long Haul and Short Haul), Goods Configuration (Fluid Goods and Solid Goods), and Temperature Control (Temperature Controlled and More). The Market Forecasts are Provided in Terms of Value (USD).
List of Companies Covered in this Report:
- ArcBest Corporation
- ATS (Anderson Trucking Service)
- Bay and Bay Transportation
- C.H. Robinson Worldwide, Inc.
- C.R. England
- Covenant Logistics Group, Inc.
- CRST The Transportation Solution, Inc.
- DHL Group
- DSV A/S (Including DB Schenker)
- Estes Express Lines
- FedEx
- J.B. Hunt Transport, Inc.
- Knight-Swift Transportation Holdings, Inc. (Including Swift Transportation Company)
- Landstar System, Inc.
- Old Dominion Freight Line
- Penske Corporation, Inc.
- R+L Carriers
- Ryder System, Inc.
- Schneider National, Inc.
- United Parcel Service of America, Inc. (UPS)
- Werner Enterprises, Inc.
- XPO, Inc.
Additional Benefits:
- The market estimate (ME) sheet in Excel format
- 3 months of analyst support
TABLE OF CONTENTS
1 Introduction
- 1.1 Study Assumptions and Market Definition
- 1.2 Scope of the Study
2 Research Methodology
3 Executive Summary
4 Market Landscape
- 4.1 Market Overview
- 4.2 Demographics
- 4.3 GDP Distribution by Economic Activity
- 4.4 GDP Growth by Economic Activity
- 4.5 Economic Performance and Profile
- 4.5.1 Trends in E-Commerce Industry
- 4.5.2 Trends in Manufacturing Industry
- 4.6 Transport and Storage Sector GDP
- 4.7 Logistics Performance
- 4.8 Length of Roads
- 4.9 Export Trends
- 4.10 Import Trends
- 4.11 Fuel Pricing Trends
- 4.12 Trucking Operational Costs
- 4.13 Road Freight Tonnage Trends
- 4.14 Road Freight Pricing Trends
- 4.15 Modal Share
- 4.16 Inflation
- 4.17 Regulatory Framework
- 4.18 Value Chain and Distribution Channel Analysis
- 4.19 Market Drivers
- 4.19.1 USMCA and Near-Shoring Fueling a Mexico-U.S. Freight Surge
- 4.19.2 Reshoring Sparking Stronger Northbound Auto-Parts Traffic From Mexico
- 4.19.3 E-Commerce Growth Boosting Demand for Time-Definite Cross-Border LTL
- 4.19.4 Expanded CTPAT FAST Lanes Reducing Border Delays
- 4.19.5 Autonomous Truck Trials Gaining Traction on I-45 and I-35 Trade Routes
- 4.19.6 AI-Powered Pricing Platforms Quietly Reshaping the Market
- 4.20 Market Restraints
- 4.20.1 Driver Shortages Driving Up Line-Haul Rates
- 4.20.2 Canadian Carbon Pricing Adding Hidden Costs for U.S. Carriers
- 4.20.3 Heightened Border Security Creating Unpredictable Wait Times
- 4.20.4 Wildfire-Related Closures Disrupting U.S.-Canada Highway Routes
- 4.21 Technology Innovations in the Market
- 4.22 Porter's Five Forces Analysis
- 4.22.1 Threat of New Entrants
- 4.22.2 Bargaining Power of Buyers
- 4.22.3 Bargaining Power of Suppliers
- 4.22.4 Threat of Substitutes
- 4.22.5 Competitive Rivalry
5 Market Size and Growth Forecasts (Value, USD)
- 5.1 End User Industry
- 5.1.1 Agriculture, Fishing, and Forestry
- 5.1.2 Construction
- 5.1.3 Manufacturing
- 5.1.4 Oil and Gas, Mining and Quarrying
- 5.1.5 Wholesale and Retail Trade
- 5.1.6 Others
- 5.2 Truckload Specification
- 5.2.1 Full-Truck-Load (FTL)
- 5.2.2 Less than-Truck-Load (LTL)
- 5.3 Containerization
- 5.3.1 Containerized
- 5.3.2 Non-Containerized
- 5.4 Distance
- 5.4.1 Long Haul
- 5.4.2 Short Haul
- 5.5 Goods Configuration
- 5.5.1 Fluid Goods
- 5.5.2 Solid Goods
- 5.6 Temperature Control
- 5.6.1 Non-Temperature Controlled
- 5.6.2 Temperature Controlled
6 Competitive Landscape
- 6.1 Market Concentration
- 6.2 Key Strategic Moves
- 6.3 Market Share Analysis
- 6.4 Company Profiles (Includes Global Level Overview, Market Level Overview, Core Segments, Financials as Available, Strategic Information, Market Rank/Share for Key Companies, Products and Services, and Recent Developments)
- 6.4.1 ArcBest Corporation
- 6.4.2 ATS (Anderson Trucking Service)
- 6.4.3 Bay and Bay Transportation
- 6.4.4 C.H. Robinson Worldwide, Inc.
- 6.4.5 C.R. England
- 6.4.6 Covenant Logistics Group, Inc.
- 6.4.7 CRST The Transportation Solution, Inc.
- 6.4.8 DHL Group
- 6.4.9 DSV A/S (Including DB Schenker)
- 6.4.10 Estes Express Lines
- 6.4.11 FedEx
- 6.4.12 J.B. Hunt Transport, Inc.
- 6.4.13 Knight-Swift Transportation Holdings, Inc. (Including Swift Transportation Company)
- 6.4.14 Landstar System, Inc.
- 6.4.15 Old Dominion Freight Line
- 6.4.16 Penske Corporation, Inc.
- 6.4.17 R+L Carriers
- 6.4.18 Ryder System, Inc.
- 6.4.19 Schneider National, Inc.
- 6.4.20 United Parcel Service of America, Inc. (UPS)
- 6.4.21 Werner Enterprises, Inc.
- 6.4.22 XPO, Inc.
7 Market Opportunities and Future Outlook
- 7.1 White-space and Unmet-need Assessment

