


 |
市场调查报告书
商品编码
1940706
非洲玻璃瓶和容器:市场份额分析、行业趋势和统计数据、成长预测(2026-2031 年)Africa Glass Bottles And Containers - Market Share Analysis, Industry Trends & Statistics, Growth Forecasts (2026 - 2031) |
||||||
※ 本网页内容可能与最新版本有所差异。详细情况请与我们联繫。
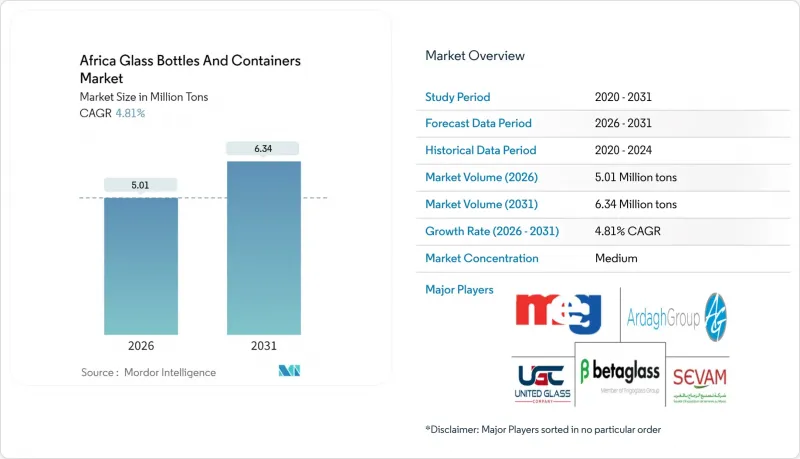
2025年非洲玻璃瓶和容器市场价值为478万吨,预计从2026年的501万吨增长到2031年的634万吨,在预测期(2026-2031年)内复合年增长率为4.81%。
饮料消费的加速成长、可再生材料监管的日益严格以及都市区的壮大,共同支撑着市场成长;同时,非洲大陆自由贸易协定(AfCFTA)带来的贸易便利化,也推动了高端包装产品的潜在供应和出口成长。儘管市场竞争较为温和,熔炉产能主要由少数区域领导企业掌控,但新参与企业正利用技术创新和在地化供应链来拓展市场。儘管能源价格和外汇波动带来了日益增长的成本压力,但终端用户的偏好正逐渐转向透明、轻盈、高端的玻璃瓶,以强化品牌形象。在此背景下,非洲玻璃瓶和容器市场持续超越整体包装产业的成长轨迹,巩固了其作为饮料、食品和化妆品品牌提升产品品质和永续性策略管道的地位。
非洲玻璃瓶及容器市场趋势及洞察
饮料消费量不断增长,对高檔包装的需求也随之增加。
2021年,非洲饮料产量达到1.41亿百公升,以7%的成长率超越其他地区。这一产量成长推动了非洲玻璃瓶及容器市场的扩张,其主要驱动力来自跨国装瓶商的日益增多以及当地精酿啤酒厂包装品质的提升。光是南非一国就生产了3,100万百升,并新增了一条酿造生产线,以满足高端拉格啤酒的生产需求。同时,可口可乐饮料非洲公司在纳米比亚投资5,000万美元,使其玻璃瓶产能提升30%,达到每小时2.7万瓶。透明度、重量和产品真实性等高端因素促使消费者在都市区通路更倾向于选择玻璃瓶而非PET瓶。同样,这些特性也有助于延长透过低关税的非洲大陆自由贸易区(AfCFTA)出口的酒精饮料的保质期。因此,品牌拥有者将非洲玻璃瓶及容器市场视为一种能够提升利润且符合其永续性的包装选择。
监管机构推动使用食品级、可回收包装
在关键地区,生产者延伸责任制(EPR)法规正在不断加强,优先考虑闭合迴路包装的材料选择。南非的EPR框架于2021年5月生效,目标是到2026年达到65%的玻璃回收率。肯亚紧随其后,于2022年颁布了《永续废弃物管理法》,强制要求透过由环境管理局(NEMA)监督的四年计画来落实该法规。摩洛哥的ONSSA标准要求食品包装上使用双语标籤,而埃及的合格评定计划则包括对进口产品进行上市前检验。玻璃天然符合可回收性阈值,并且避免了塑胶面临的迁移风险,确保了其长期效用。产业协会FEVE支持此政策方向,并强调设计完善的EPR系统能够比押金制度实现更高的闭合迴路回收率。
轻质PET和铝製容器的普及
轻质宝特瓶和铝罐的市场份额正在被蚕食,由于运输和处理成本降低,它们受到成本压力较大的饮料填充商的青睐。尼日利亚的经济动盪促使多家跨国公司采用更便宜的材料,例如,一些主要碳酸饮料品牌近期调整了产品组合。如今,阻隔涂层PET的氧气透过率接近玻璃,而罐体製造商正利用现有的回收网络,将铝定位为一种循环利用的选择。玻璃製造商也推出了轻量化创新产品,例如180克装的酒瓶,但大规模生产的规模化难度和资本密集度限制了其快速扩张。这种拉锯战限制了非洲玻璃瓶和容器市场近期的成长前景。
细分市场分析
到2025年,饮料业将占非洲玻璃瓶和容器市场的62.12%,其中啤酒、葡萄酒和碳酸饮料是推动总产量成长的主要因素,因为它们优先考虑材料的阻隔性能和高端展示效果。啤酒仍是最大的消费品类,主要得益于南非3,100万百公升的年产量和奈及利亚不断扩大的产能。同时,烈酒生产商使用厚重的燧石瓶来强化品牌形象。碳酸饮料生产商正在投资可回收玻璃容器的循环系统,以满足消费者对永续性的期望并保护饮料的风味。
预计到2031年,化妆品和个人护理品产业将以5.14%的复合年增长率成长,成为终端用户中成长最快的产业,而其基准较低。可支配收入的成长推动了对装在精美透明和彩色玻璃容器中的精华液、香水和高价值护肤品的需求。内罗毕和约翰尼斯堡的本土美妆企业家正在采用小瓶包装以方便电商配送,这进一步刺激了非洲玻璃瓶和容器市场的需求。食品、医药和化学工业的需求保持稳定但相对小规模,这反映了优先考虑本地生产的监管规定和库存策略。
非洲玻璃瓶和容器市场报告按最终用户(饮料[酒精饮料(啤酒、葡萄酒、烈酒等)、非酒精饮料(碳酸软性饮料(CSD)、乳製品饮料等)]、食品[果酱、果冻、调味品、酱料等]、化妆品和个人护理用品等)、颜色(无色、琥珀色、绿色等)和国家/地区进行细分。市场预测以吨为单位。
其他福利:
- Excel格式的市场预测(ME)表
- 3个月的分析师支持
目录
第一章 引言
- 研究假设和市场定义
- 调查范围
第二章调查方法
第三章执行摘要
第四章 市场情势
- 市场概览
- 市场驱动因素
- 饮料消费量不断增长,对高檔包装的需求也随之增加。
- 力推食品级、可回收包装
- 都市区中产阶级的壮大推动了啤酒和碳酸饮料消费量的成长。
- 非洲大陆自由贸易区(AfCFTA)内玻璃包装产品的区域内贸易趋势
- 精酿酒精和手工烈酒的蓬勃发展(对高檔玻璃製品的短期需求)
- 欧盟碳边境调节机制(CBAM)对低碳出口包装施加压力
- 市场限制
- 轻质PET和铝製容器的普及
- 高能源投入与电力可靠性成本
- 玻璃屑收集和回收基础设施不足
- 外汇波动风险与碱灰进口关税
- 产业供应链分析
- 非洲容器玻璃熔炉产能及位置
- 工厂选址及投产
- 生产能力
- 炉型
- 所产玻璃的颜色
- 货柜玻璃进出口资料-涵盖主要进出口目的地
- 进口量及进口额(2021-2024 年)
- 出口量/出口额(2021-2024)
- 波特五力分析
- 新进入者的威胁
- 供应商的议价能力
- 买方的议价能力
- 替代品的威胁
- 竞争对手之间的竞争
- 原料分析
- 玻璃包装的回收趋势
- 玻璃包装需求与供给分析
第五章 市场规模与成长预测
- 最终用户
- 饮料
- 酒精饮料
- 啤酒
- 葡萄酒
- 烈酒
- 其他酒精饮料(苹果酒和其他发酵饮料)
- 不含酒精的饮料
- 果汁
- 碳酸软性饮料(CSD)
- 乳製品饮料
- 其他非酒精饮料
- 酒精饮料
- 食品(果酱、果冻、橘子酱、蜂蜜、香肠、调味品、食用油、腌菜)
- 化妆品和个人保健产品
- 药品(不含管瓶和安瓿瓶)
- 香水
- 饮料
- 按颜色
- 绿色的
- 琥珀色
- 无色透明
- 其他颜色
- 按国家/地区
- 埃及
- 奈及利亚
- 肯亚
- 摩洛哥
- 南非
- 其他非洲地区
第六章 竞争情势
- 市场集中度
- 策略趋势与发展
- 公司市占率分析(基于当前产能)
- 公司简介
- Ardagh Group SA
- Middle East Glass Manufacturing Company SAE
- Beta Glass PLC
- Isanti Glass 1(Pty)Ltd
- Kandil Glass
- Saverglass SAS
- Consol Glass Pty Ltd
- African Glass Limited
- The National Company for Glass and Crystal SAE
- Verallia Packaging SAS
- Gerresheimer AG
- Arab Pharmaceutical Glass Company SAE
- Dalgen Packaging CC
- Nampak Limited
- OI Glass, Inc.
- United Glass Containers Company(UGC)
- Societe d'Exploitation de Verreries au Maroc(SEVAM)
第七章 市场机会与未来展望
The Africa Glass Bottles And Containers Market was valued at 4.78 Million tons in 2025 and estimated to grow from 5.01 Million tons in 2026 to reach 6.34 Million tons by 2031, at a CAGR of 4.81% during the forecast period (2026-2031).
Accelerating beverage consumption, regulatory momentum for recyclable materials, and an expanding urban middle-class underpin the upswing, while trade facilitation under AfCFTA broadens addressable volumes and premium-packaged export flows. Competitive intensity remains moderate because a handful of regional leaders control furnace capacity, yet new entrants leverage technological upgrades and localized supply chains to chip away at incumbents. End-user preferences increasingly tilt toward clear and lightweight premium bottles that reinforce brand image, even as energy prices and foreign-exchange volatility add cost pressure. Against this backdrop, the Africa glass bottles and containers market continues to outpace overall packaging growth trajectories, confirming its role as a strategic channel for beverage, food, and cosmetics brands aiming to signal product quality and sustainability.
Africa Glass Bottles And Containers Market Trends and Insights
Rising beverage consumption and premium-packaging demand
Africa's beverage output hit 141 million hectoliters in 2021, a 7% jump that outpaced all other regions. This volume growth anchors the expansion of the Africa glass bottles and containers market as multinational bottlers deepen footprints and local craft brewers upgrade presentation. South Africa alone produced 31 million hectoliters and has added new brewing lines to support premium lager variants, while Coca-Cola Beverages Africa invested USD 50 million in Namibia to lift throughput 30% at 27,000 bph, all packed in glass.Premium cues tied to clarity, weight, and perceived product integrity nudge consumers toward glass over PET in urban channels, and the same attributes bolster shelf-life for alcohol exports that now traverse tariff-light AfCFTA corridors. Consequently, brand owners view the Africa glass bottles and containers market as a margin-accretive packaging choice that aligns with sustainability commitments.
Regulatory push for food-grade, recyclable packaging
Extended Producer Responsibility (EPR) rules are tightening across key geographies, reshaping material selection in favor of closed-loop compatible containers. South Africa's EPR framework became effective in May 2021 and targets a 65% glass-recycling rate by 2026. Kenya followed with the Sustainable Waste Management Act 2022, mandating four-year compliance plans overseen by NEMA. Morocco's ONSSA standards require food-grade packaging with bilingual labeling, while Egypt's conformity program screens imports before market entry. Glass naturally satisfies recyclability thresholds and avoids migration risks that plastics face, cementing its long-term relevance. Industry association FEVE underscores that well-designed EPR schemes deliver higher closed-loop rates than deposit systems, validating policy direction.
Proliferation of PET and aluminium lightweight formats
Lightweight PET bottles and aluminum cans erode share by offering freight and handling savings that resonate with cost-squeezed beverage fillers. Economic turbulence in Nigeria prompted several multinationals to opt for cheaper substrates, an example being recent portfolio shifts by large CSD brands. Barrier-coated PET now achieves near-glass oxygen transmission rates, while can-makers leverage established recycling networks to position aluminum as a circular option. Glass suppliers counter with lightweighting breakthroughs such as 180 g spirit bottles, yet mass-production scalability and capital intensity temper rapid rollouts. The tug-of-war narrows the short-term growth outlook for the Africa glass bottles and containers market.
Other drivers and restraints analyzed in the detailed report include:
- Urban middle-class expansion boosting beer and CSD volumes
- AfCFTA-driven intra-Africa trade in glass-packaged goods
- High energy-input and power-reliability costs
For complete list of drivers and restraints, kindly check the Table Of Contents.
Segment Analysis
Beverage applications captured 62.12% of the Africa glass bottles and containers market size in 2025, underpinning overall tonnage because beer, wine, and carbonated drinks prize the material's barrier performance and premium shelf appeal. Beer remains the largest consumer on the back of South Africa's 31 million hectoliters output and Nigeria's capacity additions, while spirits leverage heavy flint bottles to reinforce brand stature. Carbonated soft-drink bottlers are investing in returnable-glass loops to align with consumer sustainability expectations and to safeguard flavor integrity.
Cosmetics and personal care, though starting from a lower baseline, are forecast to grow at a 5.14% CAGR through 2031, the fastest among end-users. Rising disposable incomes spur demand for serums, fragrances, and high-value skincare packaged in ornate flint or colored glass. Local beauty entrepreneurs in Nairobi and Johannesburg adopt smaller bottle formats to facilitate e-commerce fulfillment, creating ancillary demand pockets within the Africa glass bottles and containers market. Food, pharmaceutical, and chemical niches provide stable but comparatively lower volumes, reflecting regulated specifications and inventory strategies favoring local production runs.
The Africa Glass Bottles and Containers Market Report is Segmented by End-User (Beverages [Alcoholic {Beer, Wine, Spirits, and More}, and Non-Alcoholic {Carbonated Drinks (CSDs), Dairy Product Based Drinks, and More}], Food [Jam and Jelly, Condiments and Sauces, and More], Cosmetics and Personal Care, and More), Color (Flint, Amber, Green, and More) and Country. The Market Forecasts are Provided in Terms of Volume (Tons).
List of Companies Covered in this Report:
- Ardagh Group S.A.
- Middle East Glass Manufacturing Company S.A.E.
- Beta Glass PLC
- Isanti Glass 1 (Pty) Ltd
- Kandil Glass
- Saverglass SAS
- Consol Glass Pty Ltd
- African Glass Limited
- The National Company for Glass and Crystal S.A.E.
- Verallia Packaging S.A.S.
- Gerresheimer AG
- Arab Pharmaceutical Glass Company S.A.E.
- Dalgen Packaging CC
- Nampak Limited
- O-I Glass, Inc.
- United Glass Containers Company (UGC)
- Societe d'Exploitation de Verreries au Maroc (SEVAM)
Additional Benefits:
- The market estimate (ME) sheet in Excel format
- 3 months of analyst support
TABLE OF CONTENTS
1 INTRODUCTION
- 1.1 Study Assumptions and Market Definition
- 1.2 Scope of the Study
2 RESEARCH METHODOLOGY
3 EXECUTIVE SUMMARY
4 MARKET LANDSCAPE
- 4.1 Market Overview
- 4.2 Market Drivers
- 4.2.1 Rising beverage consumption and premium-packaging demand
- 4.2.2 Regulatory push for food-grade, recyclable packaging
- 4.2.3 Urban middle-class expansion boosting beer and CSD volumes
- 4.2.4 AfCFTA-driven intra-Africa trade in glass-packaged goods
- 4.2.5 Craft alcohol and artisan spirits boom (short-run premium glass)
- 4.2.6 EU CBAM pressure on low-carbon export packaging
- 4.3 Market Restraints
- 4.3.1 Proliferation of PET and aluminium lightweight formats
- 4.3.2 High energy-input and power-reliability costs
- 4.3.3 Poor cullet-collection and recycling infrastructure
- 4.3.4 FX volatility and soda-ash import tariffs
- 4.4 Industry Supply-Chain Analysis
- 4.5 Container Glass Furnace Capacity and Locations in Africa
- 4.5.1 Plant Locations and Year of Commencement
- 4.5.2 Production Capacities
- 4.5.3 Types of Furnaces
- 4.5.4 Color of Glass Produced
- 4.6 Export-Import Data of Container Glass - Covering Key Import and Export Destinations
- 4.6.1 Import Volume & Value, 2021-2024
- 4.6.2 Export Volume & Value, 2021-2024
- 4.7 Porter's Five Forces Analysis
- 4.7.1 Threat of New Entrants
- 4.7.2 Bargaining Power of Suppliers
- 4.7.3 Bargaining Power of Buyers
- 4.7.4 Threat of Substitutes
- 4.7.5 Competitive Rivalry
- 4.8 Raw Material Analysis
- 4.9 Recycling Trends for Glass Packaging
- 4.10 Demand vs Supply Analysis for Glass Packaging
5 MARKET SIZE AND GROWTH FORECASTS (VOLUME)
- 5.1 By End-user
- 5.1.1 Beverages
- 5.1.1.1 Alcoholic
- 5.1.1.1.1 Beer
- 5.1.1.1.2 Wine
- 5.1.1.1.3 Spirits
- 5.1.1.1.4 Other Alcoholic Beverages (Cider and Other Fermented Drinks)
- 5.1.1.2 Non-Alcoholic
- 5.1.1.2.1 Juices
- 5.1.1.2.2 Carbonated Drinks (CSDs)
- 5.1.1.2.3 Dairy Product Based Drinks
- 5.1.1.2.4 Other Non-Alcoholic Beverages
- 5.1.1.1 Alcoholic
- 5.1.2 Food (Jam, Jelly, Marmalades, Honey, Sausages and Condiments, Oil, Pickles)
- 5.1.3 Cosmetics and Personal Care
- 5.1.4 Pharmaceuticals (excluding Vials and Ampoules)
- 5.1.5 Perfumery
- 5.1.1 Beverages
- 5.2 By Color
- 5.2.1 Green
- 5.2.2 Amber
- 5.2.3 Flint
- 5.2.4 Other Colors
- 5.3 By Country
- 5.3.1 Egypt
- 5.3.2 Nigeria
- 5.3.3 Kenya
- 5.3.4 Morocco
- 5.3.5 South Africa
- 5.3.6 Rest of Africa
6 COMPETITIVE LANDSCAPE
- 6.1 Market Concentration
- 6.2 Strategic Moves and Developments
- 6.3 Company Market Share Analysis, (Based on Latest Production Capacity)
- 6.4 Company Profiles (includes Global level Overview, Market level overview, Core Segments, Financials as available, Strategic Information, Market Rank/Share for key companies, Products and Services, and Recent Developments)
- 6.4.1 Ardagh Group S.A.
- 6.4.2 Middle East Glass Manufacturing Company S.A.E.
- 6.4.3 Beta Glass PLC
- 6.4.4 Isanti Glass 1 (Pty) Ltd
- 6.4.5 Kandil Glass
- 6.4.6 Saverglass SAS
- 6.4.7 Consol Glass Pty Ltd
- 6.4.8 African Glass Limited
- 6.4.9 The National Company for Glass and Crystal S.A.E.
- 6.4.10 Verallia Packaging S.A.S.
- 6.4.11 Gerresheimer AG
- 6.4.12 Arab Pharmaceutical Glass Company S.A.E.
- 6.4.13 Dalgen Packaging CC
- 6.4.14 Nampak Limited
- 6.4.15 O-I Glass, Inc.
- 6.4.16 United Glass Containers Company (UGC)
- 6.4.17 Societe d'Exploitation de Verreries au Maroc (SEVAM)
7 MARKET OPPORTUNITIES AND FUTURE OUTLOOK
- 7.1 White-space and Unmet-Need Assessment
 玻璃瓶和容器:市场份额分析、行业趋势和统计数据、成长预测(2026-2031)
 玻璃瓶和容器市场规模、份额和成长分析(按产品、应用、颜色、最终用途产业和地区划分)—产业预测(2026-2033 年)
 2025-2029年全球玻璃瓶与容器市场英国玻璃瓶和容器:市场占有率分析、行业趋势和成长预测(2025-2030 年)中东和非洲玻璃瓶和容器市场占有率分析、行业趋势、统计数据和成长预测(2025-2030)亚太地区玻璃瓶和容器:市场占有率分析、行业趋势和统计、成长预测(2025-2030 年)拉丁美洲玻璃瓶和容器:市场占有率分析、行业趋势和成长预测(2025-2030)欧洲玻璃瓶和容器:市场占有率分析、行业趋势和成长预测(2025-2030)
 玻璃瓶及容器市场机会、成长动力、产业趋势分析及 2025 - 2034 年预测
 全球玻璃瓶和容器市场