


 |
市场调查报告书
商品编码
1876642
食品包装回收市场机会、成长驱动因素、产业趋势分析及预测(2025-2034年)Food Packaging Recycling Market Opportunity, Growth Drivers, Industry Trend Analysis, and Forecast 2025 - 2034 |
||||||
2024 年全球食品包装回收市场价值为 951 亿美元,预计到 2034 年将以 6.5% 的复合年增长率增长至 1,783 亿美元。
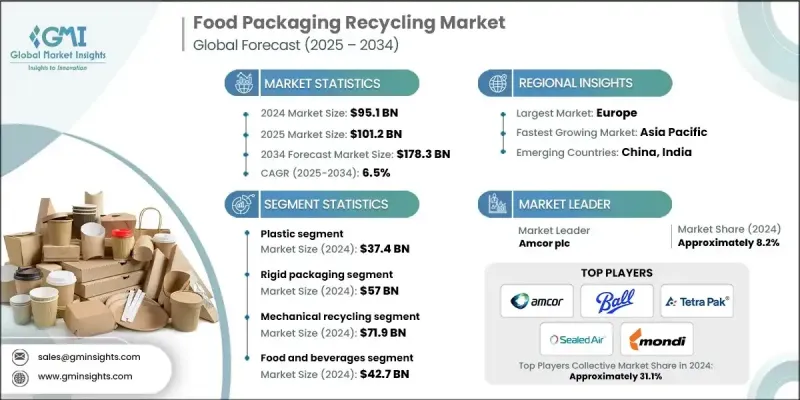
市场扩张的驱动力来自日益增长的监管压力和生产者延伸责任制(EPR)计划的实施,这些措施促使製造商在其包装中增加再生材料的使用。企业正积极履行雄心勃勃的永续发展承诺,从而增加对收集基础设施、分类能力和先进回收技术的投资。同时,大众环保意识的提高也增强了人们参与回收工作的积极性,进而强化了对可回收食品包装形式和改良型加工系统的需求。机械和化学回收技术的创新正在加速这一进程,使以往难以回收的包装材料(例如多层结构和柔性薄膜)能够更有效地回收。简化和统一包装设计的努力也有助于提高回收率。因此,在技术应用、利害关係人合作加强以及食品包装生态系统向循环经济模式转变的推动下,市场正保持稳定成长的势头。
| 市场范围 | |
|---|---|
| 起始年份 | 2024 |
| 预测年份 | 2025-2034 |
| 起始值 | 951亿美元 |
| 预测值 | 1783亿美元 |
| 复合年增长率 | 6.5% |
2024年塑胶市场规模达374亿美元,预计2025年至2034年将以10.9%的复合年增长率成长。塑胶、纸张、玻璃和金属的回收率不断提高,推动了这一成长,因为各行业和监管机构都在努力减少废弃物。由于塑胶用途广泛且处理复杂,因此仍然是关注的焦点。对化学和机械回收的投资正在提高将PET和聚烯烃加工成食品级材料的能力。在强大的回收网络和纤维基替代品日益普及的推动下,纸张和纸板的市场份额持续增长。
2024年,硬质包装市场规模达到570亿美元,预计2034年将以6.5%的复合年增长率成长。玻璃罐、金属罐、PET瓶和HDPE容器等硬质包装材料都受惠于成熟的回收系统。食品和饮料生产商正在硬包装中更多地使用回收材料,以满足永续发展标准,同时,改进的清洗、造粒和去污系统也提高了材料品质。
北美食品包装回收市场在2024年创造了282亿美元的规模,并有望在预测期内保持强劲成长。该地区正透过支持性法规、企业社会责任措施和完善的废弃物管理网络,不断强化其回收体系。机械和化学回收能力的提升以及可回收性设计实践的改进,正在推动各类包装(尤其是硬质包装)的闭环回收系统发展。
全球食品包装回收市场的主要参与者包括安姆科公司(Amcor plc)、蒙迪集团(Mondi Group)、波尔公司(Ball Corporation)、利乐公司(Tetra Pak)和希悦尔公司(Sealed Air Corporation)。食品包装回收市场的企业正在实施多项策略以增强其竞争优势。许多公司正在增加对下一代回收技术的投资,包括先进的机械和化学系统,这些系统能够提高回收品质并更好地处理复杂材料。企业也与废弃物管理供应商和消费品品牌合作,建立闭环供应链,以提高材料回收率。扩大回收基础设施,例如改善分类自动化和升级收集网络,是另一个重点工作。企业正在重新设计包装,以提高其可回收性,同时符合监管要求和永续发展目标。
目录
第一章:方法论
- 市场范围和定义
- 研究设计
- 研究方法
- 资料收集方法
- 资料探勘来源
- 全球的
- 地区/国家
- 基准估算和计算
- 基准年计算
- 市场估算的关键趋势
- 初步研究和验证
- 原始资料
- 预测模型
- 研究假设和局限性
第二章:执行概要
第三章:行业洞察
- 产业生态系分析
- 供应商格局
- 利润率
- 每个阶段的价值增加
- 影响价值链的因素
- 中断
- 产业影响因素
- 成长驱动因素
- 加强实施生产者延伸责任制(EPR)政策
- 强而有力的企业永续发展和再生材料使用承诺
- 消费者对环境影响的意识日益增强
- 扩大回收基础设施和产能
- 产业陷阱与挑战
- 食品包装废弃物污染
- 多层和混合材料包装的复杂性
- 隔离、收集和分类系统不足
- 市场机会
- 扩大化学回收规模,以处理难以处理的包装类型
- 建立稳健的食品级rPET和再生聚烯烃供应链
- 提供可回收设计咨询及认证服务
- 对区域回收基础设施的投资和併购
- 成长驱动因素
- 成长潜力分析
- 监管环境
- 北美洲
- 欧洲
- 亚太地区
- 拉丁美洲
- 中东和非洲
- 波特的分析
- PESTEL 分析
- 价格趋势
- 按地区
- 副产品
- 未来市场趋势
- 技术与创新格局
- 当前技术趋势
- 新兴技术
- 专利格局
- 贸易统计(註:仅提供重点国家的贸易统计)
- 主要进口国
- 主要出口国
- 永续性和环境方面
- 永续实践
- 减少废弃物策略
- 生产中的能源效率
- 环保倡议
- 碳足迹考量
第四章:竞争格局
- 介绍
- 公司市占率分析
- 按地区
- 北美洲
- 欧洲
- 亚太地区
- 拉丁美洲
- MEA
- 按地区
- 公司矩阵分析
- 主要市场参与者的竞争分析
- 竞争定位矩阵
- 关键进展
- 併购
- 合作伙伴关係与合作
- 新产品发布
- 扩张计划
第五章:市场估算与预测:依材料类型划分,2021-2034年
- 主要趋势
- 塑胶
- PET(聚对苯二甲酸乙二酯)
- HDPE(高密度聚乙烯)
- 低密度聚乙烯(LDPE)
- PP(聚丙烯)
- 聚苯乙烯
- 多层塑胶
- 纸和纸板
- 瓦楞纸板
- 纸板
- 牛皮纸
- 金属
- 铝
- 钢
- 玻璃
- 可生物降解/生物基材料
- PLA(聚乳酸)
- 淀粉基塑料
- 其他的
第六章:市场估价与预测:依包装形式划分,2021-2034年
- 主要趋势
- 硬质包装
- 瓶子和罐子
- 托盘
- 罐头
- 盒子
- 软包装
- 小袋
- 捲饼
- 电影
- 小袋
- 其他的
第七章:市场估算与预测:依回收流程划分,2021-2034年
- 主要趋势
- 机械回收
- 化学回收
- 热解
- 解聚
- 生物回收
- 堆肥(用于可生物降解包装)
- 能量回收
- 焚烧与能量捕获
- 其他的
第八章:市场估算与预测:依最终用途产业划分,2021-2034年
- 主要趋势
- 食品和饮料
- 乳製品
- 烘焙和糖果
- 肉类、家禽和海鲜
- 即食餐
- 水果和蔬菜
- 饮料(非酒精饮料和酒精饮料)
- 餐饮服务
- 速食店(QSR)
- 自助餐厅
- 餐饮服务
- 零售与电子商务
- 机构使用
- 医院
- 学校
- 政府设施
- 其他的
第九章:市场估计与预测:依地区划分,2021-2034年
- 主要趋势
- 北美洲
- 我们
- 加拿大
- 欧洲
- 德国
- 英国
- 法国
- 义大利
- 西班牙
- 欧洲其他地区
- 亚太地区
- 中国
- 印度
- 日本
- 澳洲
- 韩国
- 亚太其他地区
- 拉丁美洲
- 巴西
- 墨西哥
- 阿根廷
- 拉丁美洲其他地区
- 中东和非洲
- 沙乌地阿拉伯
- 南非
- 阿联酋
- 中东和非洲其他地区
第十章:公司简介
- Amcor plc
- Mondi Group
- Tetra Pak
- Sealed Air Corporation
- Ball Corporation
- Constantia Flexibles
- MULTIVAC Group
- Clear Path Recycling
- Clean Tech Incorporated
- CarbonLite Industries
- BioPak
- EcoEnclose
- Elevate Packaging
- TC Transcontinental Packaging
- International Paper Company
The Global Food Packaging Recycling Market was valued at USD 95.1 billion in 2024 and is estimated to grow at a CAGR of 6.5% to reach USD 178.3 billion by 2034.
Market expansion is fueled by rising regulatory pressure and the implementation of Extended Producer Responsibility programs, which are prompting manufacturers to increase the use of recycled content in their packaging. Companies are pursuing ambitious sustainability commitments, leading to higher investments in collection infrastructure, sorting capabilities, and advanced recycling technologies. At the same time, public awareness of environmental concerns has strengthened participation in recycling efforts, reinforcing demand for recyclable food packaging formats and improved processing systems. Innovations in mechanical and chemical recycling are accelerating progress, enabling previously difficult packaging materials-such as multilayer structures and flexible films-to be recycled more effectively. Efforts to simplify and harmonize packaging designs are also supporting higher recovery rates. As a result, the market is experiencing steady momentum driven by technology adoption, stronger stakeholder collaboration, and a clear shift toward circularity in the food packaging ecosystem.
| Market Scope | |
|---|---|
| Start Year | 2024 |
| Forecast Year | 2025-2034 |
| Start Value | $95.1 Billion |
| Forecast Value | $178.3 Billion |
| CAGR | 6.5% |
The plastic segment reached USD 37.4 billion in 2024 and is expected to grow at a 10.9% CAGR from 2025 to 2034. Growth is supported by the rising recovery of plastics, paper, glass, and metal as industries and regulators work toward minimizing waste. Plastics remain a primary focus due to their widespread use and the complexities of disposal. Investments in both chemical and mechanical recycling are improving the ability to process PET and polyolefins into food-grade materials. Paper and paperboard continue to gain market share, supported by strong recycling networks and increasing adoption of fiber-based alternatives.
The rigid packaging segment was valued at USD 57 billion in 2024 and is anticipated to grow at a 6.5% CAGR through 2034. Rigid formats benefit from well-established recycling streams for glass jars, metal cans, PET bottles, and HDPE containers. Food and beverage producers are incorporating more recycled inputs into rigid packaging to meet sustainability standards, supported by enhanced washing, pelletizing, and decontamination systems that improve material quality.
North America Food Packaging Recycling Market generated USD 28.2 billion in 2024 and is positioned for strong growth over the forecast period. The region is strengthening its recycling landscape through supportive regulations, corporate responsibility initiatives, and established waste management networks. Expanding mechanical and chemical recycling capacity and improved design-for-recyclability practices are advancing closed-loop systems across packaging categories, especially in rigid formats.
Key participants in the Global Food Packaging Recycling Market include Amcor plc, Mondi Group, Ball Corporation, Tetra Pak, and Sealed Air Corporation. Companies in the food packaging recycling market are implementing several strategies to reinforce their competitive advantage. Many firms are scaling investments in next-generation recycling technologies, including advanced mechanical and chemical systems that enable higher-quality output and better processing of complex materials. Organizations are also partnering with waste management providers and consumer goods brands to build closed-loop supply chains that enhance material recovery. Expansion of recycling infrastructure, such as improved sorting automation and upgraded collection networks, is another key priority. Businesses are redesigning packaging to improve recyclability while aligning with regulatory requirements and sustainability goals.
Table of Contents
Chapter 1 Methodology
- 1.1 Market scope and definition
- 1.2 Research design
- 1.2.1 Research approach
- 1.2.2 Data collection methods
- 1.3 Data mining sources
- 1.3.1 Global
- 1.3.2 Regional/Country
- 1.4 Base estimates and calculations
- 1.4.1 Base year calculation
- 1.4.2 Key trends for market estimation
- 1.5 Primary research and validation
- 1.5.1 Primary sources
- 1.6 Forecast model
- 1.7 Research assumptions and limitations
Chapter 2 Executive Summary
- 2.1 Industry 3600 synopsis
- 2.2 Key market trends
- 2.2.1 Regional
- 2.2.2 Material Type
- 2.2.3 Packaging Format
- 2.2.4 Recycling Process
- 2.2.5 End Use Industry
- 2.3 TAM Analysis, 2025-2034
- 2.4 CXO perspectives: Strategic imperatives
- 2.4.1 Executive decision points
- 2.4.2 Critical success factors
- 2.5 Future Outlook and Strategic Recommendations
Chapter 3 Industry Insights
- 3.1 Industry ecosystem analysis
- 3.1.1 Supplier Landscape
- 3.1.2 Profit Margin
- 3.1.3 Value addition at each stage
- 3.1.4 Factor affecting the value chain
- 3.1.5 Disruptions
- 3.2 Industry impact forces
- 3.2.1 Growth drivers
- 3.2.1.1 Increasing implementation of Extended Producer Responsibility (EPR) policies
- 3.2.1.2 Strong corporate sustainability and recycled-content commitments
- 3.2.1.3 Rising consumer awareness of environmental impacts
- 3.2.1.4 Expansion of recycling infrastructure and capacity
- 3.2.2 Industry pitfalls and challenges
- 3.2.2.1 Contamination of food packaging waste streams
- 3.2.2.2 Complexity of multilayer and mixed-material packaging
- 3.2.2.3 Insufficient segregation, collection, and sorting systems
- 3.2.3 Market opportunities
- 3.2.3.1 Scaling chemical recycling to process difficult packaging types
- 3.2.3.2 Developing robust supply chains for food-grade rPET and recycled polyolefins
- 3.2.3.3 Offering design-for-recycling advisory and certification services
- 3.2.3.4 Investment and M&A in regional recycling infrastructure
- 3.2.1 Growth drivers
- 3.3 Growth potential analysis
- 3.4 Regulatory landscape
- 3.4.1 North America
- 3.4.2 Europe
- 3.4.3 Asia Pacific
- 3.4.4 Latin America
- 3.4.5 Middle East & Africa
- 3.5 Porter's analysis
- 3.6 PESTEL analysis
- 3.7 Price trends
- 3.7.1 By region
- 3.7.2 By product
- 3.8 Future market trends
- 3.9 Technology and Innovation landscape
- 3.9.1 Current technological trends
- 3.9.2 Emerging technologies
- 3.10 Patent Landscape
- 3.11 Trade statistics (Note: the trade statistics will be provided for key countries only)
- 3.11.1 Major importing countries
- 3.11.2 Major exporting countries
- 3.12 Sustainability and Environmental Aspects
- 3.12.1 Sustainable Practices
- 3.12.2 Waste Reduction Strategies
- 3.12.3 Energy Efficiency in Production
- 3.12.4 Eco-friendly Initiatives
- 3.13 Carbon Footprint Considerations
Chapter 4 Competitive Landscape, 2024
- 4.1 Introduction
- 4.2 Company market share analysis
- 4.2.1 By region
- 4.2.1.1 North America
- 4.2.1.2 Europe
- 4.2.1.3 Asia Pacific
- 4.2.1.4 LATAM
- 4.2.1.5 MEA
- 4.2.1 By region
- 4.3 Company matrix analysis
- 4.4 Competitive analysis of major market players
- 4.5 Competitive positioning matrix
- 4.6 Key developments
- 4.6.1 Mergers & acquisitions
- 4.6.2 Partnerships & collaborations
- 4.6.3 New Product Launches
- 4.6.4 Expansion Plans
Chapter 5 Market Estimates and Forecast, By Material Type, 2021 - 2034 (USD Billion, Kilo Tons)
- 5.1 Key trends
- 5.2 Plastic
- 5.2.1 PET (Polyethylene Terephthalate)
- 5.2.2 HDPE (High-Density Polyethylene)
- 5.2.3 LDPE (Low-Density Polyethylene)
- 5.2.4 PP (Polypropylene)
- 5.2.5 Polystyrene
- 5.2.6 Multi-layer plastics
- 5.3 Paper & Paperboard
- 5.3.1 Corrugated board
- 5.3.2 Boxboard
- 5.3.3 Kraft paper
- 5.4 Metal
- 5.4.1 Aluminum
- 5.4.2 Steel
- 5.5 Glass
- 5.6 Biodegradable/Bio-based Materials
- 5.6.1 PLA (Polylactic Acid)
- 5.6.2 Starch-based plastics
- 5.7 Others
Chapter 6 Market Estimates and Forecast, By Packaging Format, 2021 - 2034 (USD Billion, Kilo Tons)
- 6.1 Key trends
- 6.2 Rigid Packaging
- 6.2.1 Bottles & Jars
- 6.2.2 Trays
- 6.2.3 Cans
- 6.2.4 Boxes
- 6.3 Flexible Packaging
- 6.3.1 Pouches
- 6.3.2 Wraps
- 6.3.3 Films
- 6.3.4 Sachets
- 6.4 Others
Chapter 7 Market Estimates and Forecast, By Recycling Process, 2021 - 2034 (USD Billion, Kilo Tons)
- 7.1 Key trends
- 7.2 Mechanical Recycling
- 7.3 Chemical Recycling
- 7.3.1 Pyrolysis
- 7.3.2 Depolymerization
- 7.4 Biological Recycling
- 7.4.1 Composting (for biodegradable packaging)
- 7.5 Energy Recovery
- 7.5.1 Incineration with energy capture
- 7.6 Others
Chapter 8 Market Estimates and Forecast, By End Use Industry, 2021 - 2034 (USD Billion, Kilo Tons)
- 8.1 Key trends
- 8.2 Food & Beverage
- 8.2.1 Dairy
- 8.2.2 Bakery & Confectionery
- 8.2.3 Meat, Poultry & Seafood
- 8.2.4 Ready-to-Eat Meals
- 8.2.5 Fruits & Vegetables
- 8.2.6 Beverages (non-alcoholic and alcoholic)
- 8.3 Foodservice
- 8.3.1 Quick Service Restaurants (QSRs)
- 8.3.2 Cafeterias
- 8.3.3 Catering Services
- 8.4 Retail & E-commerce
- 8.5 Institutional Use
- 8.5.1 Hospitals
- 8.5.2 Schools
- 8.5.3 Government Facilities
- 8.6 Others
Chapter 9 Market Estimates and Forecast, By Region, 2021 - 2034 (USD Billion, Kilo Tons)
- 9.1 Key trends
- 9.2 North America
- 9.2.1 U.S.
- 9.2.2 Canada
- 9.3 Europe
- 9.3.1 Germany
- 9.3.2 UK
- 9.3.3 France
- 9.3.4 Italy
- 9.3.5 Spain
- 9.3.6 Rest of Europe
- 9.4 Asia Pacific
- 9.4.1 China
- 9.4.2 India
- 9.4.3 Japan
- 9.4.4 Australia
- 9.4.5 South Korea
- 9.4.6 Rest of Asia Pacific
- 9.5 Latin America
- 9.5.1 Brazil
- 9.5.2 Mexico
- 9.5.3 Argentina
- 9.5.4 Rest of Latin America
- 9.6 Middle East & Africa
- 9.6.1 Saudi Arabia
- 9.6.2 South Africa
- 9.6.3 UAE
- 9.6.4 Rest of Middle East & Africa
Chapter 10 Company Profiles
- 10.1 Amcor plc
- 10.2 Mondi Group
- 10.3 Tetra Pak
- 10.4 Sealed Air Corporation
- 10.5 Ball Corporation
- 10.6 Constantia Flexibles
- 10.7 MULTIVAC Group
- 10.8 Clear Path Recycling
- 10.9 Clean Tech Incorporated
- 10.10 CarbonLite Industries
- 10.11 BioPak
- 10.12 EcoEnclose
- 10.13 Elevate Packaging
- 10.14 TC Transcontinental Packaging
- 10.15 International Paper Company
 2026年全球食品废弃物管理市场报告
 食品废弃物衍生的植物色素市场机会、成长要素、产业趋势分析及预测(2026-2035年)
 全球食品废弃物管理市场规模、份额、趋势和成长分析报告(2026-2034年)
 食品废弃物管理市场-全球产业规模、份额、趋势、机会及预测(依废弃物类型、处理流程、来源、应用、地区及竞争格局划分),2021-2031年
 全球升级改造宠物用品市场:预测至2032年-依材料种类、原料、形状、宠物类型、加工技术、应用及地区进行分析
 食品废弃物管理市场规模、份额及成长分析(按废弃物类型、来源、处理流程和地区划分)-2026-2033年产业预测2032年食品废弃物减量技术市场预测:按技术类型、应用和地区分類的全球分析食品垃圾回收市场机会、成长驱动因素、产业趋势分析及预测(2025-2034年)全球食品废弃物管理市场-2025-2030年预测全球食品废弃物管理市场:预测至2032年-依废弃物类型、来源、服务、规模/部署方式、最终产品和地区进行分析