


 |
市场调查报告书
商品编码
1693501
美国特种肥料:市场占有率分析、产业趋势和成长预测(2025-2030 年)United States Specialty Fertilizer - Market Share Analysis, Industry Trends & Statistics, Growth Forecasts (2025 - 2030) |
||||||
※ 本网页内容可能与最新版本有所差异。详细情况请与我们联繫。
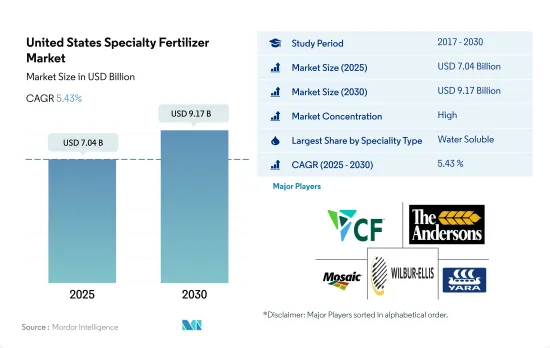
预计 2025 年美国特种肥料市场规模将达到 70.4 亿美元,到 2030 年将达到 91.7 亿美元,预测期内(2025-2030 年)的复合年增长率为 5.43%。
永续灌溉方式的采用率不断提高,特色产品数量激增
- 2018年至2022年,美国特种肥料市场将实现2.5%的销售成长,这得益于不同作物类型的潜力和市场机会的不断扩大。
- 到 2022 年,水溶性肥料将占据最大的市场占有率,为 48.0%,其次是液体肥料,为 46.3%,控制释放肥料 (CRF) 为 5.1%。相较之下,缓释肥料的份额仅为0.6%,主要原因是其在小麦、玉米和其他谷物等主要作物中的应用有限。
- 水溶性肥料的需求源自于其多样化的营养等级和多种施用方法,包括叶面喷布、施肥和土壤施用。尤其是水溶性肥料,在报告期间内销售成长了1.9%。
- 研究期间,美国液体肥料市场显着成长了 2.0%。这种增长归因于精密农业的日益普及、施肥的便利性以及货车的可用性等因素。此外,微灌溉系统在该国正在扩大,预计这将进一步推动该领域的成长。
- 2017年,全国灌溉农地面积5,800万英亩。透过发达的微灌系统均匀分布可溶性肥料,增加了养分的利用率,从而提高了养分供应效率。
- 美国特种肥料市场预计将以 5.2% 的复合年增长率成长,并预计在 2023 年至 2030 年间获得发展动力。推动这一增长的因素包括政府对遏制传统肥料对环境影响的兴趣日益浓厚,以及技术和科学的快速进步。
美国特种肥料市场趋势
大豆和玉米是美国种植面积最大的两种作物。
- 美国人口将缓慢成长,从2020年的3.359亿增加到2022年的3.382亿。过去20年,美国耕地面积减少了近5,000万英亩,到2022年将稳定在8.934亿英亩。由于耕地面积的减少,迫切需要提高农业生产力。人们长期以来一直使用肥料来提高作物产量。 2022年,玉米、棉花、大豆和小麦四大主要作物将占美国主要作物面积的65.7%。
- 大豆和玉米将成为美国的主要作物,其中大豆将占据首位,到2022年将占美国耕地面积的25.8%,紧随其后的是玉米,占25.7%,小麦占11.1%。这些作物主要生长在“玉米带”,包括印第安纳州、伊利诺伊州、爱荷华州、密苏里州、内布拉斯加州和堪萨斯州的部分地区。该地区主要产玉米和大豆。此外,根据美国农业部的数据,美国已成为重要的稻米出口国,其种植集中在南部的三个地区和加州的一个地区。
- 农业用品製造商正积极创新,帮助农民精准施肥。这不仅降低了种植成本,而且提高了效率。美国农田作物市场潜力巨大,预计未来几年将因政府资金和支持的激增而强劲增长。
氮缺乏是美国作物最普遍的营养问题之一。
- 全国田间作物主要养分(氮、钾、磷)平均施用量约为每公顷166.61公斤。氮为45.93%,钾为28.11%,磷为25.96%。
- 田间作物中,油菜籽/油菜籽的平均一次养分施用量为284.92公斤/公顷,为田间作物中最高。在主要养分中,氮肥施用量最高,平均施用量为 229.60 公斤/公顷。这是因为植物的新陈代谢需要大量的氮,而氮是叶绿素和胺基酸的主要成分。
- 玉米产量排名第二,其次是油菜籽,平均每公顷产量为 245.40 公斤。玉米约占美国田间作物总产量的31.44%。玉米平均需氮量为50.06%,磷量为23.77%,钾量为26.17%。
- 基本营养素是植物生长所必需的,可增强植物酵素的功能,改善植物细胞的生长和生化过程。主要营养素的缺乏会影响植物的健康、生长和作物产量。预计田间作物主要养分的施用量将会增加,以满足提高生产力的需求。
美国特种肥料产业概况
美国特种肥料市场相当集中,前五大公司占了73.24%的市场。该市场的主要企业包括 CF Industries Holdings, Inc.、The Andersons Inc.、The Mosaic Company、Wilbur-Ellis Company LLC、Yara International ASA 等。
其他福利
- Excel 格式的市场预测 (ME) 表
- 3个月的分析师支持
目录
第一章执行摘要和主要发现
第二章 报告要约
第三章 引言
- 研究假设和市场定义
- 研究范围
- 调查方法
第四章 产业主要趋势
- 主要作物种植面积
- 田间作物
- 园艺作物
- 平均养分施用量
- 微量营养素
- 田间作物
- 园艺作物
- 主要营养素
- 田间作物
- 园艺作物
- 次要宏量营养素
- 田间作物
- 园艺作物
- 微量营养素
- 灌溉农田
- 法律规范
- 价值炼和通路分析
第五章市场区隔
- 专业类型
- CRF
- 聚合物涂层
- 聚合硫涂层
- 其他的
- 液体肥料
- SRF
- 水溶性
- CRF
- 施肥方式
- 受精
- 叶面喷布
- 土壤
- 作物类型
- 田间作物
- 园艺作物
- 草坪和观赏植物
第六章 竞争格局
- 关键策略趋势
- 市场占有率分析
- 商业状况
- 公司简介
- CF Industries Holdings, Inc.
- Haifa Group
- ICL Group Ltd
- Koch Industries Inc.
- Nutrien Ltd.
- Sociedad Quimica y Minera de Chile SA
- The Andersons Inc.
- The Mosaic Company
- Wilbur-Ellis Company LLC
- Yara International ASA
第七章:CEO面临的关键策略问题
第 8 章 附录
- 世界概况
- 概述
- 五力分析框架
- 全球价值链分析
- 市场动态(DRO)
- 资讯来源及延伸阅读
- 图片列表
- 关键见解
- 数据包
- 词彙表
The United States Specialty Fertilizer Market size is estimated at 7.04 billion USD in 2025, and is expected to reach 9.17 billion USD by 2030, growing at a CAGR of 5.43% during the forecast period (2025-2030).
The adoption of sustainable and irrigation agricultural practices is on the rise, leading to a surge in specialty adoption
- From 2018 to 2022, the specialty fertilizer market in the United States witnessed a 2.5% volume growth, propelled by its potential and expanding market opportunities across diverse crop types.
- By 2022, water-soluble fertilizers commanded a significant market share of 48.0%, followed by liquid fertilizers at 46.3% and controlled-release fertilizers (CRF) at 5.1%. In contrast, slow-release fertilizers held a modest 0.6% share, primarily due to their limited adoption in major crops like wheat, maize, and other cereals.
- The demand for water-soluble fertilizers is buoyed by their diverse nutrient grades and versatile application methods, including foliar, fertigation, and soil application. Notably, water-soluble fertilizers witnessed a 1.9% volume growth during the study period.
- The liquid fertilizers segment in the United States witnessed a notable 2.0% growth during the study period. This growth can be attributed to factors such as the rising adoption of precision farming, the ease of application, and the availability of wagons. Furthermore, the country's expanding micro-irrigation system is poised to further bolster this segment's growth.
- In 2017, the country had 58 million acres of irrigated cropland. The even distribution of water-soluble fertilizers through the developing micro-irrigation system led to heightened nutrient availability, resulting in improved nutrient supplementation efficiency.
- With a projected CAGR of 5.2%, the US specialty fertilizer market is set to gain momentum from 2023 to 2030. This growth is underpinned by a heightened governmental focus on curbing the environmental impact of conventional fertilizers and the concurrent surge in technological and scientific advancements.
United States Specialty Fertilizer Market Trends
Soybean and corn are the two largest crops grown in the United States
- The United States witnessed a modest population growth, rising from 335.9 million in 2020 to 338.2 million in the year 2022. Over the past two decades, the nation's farmland area has shrunk by nearly 50 million acres, settling at 893.4 million acres by 2022. This diminishing farmland underscores the urgency to enhance agricultural productivity through Agri inputs. Fertilizers have long been employed to bolster crop yields. In 2022, four key crops, such as corn, cotton, soybean, and wheat, collectively commanded over 65.7% of the principal crop acreage in the United States.
- Soybean and corn reign as the top crops in the United States, with soybean leading the pack in the year 2022, occupying 25.8% of the nation's arable land, followed closely by corn at 25.7%, and wheat at 11.1%. These crops predominantly thrive in the "Corn Belt," encompassing parts of Indiana, Illinois, Iowa, Missouri, Nebraska, and Kansas. Corn and soybean production dominates this region. Furthermore, the United States emerges as a significant rice exporter, with cultivation concentrated in three Southern regions and one in California, as per the United States Department of Agriculture.
- Manufacturers of farm inputs are actively innovating to aid farmers in precise fertilizer application. This not only curbs cultivation costs but also bolsters efficiency. The US field crop sector holds substantial market potential, and with a surge in government funding and support, it is poised for positive growth in the coming years.
Nitrogen deficiency is one of the most prevalent crop nutrient problems across the cropping areas in the United States
- In the field crop's average primary nutrients (Nitrogen, Potassium, and Phosphorus) application rate in the country is about 166.61 kilogram/Hectare. Nitrogen accounts for 45.93 %, Potassium accounts for 28.11 percentage, and phosphorus accounts for 25.96 percentage of total field crops' average primary nutrient application.
- In field crops, Rapeseed/Canola was applied with an average primary nutrient application rate of 284.92 kilogram/Hectare, which is the highest in field crops. In primary nutrients, Nitrogen occupies first place with an average application rate of 229.60 kilogram/Hectare. This is because Nitrogen is required in large amounts for plant metabolism and it is a major component of chlorophyll and amino acids.
- Corn/ Maize is the second largest followed by Rapeseed/ Canola with an average primary nutrient application rate of 245.40 kilogram/ Hectare. Corn accounts for about 31.44 percentage of total field crop production in the United States. The Nitrogen requirement of corn is about 50.06 percentage, phosphorus is 23.77 percentage, and Potash is 26.17 percentage of the total average primary nutrient application.
- The primary nutrients are crucial for plant growth and boost the plant enzyme function, improving plant cell growth and biochemical processes. The deficiency of primary nutrients can affect plant health, growth, and crop production output. The application of primary nutrients in field crops is anticipated to increase to meet the demand by increasing productivity.
United States Specialty Fertilizer Industry Overview
The United States Specialty Fertilizer Market is fairly consolidated, with the top five companies occupying 73.24%. The major players in this market are CF Industries Holdings, Inc., The Andersons Inc., The Mosaic Company, Wilbur-Ellis Company LLC and Yara International ASA (sorted alphabetically).
Additional Benefits:
- The market estimate (ME) sheet in Excel format
- 3 months of analyst support
TABLE OF CONTENTS
1 EXECUTIVE SUMMARY & KEY FINDINGS
2 REPORT OFFERS
3 INTRODUCTION
- 3.1 Study Assumptions & Market Definition
- 3.2 Scope of the Study
- 3.3 Research Methodology
4 KEY INDUSTRY TRENDS
- 4.1 Acreage Of Major Crop Types
- 4.1.1 Field Crops
- 4.1.2 Horticultural Crops
- 4.2 Average Nutrient Application Rates
- 4.2.1 Micronutrients
- 4.2.1.1 Field Crops
- 4.2.1.2 Horticultural Crops
- 4.2.2 Primary Nutrients
- 4.2.2.1 Field Crops
- 4.2.2.2 Horticultural Crops
- 4.2.3 Secondary Macronutrients
- 4.2.3.1 Field Crops
- 4.2.3.2 Horticultural Crops
- 4.2.1 Micronutrients
- 4.3 Agricultural Land Equipped For Irrigation
- 4.4 Regulatory Framework
- 4.5 Value Chain & Distribution Channel Analysis
5 MARKET SEGMENTATION (includes market size in Value in USD and Volume, Forecasts up to 2030 and analysis of growth prospects)
- 5.1 Speciality Type
- 5.1.1 CRF
- 5.1.1.1 Polymer Coated
- 5.1.1.2 Polymer-Sulfur Coated
- 5.1.1.3 Others
- 5.1.2 Liquid Fertilizer
- 5.1.3 SRF
- 5.1.4 Water Soluble
- 5.1.1 CRF
- 5.2 Application Mode
- 5.2.1 Fertigation
- 5.2.2 Foliar
- 5.2.3 Soil
- 5.3 Crop Type
- 5.3.1 Field Crops
- 5.3.2 Horticultural Crops
- 5.3.3 Turf & Ornamental
6 COMPETITIVE LANDSCAPE
- 6.1 Key Strategic Moves
- 6.2 Market Share Analysis
- 6.3 Company Landscape
- 6.4 Company Profiles
- 6.4.1 CF Industries Holdings, Inc.
- 6.4.2 Haifa Group
- 6.4.3 ICL Group Ltd
- 6.4.4 Koch Industries Inc.
- 6.4.5 Nutrien Ltd.
- 6.4.6 Sociedad Quimica y Minera de Chile SA
- 6.4.7 The Andersons Inc.
- 6.4.8 The Mosaic Company
- 6.4.9 Wilbur-Ellis Company LLC
- 6.4.10 Yara International ASA
7 KEY STRATEGIC QUESTIONS FOR FERTILIZER CEOS
8 APPENDIX
- 8.1 Global Overview
- 8.1.1 Overview
- 8.1.2 Porter's Five Forces Framework
- 8.1.3 Global Value Chain Analysis
- 8.1.4 Market Dynamics (DROs)
- 8.2 Sources & References
- 8.3 List of Tables & Figures
- 8.4 Primary Insights
- 8.5 Data Pack
- 8.6 Glossary of Terms
 特种肥料:市场占有率分析、产业趋势与统计、成长预测(2026-2031)
 全球特种肥料市场规模、份额、趋势和成长分析报告(2026-2034)
 2026年全球特种肥料市场报告
 特种肥料市场规模、份额和成长分析(按类型、技术、形态、作物类型、应用方法和地区划分)-2026-2033年产业预测
 按养分类型、应用、形态、作物类型、作用机制和销售管道的晶体肥料市场—2025-2032年全球预测特种肥料市场(依作物类型、产品形态、营养类型、施用方法、通路和最终用途)-2025-2032 年全球预测
 特种肥料市场规模、份额、趋势分析报告:按技术、作物类型、应用、地区、细分市场预测,2025-2030 年全球特种肥料市场规模(依特种肥料类型、作物类型、施用方法、区域范围及预测)
 特种肥料市场 - 全球产业规模、份额、趋势、机会和预测,按作物类型、形式、应用方式、技术、地区和竞争细分,2020-2030 年中东和非洲特种肥料:市场占有率分析、行业趋势和统计数据、成长预测(2025-2030 年)