


 |
市场调查报告书
商品编码
1693510
印度特种肥料:市场占有率分析、产业趋势与统计、成长预测(2025-2030)India Specialty Fertilizer - Market Share Analysis, Industry Trends & Statistics, Growth Forecasts (2025 - 2030) |
||||||
※ 本网页内容可能与最新版本有所差异。详细情况请与我们联繫。
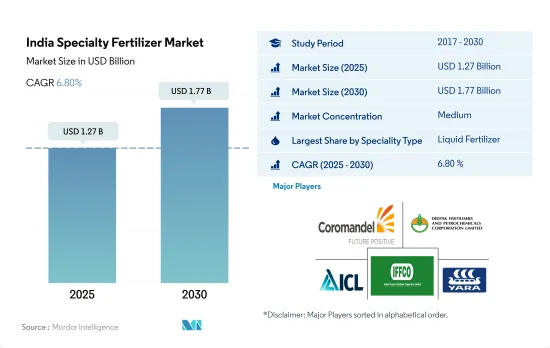
印度特种肥料市场规模预计在 2025 年将达到 12.7 亿美元,预计到 2030 年将达到 17.7 亿美元,预测期内(2025-2030 年)的复合年增长率为 6.80%。
永续的农业实践和改善的环境安全推动了特殊肥料的使用
- 2017-2021年期间,该国控制释放肥市场价值成长了106.1%,而消费量增加了24.2%。主要原因是印度政府要求所有国内尿素生产商必须生产 100% 印楝尿素,并以补贴价格分发给农民。
- 2022年,液体肥料占印度特种肥料市场的49.7%。在液体肥料市场中,复合肥料占比最大,为75.7%。 2017 年该产业的价值为 2.061 亿美元,预计到 2030 年将达到 21.2 亿美元。同样,到 2022 年,单质肥料将占液体肥料市场的 24.3%。
- 缓效肥料占2022年专用肥料市场的1.0%。田间作物和园艺作物是缓释肥的主要消费者,到2022年,它们将分别占市场份额的89.6%和10.2%。由于田间作物和作物作物在该国广泛种植,预计该国将推动缓释肥市场的发展。
- 在专用肥料市场中,水溶性肥料将在2022年占据46.2%的市场。预计水溶性肥料市场将在2017年至2021年期间稳定成长,到2022年将达到14.6亿美元。田间作物占比最大,为88.8%,其次是园艺作物。
- 对高效肥料的需求不断增长、施用的便利性、永续农业实践的采用以及更高的环境安全性是推动印度特种肥料市场发展的一些因素。
印度特种肥料市场趋势
锰缺乏症是欧洲国家常见的问题,在沙质土壤和pH值高于6的有机土壤中最为常见。
- 2017年至2022年间,该国田间作物种植面积增加了3.5%。由于国内外消费需求不断增长,该国谷物、豆类和油籽种植面积增加是种植面积增加的主要驱动力。
- 依作物类型划分,水稻、小麦和大豆的种植面积最大,到2022年分别为4,700万公顷、3,110万公顷和1,230万公顷。水稻是印度最重要的作物,约占印度种植总面积的四分之一,养活了全国约一半的人口。它主要生长在西孟加拉邦、北方邦、安得拉邦、旁遮普邦和泰米尔纳德邦。
- 因此,预计该国的大米消费量将从 2016 年的 9,580 万吨增加到 2022 年的 1.07 亿吨,显示该国对作物的需求不断增长。预计这一趋势将在 2023 年至 2030 年期间进一步推高化肥需求。同样,国内小麦种植量从 2017 年的 9,850 万吨增加到 2020 年的 1.076 亿吨。小麦主要种植在旁遮普邦、西孟加拉邦、哈里亚纳邦和拉贾斯坦邦。小麦是印度第二大谷物作物,在该国的粮食和营养安全中发挥着至关重要的作用。因此,该国的谷物种植业蓬勃发展,再加上国内外需求的不断增长,预计将在 2023 年至 2030 年期间推动印度肥料市场的发展。
在主要养分中,氮是农田作物最常使用的养分,平均施用量为每公顷 223.5 公斤。
- 2022年所有主要养分的平均施用率为125.1公斤/公顷,其中氮和其他养分的平均施用率最高,为223.5公斤/公顷。因此,氮是该国集约化种植的水稻等作物的主要营养来源,而土壤养分缺乏正在限制全国的水稻产量。
- 印度的生物肥料和有机肥料的现状显示土壤健康状况不佳,化学肥料的消耗量不断增加。结果表明,受试土壤中氮、磷、钾缺量的比例分别为97.0%、83.0%和71.0%。
- 以作物,2022年平均施肥量最高的作物是小麦、水稻和玉米,估计分别为231公斤/公顷、156公斤/公顷和149公斤/公顷。小麦和米是我国乃至全球重要的主粮。多种营养缺乏是降低产量和利润的重要因素。小麦和水稻作物需要氮、磷、钾和硫、硼、铁和锌等微量营养素才能正常生长。适当的营养管理对于作物的成功生产是必要的,这推动了市场的成长。
- 田间作物消耗大量的主要营养物质,例如氮肥。该国对谷类的密集种植正在耗尽土壤的养分,需要更多的肥料来补充。
印度特种肥料产业概况
印度特种肥料市场适度整合,前五大公司占48.56%的市占率。该市场的主要企业有:Coromandel International Ltd.、Deepak Fertiliser & Petrochemicals Corporation Ltd、ICL Group Ltd、Indian Farmers Fertiliser Cooperative Limited 和 Yara International ASA(按字母排列)
其他福利
- Excel 格式的市场预测 (ME) 表
- 3个月的分析师支持
目录
第一章执行摘要和主要发现
第二章 报告要约
第三章 引言
- 研究假设和市场定义
- 研究范围
- 调查方法
第四章 产业主要趋势
- 主要作物种植面积
- 田间作物
- 园艺作物
- 平均养分施用量
- 微量营养素
- 田间作物
- 园艺作物
- 主要营养素
- 田间作物
- 园艺作物
- 次要宏量营养素
- 田间作物
- 园艺作物
- 微量营养素
- 灌溉农田
- 法律规范
- 价值炼和通路分析
第五章市场区隔
- 专业类型
- CRF
- 聚合物涂层
- 聚合硫涂层
- 其他的
- 液体肥料
- SRF
- 水溶性
- CRF
- 施肥方式
- 受精
- 叶面喷布
- 土壤
- 作物类型
- 田间作物
- 园艺作物
- 草坪和观赏植物
第六章 竞争格局
- 关键策略趋势
- 市场占有率分析
- 商业状况
- 公司简介
- Chambal Fertilizers & Chemicals Ltd
- Coromandel International Ltd.
- Deepak fertilizers & Petrochemicals Corporation Ltd
- Grupa Azoty SA(Compo Expert)
- Haifa Group
- ICL Group Ltd
- Indian Farmers Fertiliser Cooperative Limited
- Mangalore Chemicals & Fertilizers Ltd.
- Sociedad Quimica y Minera de Chile SA
- Yara International ASA
第七章:CEO面临的关键策略问题
第 8 章 附录
- 世界概况
- 概述
- 五力分析框架
- 全球价值链分析
- 市场动态(DRO)
- 资讯来源及延伸阅读
- 图片列表
- 关键见解
- 资料包
- 词彙表
The India Specialty Fertilizer Market size is estimated at 1.27 billion USD in 2025, and is expected to reach 1.77 billion USD by 2030, growing at a CAGR of 6.80% during the forecast period (2025-2030).
Sustainable farming practices and higher environmental safety are being adopted, driving the usage of specialty fertilizers
- The controlled-release fertilizer market in the country witnessed an increase in market value by 106.1%, whereas the consumption volume increased by 24.2% during 2017-2021. The main reason for this was the Government of India making it mandatory for all domestic producers of urea to produce 100% neem-coated urea and distribute it at a subsidized price to the farmers.
- Liquid fertilizers accounted for 49.7% of India's specialty fertilizer market in 2022. Complex fertilizers accounted for the maximum share in the liquid fertilizer market, i.e., 75.7%. This segment was valued at USD 206.1 million in 2017, which is anticipated to reach USD 2.12 billion by 2030. Similarly, straight fertilizers accounted for 24.3% of the liquid fertilizers market in 2022.
- Slow-release fertilizers accounted for 1.0% of the specialty fertilizer market value in 2022. Field crops and horticultural crops are the major consumers of slow-release fertilizers, accounting for 89.6% and 10.2% of the market volume in 2022. The intensive field crop and horticultural crop cultivation in the country are anticipated to drive the market for slow-release fertilizers.
- In the specialty fertilizer market, water-soluble fertilizers accounted for 46.2% of the value share in 2022. The water-soluble fertilizer market witnessed stable growth during 2017-2021, valued at USD 1.46 billion in 2022. Field crops occupied the largest share of 88.8%, followed by horticultural crops.
- The rise in demand for high-efficiency fertilizers, ease of application, adoption of sustainable farming practices, and higher environmental safety are some of the factors driving the specialty fertilizer market in India.
India Specialty Fertilizer Market Trends
manganese deficiency is a common problem in European countries, which most frequently affects sandy soils, organic soils with a pH above 6
- The area under field crop cultivation in the country increased by 3.5% during 2017-2022. The increased cultivation of cereals, pulses, and oilseeds in the country due to the rising consumer demand domestically and internationally is the major driving factor for the rising acreage.
- By crop type, rice, wheat, and soybean occupied the largest area under cultivation in the country, accounting for 47 million ha, 31.1 million ha, and 12.3 million ha in the year 2022. Rice is the most important food crop of India, covering about one-fourth of the total cropped area and providing food to about half of the Indian population. It is cultivated in almost all the states of the country, mainly in West Bengal, Uttar Pradesh, Andhra Pradesh, Punjab, and Tamil Nadu.
- Accordingly, rice consumption in the country increased from 95.8 million tons in 2016 to 107 million tons in 2022, which shows the rising demand for the crop in the country. This trend is further anticipated to drive the demand for fertilizers during 2023-2030. Similarly, wheat cultivation in the country increased from 98.5 million tons in 2017 to 107.6 million tons in the year 2020. It is cultivated majorly in Punjab, West Bengal, Haryana, and Rajasthan. Wheat is the second most important cereal crop in India and plays a vital role in the food and nutritional security of the country. Therefore, the intense cereal cultivation in the country, coupled with rising domestic and international demand, is anticipated to drive the Indian fertilizer market during 2023-2030.
Among the primary nutrients, nitrogen is the most-applied nutrient in field crops, with an average application rate of 223.5 kg per hectare
- The overall primary nutrient average application rate in 2022 was 125.1 kg/ha, with nutrients such as nitrogen with the highest average application rate of 223.5 kg/ha. Accordingly, nitrogen is the major source of nutrients for crops such as rice, which is intensively cultivated in the country, and such nutrient deficiency in soil is limiting rice productivity across the nation.
- The State of Biofertilizers and Organic Fertilizers in India marked poor status of soil health and increasing consumption of chemical fertilizers in India. Accordingly, 97.0%, 83.0%, and 71.0% of the soil tested were found to be deficient in nitrogen, phosphorous, and potassium.
- By crop, wheat, rice, and corn/maize were estimated to be the crop types with the highest average nutrient application rate of 231, 156, and 149 kg/ha in 2022. Wheat and rice are important staple food domestically and globally. Multiple nutrient deficiencies are the key factors that reduce yield and profit. Wheat and rice crops require nitrogen, phosphorous, and potassium, along with other micronutrients such as sulfur, boron, iron, and zinc, for their proper growth and development. The proper management of nutrients is necessary for successful crop production, which in turn is driving market growth.
- Field crops consume the maximum amount of primary nutrients, such as nitrogen fertilizer. As grains and cereals are intensively grown in the country, the soil is depleted of its nutrition, and hence they require more amount of fertilizers to supplement them, which in turn is anticipated to drive the market during 2023-2030.
India Specialty Fertilizer Industry Overview
The India Specialty Fertilizer Market is moderately consolidated, with the top five companies occupying 48.56%. The major players in this market are Coromandel International Ltd., Deepak fertilizers & Petrochemicals Corporation Ltd, ICL Group Ltd, Indian Farmers Fertiliser Cooperative Limited and Yara International ASA (sorted alphabetically).
Additional Benefits:
- The market estimate (ME) sheet in Excel format
- 3 months of analyst support
TABLE OF CONTENTS
1 EXECUTIVE SUMMARY & KEY FINDINGS
2 REPORT OFFERS
3 INTRODUCTION
- 3.1 Study Assumptions & Market Definition
- 3.2 Scope of the Study
- 3.3 Research Methodology
4 KEY INDUSTRY TRENDS
- 4.1 Acreage Of Major Crop Types
- 4.1.1 Field Crops
- 4.1.2 Horticultural Crops
- 4.2 Average Nutrient Application Rates
- 4.2.1 Micronutrients
- 4.2.1.1 Field Crops
- 4.2.1.2 Horticultural Crops
- 4.2.2 Primary Nutrients
- 4.2.2.1 Field Crops
- 4.2.2.2 Horticultural Crops
- 4.2.3 Secondary Macronutrients
- 4.2.3.1 Field Crops
- 4.2.3.2 Horticultural Crops
- 4.2.1 Micronutrients
- 4.3 Agricultural Land Equipped For Irrigation
- 4.4 Regulatory Framework
- 4.5 Value Chain & Distribution Channel Analysis
5 MARKET SEGMENTATION (includes market size in Value in USD and Volume, Forecasts up to 2030 and analysis of growth prospects)
- 5.1 Speciality Type
- 5.1.1 CRF
- 5.1.1.1 Polymer Coated
- 5.1.1.2 Polymer-Sulfur Coated
- 5.1.1.3 Others
- 5.1.2 Liquid Fertilizer
- 5.1.3 SRF
- 5.1.4 Water Soluble
- 5.1.1 CRF
- 5.2 Application Mode
- 5.2.1 Fertigation
- 5.2.2 Foliar
- 5.2.3 Soil
- 5.3 Crop Type
- 5.3.1 Field Crops
- 5.3.2 Horticultural Crops
- 5.3.3 Turf & Ornamental
6 COMPETITIVE LANDSCAPE
- 6.1 Key Strategic Moves
- 6.2 Market Share Analysis
- 6.3 Company Landscape
- 6.4 Company Profiles
- 6.4.1 Chambal Fertilizers & Chemicals Ltd
- 6.4.2 Coromandel International Ltd.
- 6.4.3 Deepak fertilizers & Petrochemicals Corporation Ltd
- 6.4.4 Grupa Azoty S.A. (Compo Expert)
- 6.4.5 Haifa Group
- 6.4.6 ICL Group Ltd
- 6.4.7 Indian Farmers Fertiliser Cooperative Limited
- 6.4.8 Mangalore Chemicals & Fertilizers Ltd.
- 6.4.9 Sociedad Quimica y Minera de Chile SA
- 6.4.10 Yara International ASA
7 KEY STRATEGIC QUESTIONS FOR FERTILIZER CEOS
8 APPENDIX
- 8.1 Global Overview
- 8.1.1 Overview
- 8.1.2 Porter's Five Forces Framework
- 8.1.3 Global Value Chain Analysis
- 8.1.4 Market Dynamics (DROs)
- 8.2 Sources & References
- 8.3 List of Tables & Figures
- 8.4 Primary Insights
- 8.5 Data Pack
- 8.6 Glossary of Terms
 特种肥料:市场占有率分析、产业趋势与统计、成长预测(2026-2031)
 全球特种肥料市场规模、份额、趋势和成长分析报告(2026-2034)
 2026年全球特种肥料市场报告
 特种肥料市场规模、份额和成长分析(按类型、技术、形态、作物类型、应用方法和地区划分)-2026-2033年产业预测
 按养分类型、应用、形态、作物类型、作用机制和销售管道的晶体肥料市场—2025-2032年全球预测特种肥料市场(依作物类型、产品形态、营养类型、施用方法、通路和最终用途)-2025-2032 年全球预测
 特种肥料市场规模、份额、趋势分析报告:按技术、作物类型、应用、地区、细分市场预测,2025-2030 年全球特种肥料市场规模(依特种肥料类型、作物类型、施用方法、区域范围及预测)
 特种肥料市场 - 全球产业规模、份额、趋势、机会和预测,按作物类型、形式、应用方式、技术、地区和竞争细分,2020-2030 年中东和非洲特种肥料:市场占有率分析、行业趋势和统计数据、成长预测(2025-2030 年)