


 |
市场调查报告书
商品编码
1693829
非洲工程塑胶:市场占有率分析、行业趋势和统计数据、成长预测(2024-2029)Africa Engineering Plastics - Market Share Analysis, Industry Trends & Statistics, Growth Forecasts (2024 - 2029) |
||||||
※ 本网页内容可能与最新版本有所差异。详细情况请与我们联繫。
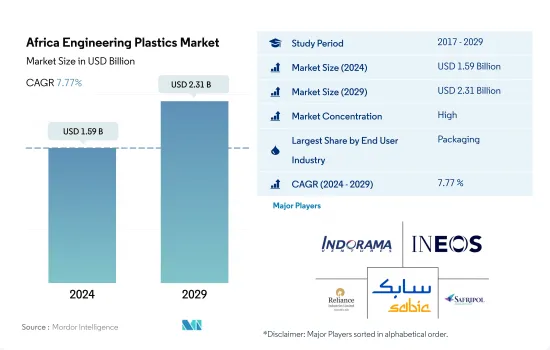
预计 2024 年非洲工程塑胶市场规模为 15.9 亿美元,到 2029 年将达到 23.1 亿美元,预测期内(2024-2029 年)的复合年增长率为 7.77%。
包装产业将在未来几年占据市场主导地位
- 2022年,非洲在全球工程塑胶市场的份额以收入计算为1.32%。树脂消费量增加的主要驱动因素之一是其在包装、电气和电子行业的使用日益增加。 2022年工程塑胶市场总销售额中,包装产业约占37.5%,电气电子产业约占12.18%。
- 2022年非洲塑胶包装产量将达313万吨,与前一年同期比较增加2.85%。该地区的塑胶包装产业主要是为了回应农业和食品工业的成长而发展起来的。食品业对成品包装的营销方面越来越感兴趣。预计在预测期内,对延长产品保质期和提高便利生活方式的需求将推动市场发展,销量复合年增长率为 4.95%。
- 电气和电子产业是该地区第二大产业。由于非洲收益不断增加,以及韩国领先的电气和电子设备品牌投资建立製造设施,例如 LG 新投资在苏丹建立洗衣机组装厂,该地区电气和电子设备组装收入预计将在 2022 年达到 320 亿美元。因此,该地区工程塑胶市场预计在 2023 年至 2029 年期间的收入复合年增长率将达到 7.41%。
- 预计汽车产业将成为市场上成长最快的产业,预测期内(2023-2029 年)的复合年增长率(以金额为准)为 8.93%。这是由于摩洛哥和南非汽车生产的扩张。
南非仍是该地区最大的市场
- 在奈及利亚、南非等非洲国家,工程塑胶被广泛应用于汽车、航太、工业机械等各个产业。 2022年,南非和奈及利亚分别占该地区杂项工程塑胶树脂价值的30.15%和10.69%。
- 由于新兴的航太、汽车和工业机械产业,南非是该地区最大的工程塑胶消费国。到 2022 年,该地区的飞机零件销售额将占约 68.7%,汽车产量将占约 44.3%。这些行业正在推动对各种树脂的需求不断增长。由于气候友善政策的不断增加,汽车、工业和机械产量不断增长,预计将推动南非对树脂的需求。
- 在奈及利亚,由于汽车产量增加以及工业和机械工业的成长等因素,对各种树脂的需求正在大幅增加。尼日利亚是非洲最大的汽车生产国。 2022年产量将达394,449辆,占非洲汽车产量的33%。该国的汽车产量正在扩大,尤其是两轮车。预计到 2029 年汽车产量将达到 584,350 辆,复合年增长率为 6.77%。预计这些因素将推动该国对工程塑胶的需求。
- 预计南非将成为非洲工程塑胶消费成长最快的经济体,受汽车产量成长以及航太和其他产业成长的推动,2023 年至 2029 年期间的复合年增长率为 6.45%(以收入计算)。例如,预计该国航太零件生产的以收益为准年增长率将达到 5.48%,从而推动南非工程塑胶市场的发展。
非洲工程塑胶市场趋势
製造业正在崛起以满足不断增长的需求
- 南非是非洲领先的製造地。其製造能力、高效的物流网络和优惠的区域市场进入使南非成为寻求供应非洲的电子公司的理想之位置。南非电子产业多元化,涵盖电子机械、家用电子电器产品、通讯设备、消费性电子产品等。 2022年,非洲地区进口满足其本土电气和电子设备需求的约70%。
- 家用电子电器产业仍高度依赖进口。据估计,2018年南非进口了非洲60%的消费性电子产品。 2020年,由于政府采取大规模封锁措施以及封锁导致的供应链中断,该国电气和电子设备产量销售年增率下降与前一年同期比较3.2%。在功能手机领域,由于厂商持续从功能手机转型为入门级智慧型手机,出货量较去年与前一年同期比较下降 26.6% 至 2,190 万台。所有这些因素导致该地区电气和电子元件产量下降,2020-2022 年期间的复合年增长率为 -9.41%。
- 政府致力于促进和支持国内製造、研发以及製定电气和电子製造的安全标准。预计预测期内(2023-2029 年),电气和电子元件产量的复合年增长率将达到 6.28%,以满足非洲新兴中产阶级的需求。
非洲工程塑胶行业概况
非洲工程塑胶市场相当集中,前五大公司占据100%的市场。该市场的主要企业有 Indorama Ventures Public Company Limited、INEOS、Reliance Industries Limited、SABIC、KAP Diversified Industrial (Pty) Ltd 的 Safripol 部门等。
其他福利
- Excel 格式的市场预测 (ME) 表
- 3个月的分析师支持
目录
第一章执行摘要和主要发现
第二章 报告要约
第三章 引言
- 研究假设和市场定义
- 研究范围
- 调查方法
第四章 产业主要趋势
- 最终用户趋势
- 航太
- 车
- 建筑与施工
- 电气和电子
- 包装
- 进出口趋势
- 氟树脂交易
- 聚酰胺(PA)贸易
- 聚对苯二甲酸乙二酯(PET)贸易
- 聚甲基丙烯酸甲酯(PMMA)贸易
- 聚甲醛(POM)贸易
- 苯乙烯共聚物(ABS和SAN)贸易
- 价格趋势
- 回收概述
- 聚酰胺(PA)回收趋势
- 聚碳酸酯(PC)回收趋势
- 聚对苯二甲酸乙二醇酯(PET)的回收趋势
- 苯乙烯共聚物(ABS、SAN)的回收趋势
- 法律规范
- 奈及利亚
- 南非
- 价值炼和通路分析
第五章市场区隔
- 最终用户产业
- 航太
- 车
- 建筑与施工
- 电气和电子
- 工业/机械
- 包装
- 其他的
- 树脂类型
- 氟树脂
- 依亚型
- 乙烯-四氟乙烯(ETFE)
- 氟化乙丙烯 (FEP)
- 聚四氟乙烯(PTFE)
- 聚氟乙烯(PVF)
- 聚二氟亚乙烯(PVDF)
- 其他子树脂类型
- 液晶聚合物(LCP)
- 聚酰胺(PA)
- 依树脂类型分
- 芳香聚酰胺
- 聚酰胺(PA)6
- 聚酰胺(PA)66
- 聚邻苯二甲酰胺
- 聚丁烯对苯二甲酸酯(PBT)
- 聚碳酸酯(PC)
- 聚醚醚酮(PEEK)
- 聚对苯二甲酸乙二醇酯(PET)
- 聚酰亚胺(PI)
- 聚甲基丙烯酸甲酯(PMMA)
- 聚甲醛(POM)
- 苯乙烯共聚物(ABS和SAN)
- 氟树脂
- 国家
- 奈及利亚
- 南非
- 其他非洲国家
第六章竞争格局
- 关键策略趋势
- 市场占有率分析
- 商业状况
- 公司简介
- Alfa SAB de CV
- Covestro AG
- Far Eastern New Century Corporation
- Indorama Ventures Public Company Limited
- INEOS
- JBF Industries Ltd
- Reliance Industries Limited
- Rohm GmbH
- SABIC
- Safripol division of KAP Diversified Industrial(Pty)Ltd
第七章 CEO 的关键策略问题
第 8 章 附录
- 世界概况
- 概述
- 五力分析框架(产业吸引力分析)
- 全球价值链分析
- 市场动态(DRO)
- 资讯来源及延伸阅读
- 图片列表
- 关键见解
- 数据包
- 词彙表
The Africa Engineering Plastics Market size is estimated at 1.59 billion USD in 2024, and is expected to reach 2.31 billion USD by 2029, growing at a CAGR of 7.77% during the forecast period (2024-2029).
Packaging industry to dominate the market in the coming years
- In 2022, the African engineering plastics market had a global share of 1.32% by revenue. One of the primary drivers of the increase in resin consumption is their increased use in the packaging, electrical, and electronics industries. The packaging and electrical and electronics industries accounted for around 37.5% of the revenue and 12.18% of the revenue of the overall engineering plastics market, respectively, in 2022.
- Africa's plastic packaging production had a volume of 3.13 million tons in 2022, a 2.85% growth compared to the previous year. This plastic packaging industry has developed in the region largely as a response to growth in the farming and food industries. The food industry is increasingly interested in the marketing aspect of packaging for their finished products. The need to improve the product's shelf-life and increase convenience lifestyle is expected to drive the market during the forecast period, registering a CAGR of 4.95% in terms of volume.
- The electrical and electronics industry is the second largest in the region. The region's revenue from electrical and electronics production was USD 32 billion in 2022, with increasing demand for electrical and electronics in Africa and major South Korean electrical and electronics brands investing in setting up their manufacturing facilities, like LG's new investment in setting up washing machine assembly plant in Sudan. As a result, the engineering plastics market in the region is expected to record a CAGR of 7.41%, by revenue, from 2023 to 2029.
- The automotive industry is projected to be the fastest-growing industry in the market, with a CAGR of 8.93%, by value, during the forecast period (2023-2029). This can be attributed to the growing automotive production in Morocco and South Africa.
South Africa to remain the largest market in the region
- Engineering plastics are used in African countries such as Nigeria and South Africa for various industries, including automotive, aerospace, and industrial machinery. In 2022, South Africa and Nigeria accounted for 30.15% and 10.69% of the values of various engineering plastic resins, respectively, in the region.
- South Africa is the largest consumer of engineering plastics in the region, owing to its rising aerospace, automotive, and industrial machinery industries. Aircraft components and vehicle production held a share of around 68.7% by revenue and 44.3% by volume compared at the regional level, respectively, in 2022. These industries are driving the increasing demand for various resins. The rising automotive, industrial, and machinery production due to increased climate-conscious policies is expected to drive the demand for resins in South Africa.
- The demand for various resins in Nigeria is increasing significantly due to rising vehicle production and growth in the industrial and machinery industry, among other factors. Nigeria is Africa's largest vehicle producer. In 2022, the country produced 394,449 units, translating to a 33% share of vehicle production in Africa. The production of vehicles in the country is expanding, especially of two-wheelers. The production of vehicles is expected to reach 584,350 units by 2029, recording a CAGR of 6.77%. These factors are expected to drive the demand for engineering plastics in the country.
- South Africa is expected to be the fastest-growing country in Africa for the consumption of engineering plastics, with a CAGR of 6.45%, by revenue, from 2023 to 2029, owing to increased vehicle production and growth in aerospace and other industries. For example, aerospace component production in the country is expected to record a CAGR of 5.48%, by revenue, during the forecast period, and it is expected to drive the South African engineering plastics market.
Africa Engineering Plastics Market Trends
Manufacturing on the rise to tackle the rapidly growing demand
- South Africa is the leading manufacturing hub in Africa. Its manufacturing capabilities, efficient logistics network, and preferential regional market access position the country as an ideal location for electronics companies seeking to supply their products to Africa. South Africa has a diverse electronics industry that ranges from electrical machinery, household appliances, and telecommunication equipment to consumer electronics. In 2022, the African region imported around 70% of its local electrical and electronics demand.
- The consumer electronics industry still relies heavily on imports. According to estimates, South Africa brought 60% of all consumer electronics into Africa in 2018. In 2020, the electrical and electronic production in the country decreased at a growth rate of around 3.2%, by revenue, compared to the previous year, owing to the widespread lockdown adopted by the government and the supply chain disruption faced due to the lockdown. In the feature phone space, shipments were down by 26.6% to 21.9 million units as vendors were transitioning away from these devices toward entry-level smartphones. All such factors led to a decrease in the production of electrical and electronic components in the region at a CAGR of -9.41% from 2020 to 2022.
- The government is focused on promoting and supporting domestic manufacturing, R&D, and developing safety standards for the electrical and electronics manufacturing industry. The output of electrical and electronic industrial components is anticipated to record a CAGR of 6.28% during the forecast period (2023-2029) to supply the emerging African middle-class population.
Africa Engineering Plastics Industry Overview
The Africa Engineering Plastics Market is fairly consolidated, with the top five companies occupying 100%. The major players in this market are Indorama Ventures Public Company Limited, INEOS, Reliance Industries Limited, SABIC and Safripol division of KAP Diversified Industrial (Pty) Ltd (sorted alphabetically).
Additional Benefits:
- The market estimate (ME) sheet in Excel format
- 3 months of analyst support
TABLE OF CONTENTS
1 EXECUTIVE SUMMARY & KEY FINDINGS
2 REPORT OFFERS
3 INTRODUCTION
- 3.1 Study Assumptions & Market Definition
- 3.2 Scope of the Study
- 3.3 Research Methodology
4 KEY INDUSTRY TRENDS
- 4.1 End User Trends
- 4.1.1 Aerospace
- 4.1.2 Automotive
- 4.1.3 Building and Construction
- 4.1.4 Electrical and Electronics
- 4.1.5 Packaging
- 4.2 Import And Export Trends
- 4.2.1 Fluoropolymer Trade
- 4.2.2 Polyamide (PA) Trade
- 4.2.3 Polyethylene Terephthalate (PET) Trade
- 4.2.4 Polymethyl Methacrylate (PMMA) Trade
- 4.2.5 Polyoxymethylene (POM) Trade
- 4.2.6 Styrene Copolymers (ABS and SAN) Trade
- 4.3 Price Trends
- 4.4 Recycling Overview
- 4.4.1 Polyamide (PA) Recycling Trends
- 4.4.2 Polycarbonate (PC) Recycling Trends
- 4.4.3 Polyethylene Terephthalate (PET) Recycling Trends
- 4.4.4 Styrene Copolymers (ABS and SAN) Recycling Trends
- 4.5 Regulatory Framework
- 4.5.1 Nigeria
- 4.5.2 South Africa
- 4.6 Value Chain & Distribution Channel Analysis
5 MARKET SEGMENTATION (includes market size in Value in USD and Volume, Forecasts up to 2029 and analysis of growth prospects)
- 5.1 End User Industry
- 5.1.1 Aerospace
- 5.1.2 Automotive
- 5.1.3 Building and Construction
- 5.1.4 Electrical and Electronics
- 5.1.5 Industrial and Machinery
- 5.1.6 Packaging
- 5.1.7 Other End-user Industries
- 5.2 Resin Type
- 5.2.1 Fluoropolymer
- 5.2.1.1 By Sub Resin Type
- 5.2.1.1.1 Ethylenetetrafluoroethylene (ETFE)
- 5.2.1.1.2 Fluorinated Ethylene-propylene (FEP)
- 5.2.1.1.3 Polytetrafluoroethylene (PTFE)
- 5.2.1.1.4 Polyvinylfluoride (PVF)
- 5.2.1.1.5 Polyvinylidene Fluoride (PVDF)
- 5.2.1.1.6 Other Sub Resin Types
- 5.2.2 Liquid Crystal Polymer (LCP)
- 5.2.3 Polyamide (PA)
- 5.2.3.1 By Sub Resin Type
- 5.2.3.1.1 Aramid
- 5.2.3.1.2 Polyamide (PA) 6
- 5.2.3.1.3 Polyamide (PA) 66
- 5.2.3.1.4 Polyphthalamide
- 5.2.4 Polybutylene Terephthalate (PBT)
- 5.2.5 Polycarbonate (PC)
- 5.2.6 Polyether Ether Ketone (PEEK)
- 5.2.7 Polyethylene Terephthalate (PET)
- 5.2.8 Polyimide (PI)
- 5.2.9 Polymethyl Methacrylate (PMMA)
- 5.2.10 Polyoxymethylene (POM)
- 5.2.11 Styrene Copolymers (ABS and SAN)
- 5.2.1 Fluoropolymer
- 5.3 Country
- 5.3.1 Nigeria
- 5.3.2 South Africa
- 5.3.3 Rest of Africa
6 COMPETITIVE LANDSCAPE
- 6.1 Key Strategic Moves
- 6.2 Market Share Analysis
- 6.3 Company Landscape
- 6.4 Company Profiles (includes Global Level Overview, Market Level Overview, Core Business Segments, Financials, Headcount, Key Information, Market Rank, Market Share, Products and Services, and Analysis of Recent Developments).
- 6.4.1 Alfa S.A.B. de C.V.
- 6.4.2 Covestro AG
- 6.4.3 Far Eastern New Century Corporation
- 6.4.4 Indorama Ventures Public Company Limited
- 6.4.5 INEOS
- 6.4.6 JBF Industries Ltd
- 6.4.7 Reliance Industries Limited
- 6.4.8 Rohm GmbH
- 6.4.9 SABIC
- 6.4.10 Safripol division of KAP Diversified Industrial (Pty) Ltd
7 KEY STRATEGIC QUESTIONS FOR ENGINEERING PLASTICS CEOS
8 APPENDIX
- 8.1 Global Overview
- 8.1.1 Overview
- 8.1.2 Porter's Five Forces Framework (Industry Attractiveness Analysis)
- 8.1.3 Global Value Chain Analysis
- 8.1.4 Market Dynamics (DROs)
- 8.2 Sources & References
- 8.3 List of Tables & Figures
- 8.4 Primary Insights
- 8.5 Data Pack
- 8.6 Glossary of Terms
 工程塑胶:市场占有率分析、产业趋势与统计、成长预测(2026-2031)
 2026年全球工程塑胶市场报告
 5G专用工程塑胶:按树脂类型、製程、应用和最终用途产业分類的全球预测,2026-2032年PA66工程塑胶市场依製造流程、产品类型、等级及最终用途产业划分-2026-2032年全球预测
 先进工程聚合物市场预测至2032年:按聚合物类型、形态、性能、技术、最终用户和地区分類的全球分析
 日本工程塑胶市场报告(按树脂类型、最终用途产业和地区划分,2026-2034年)
 工程塑胶市场规模、份额和成长分析(按树脂类型、最终用途和地区划分)-2026-2033年产业预测
 改质塑胶市场规模、占有率、预测及趋势分析:依产品类型、改质类型和应用划分 - 全球预测至 2035 年
 工程塑胶市场规模、占有率、成长及全球产业分析:依类型、应用和地区划分的洞察与预测(2024-2032 年)
 PEEK特种工程塑胶:全球市场占有率及排名、总收入及需求预测(2025-2031年)