


 |
市场调查报告书
商品编码
1540309
Webscale 网路营运商2024年第二季市场回顾:资本支出年增 51%,自2018年第二季以来大幅成长 - 对产生 AI 泡沫影响前景的担忧Webscale Network Operators - 2Q24 Market Review: Capex Surge of 51% YoY in 2Q24 the Biggest Bump Since 2Q18, Jitters about the Generative AI Bubble Weigh on Outlook, though |
||||||
本报告回顾了2011年以来 Webscale 网路营运商(WNO/Webscale)的成长和发展。目标公司为21家。
最近12个月(2023年第三季至2024年第二季)营收为2.47兆美元(年成长8.2%),研发费用为3,010亿美元(年成长5.4%),设备投资达2,260亿美元(成长15.4%)。截至2024年6月,该公司帐上现金及短期投资为6,120亿美元(年减8.5%),负债总额为5,270亿美元(年减3.6%)。截至2024年6月,Webscaler的净PP&E帐面价值为7,870亿美元,年增19.8%。截至2024年第二季末,Webscaler 拥有约 4,182,000 名员工,较截至2023年 6月的4,085,000 名略有增加。
主要亮点:
- 营收:2024年第二季单期营收为6,144亿美元,年增8.4%,预估年营收为24,660亿美元。营收成长由四家主要公司引领:Alphabet、Amazon、Meta(FB)和Microsoft。这些公司已连续四个季实现两位数的营收成长,明显优于同业。 Meta 在2024年第二季的年化期间成长最快,从2022年第三季到2023年第二季成长了24.3%,其次是Microsoft(成长15.7%)和Alphabet(成长13.4%)、Amazon(成长12.3%)。Amazon对2024年第二季的成长影响最大,其营收较2023年第二季增加了 136亿美元,使2024年第二季达到 1,480亿美元,以美元计算年增 10.1%。成长受到最大限制的是中国电子商务公司JD.com,该公司2024年第二季的营收年减 8亿美元(-2.0%),至 402亿美元。
- 资本支出:2023年网路规模资本支出下降5%,但2024年前两季表现强劲,第一季为25%,第二季成长为51%。由此,2024年第二季资本支出年化达2,264亿美元,创历史新高,较去年同期成长15.4%。网路扩展者继续长期努力购买大规模土地并开发全新的资料中心园区。然而,这种激增似乎主要是由技术支出推动的,特别是为已投入运作的资料中心设施购买伺服器(GPU 和 CPU)。第二季(2022年4月至6月)资本支出年化率为44%,但最近两个季,网路/IT和软体资本支出占总资本支出的54%。2024年第二季资本支出最高的公司是Amazon(176亿美元),其次是Microsoft(139亿美元)、Alphabet(132亿美元)和 Meta(FB)(82亿美元)。这四家公司约占单季支出的80%。这些因素都是NVIDIA股价不可持续上涨的背后原因。
- 获利能力:Webscale2024年第二季的自由现金流利润率平均为18.6%,2023年第二季的年化率为16.3%,远高于第22 季的14.4%。平均净利率也很强劲,整个市场的年化利润率从2023年第二季的15.2%和2022年第二季的16.3%成长到2024年第二季的18.8%。 Meta(FB)和Microsoft在这两个类别的利润率最高。儘管规模庞大,Amazon却永远拖累了利润率。Alibaba和 Alphabet 的自由现金流显着低于2023年第二季,对市场平均值产生负面影响。
- 员工人数:截至2024年 6月,Webscale 市场的员工人数为 418万人,较截至2023年 6月的408万人略有增加。考虑到一些网路扩展商的规模及其劳动力变化的速度,尤其是对于电子商务专家来说,这种差异可以忽略不计。自2021年下半年以来,员工人数稳定在410万至420万左右。一些最大的网路缩放器大力投资人工智慧和 GenAI,他们的明确目标之一是提高内部成本效率。这不可避免地意味着员工数量的减少。电子商务领域机器人和自动驾驶汽车在物流链中的使用也有所增加。未来网路规模的就业不太可能大幅增加。
调查范围
|
|
|
|
目录
第1章 报告要点
第2章 展望
第3章 分析
第4章 主要统计
第5章 公司详细资料
第6章 8大WNO
第7章 企业基准测试
第8章 区域细分
第9章 原始资料
第10章 汇率
第11章 关于本公司
This report reviews the growth and development of the webscale network operator (WNO, or webscale) market since 2011. It covers 21 companies. In the most recent a12 months (3Q23-2Q24), webscalers represented $2.47 trillion (T) in revenues (+8.2% YoY), $301 billion (B) in R&D spending (+5.4% YoY), and $226B in capex (+15.4% YoY). They had $612B of cash and short-term investments (-8.5% YoY) on the books as of June 2024, and $527B in total debt (-3.6% YoY). The value of webscalers' net plant, property & equipment (net PP&E) on the books as of June 2024 was $787B, up 19.8% YoY. Webscalers employed approximately 4.182 million (M) people at the end of 2Q24, up a bit from the June 2023 total of 4.085M.
VISUALS
Below are key highlights from the report:
- Revenues: Single quarter revenues in 2Q24 were $614.4 billion (B), up 8.4% YoY. That pushed annualized revenues to $2.466 trillion. Topline growth has been driven by the big 4: Alphabet, Amazon, Meta (FB) and Microsoft. For four straight quarters, all of these companies have recorded double digit revenue growth, well above the rest of the pack. For the 2Q24 annualized period, the fastest growth came from Meta, up 24.3% versus 3Q22-2Q23, followed by Microsoft (+15.7%), Alphabet (13.4%), and Amazon (12.3%). The biggest dollar impact on growth in 2Q24 came from Amazon, as its revenues grew $13.6 billion from 2Q23 to end 2Q24 at $148B, up 10.1% YoY. The biggest curb on growth was Chinese ecommerce player JD.com, which recorded 2Q24 revenues of $40.2B, down $0.8B YoY (-2.0%).
- Capex: After declining 5% in 2023, webscale capex has been on a tear for the first two quarters of 2024, growing 25% and 51% in 1Q24 and 2Q24 respectively. That pushed 2Q24 annualized capex to $226.4 billion in 2Q24, an all-time high and up 15.4% YoY. Webscalers continue with big land purchases and long-term efforts to develop all-new data center campuses. However, the surge appears to be driven largely by technology spending, in particular purchases of servers (GPU and CPU) for data center facilities already up and running. From 44% of annualized capex in 2Q22, Network/IT and software capex was 54% of total capex for the last two quarters. The biggest capex outlays in 2Q24 came from Amazon ($17.6B), Microsoft ($13.9B), Alphabet ($13.2B), and Meta (FB) ($8.2B). These four account for about 80% of single quarter spending. They are the reason behind the unsustainable surge in the price of NVIDIA stock.
- Profitability: Webscale free cash flow margins averaged out to 18.6% for the 2Q24 annualized period, much higher than the 16.3% and 14.4% recorded in the annualized 2Q23 and 2Q22 timeframes. Average net profit margins are also strong, totaling 18.8% for the overall market in 2Q24 annualized, from 15.2% in 2Q23 and 16.3% in 2Q22. Meta (FB) and Microsoft have the highest overall margins across these two categories. Amazon is a perpetual drag on margins despite its size. Alibaba and Alphabet both reported FCF figures substantially lower than 2Q23, impacting the market average negatively.
- Employees: Headcount in the webscale market totaled to 4.18 million in June 2024, slightly up from 4.08 million in June 2023. This difference is negligible, considering the size of some of the webscalers and how quickly the ecommerce specialists in particular can change workforce levels. Headcount has been approximately 4.1 to 4.2 million steadily since late 2021. Some of the biggest webscalers are investing heavily in AI and GenAI, with one clear goal being to improve their internal cost efficiencies. This inevitably will mean fewer employees. Even within the ecommerce space, there is a rising use of robots and autonomous vehicles in the logistics chain. Webscale employment is unlikely to rise much from here, if at all.
- Regional trends: The Asia-Pacific region has been a drag on the market for several quarters. Webscale revenues in the Americas, Europe, and MEA have been growing in the low double digit range for a few quarters, but AP has been weak: 2Q24 revenue growth was 3% YoY, after a 2% increase in 1Q24. Weak Asian currencies and a very competitive 'big tech' market in China account for the gap. One factor is TikTok's owner, ByteDance: this private company has exploded in the last 3 years, impacting negatively the measured growth of the publicly traded Chinese webscalers that we do track (Alibaba, Baidu, JD, and Tencent). The ByteDance surge also ate into the 2022-23 growth of some western webscalers, notably Meta (FB), but that effect has ebbed.
Coverage
Top 8 WNOs
|
|
Other WNOs
|
|
Table of Contents
1. Report highlights
2. Outlook
3. Analysis
4. Key Stats
5. Company Drilldown
6. Top 8 WNOs
7. Company Benchmarking
8. Regional Breakouts
9. Raw Data
10. Exchange Rates
11. About
Figures & Charts
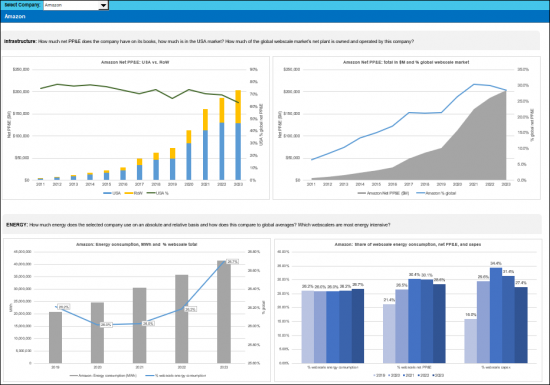
- 1. Key Metrics: Growth rates, Annualized 2Q24/2Q23 vs. 2019-23
- 2. WNO Revenues: Single-quarter & annualized (US$M)
- 3. Top 8 WNOs: YoY revenue growth in 2Q24
- 4. Annualized profitability: WNOs
- 5. Free cash flow per employee, 2Q24 annualized (US$)
- 6. FCF Margins vs. Net Margins, 2Q24 annualized
- 7. Advertising revenues as % total (FY2023)
- 8. Annualized capex and R&D spending: WNOs (% revenues)
- 9. WNO capex by type, Annualized: 2Q15-2Q24 (US$M)
- 10. Network & IT capex as share of revenues, 2Q24 annualized
- 11. R&D expenses as % revenues, Top 8 WNOs (2Q24 annualized)
- 12. Acquisition spending vs. capex spending, annualized (US$M)
- 13. Net PP&E per employee (US$' 000) - 2Q24
- 14. Ranking the Webscale Network Operators: Revenues; R&D; Capex; Network & IT capex - 2023 & 2Q24 (US$B)
- 15. Annualized spending share for key webscalers since 2011 Capex: Network, IT and software
- 16. Share of webscale spending by company, 2Q24 and 2Q23 annualized (Capex: Network, IT and software)
- 17. Energy consumption vs. Net PP&E for key webscalers in 2023
- 18. USA: Webscale capex total ($M) and % of global market, 2011-23
- 19. Webscale vs. Telco Market: Annualized Capex (US$B)
- 20. Webscale vs. Telco Market: Annualized capital intensity
- 21. Revenues: annual, single-quarter, and annualized (US$M)
- 22. Profitability (Net Profit; Cash from operations; Free cash flow): annual, single-quarter, and annualized (US$M)
- 23. Spending (R&D; M&A; Capex; Network & IT capex; Lease): annual, single-quarter, and annualized (US$M)
- 24. Cash & Short-term Investments: annual and single-quarter (US$M)
- 25. Debt (Total debt; Net debt): annual and single-quarter (US$M)
- 26. Property, Plant & Equipment: annual and single-quarter (US$M)
- 27. Key Ratios: Net margin; R&D/revenues; Capex/revenues; Network & IT capex/revenues; Free cash flow/revenues; Lease costs/revenues - annual and annualized (%)
- 28. Total employees
- 29. Revenue per employee, annualized (US$K)
- 30. FCF per employee, annualized (US$K)
- 31. Net PP&E per employee, annualized (US$K)
- 32. Revenues & Spending (US$M)
- 33. Webscale Business Mix by Revenues (FY2023) - MTN Consulting estimates
- 34. Top 10 recent acquisitions & investments
- 35. Data center footprint
- 36. Revenues (US$M) & YoY revenue growth (%), single-quarter: by company
- 37. Revenues, annualized (US$M): by company
- 38. Annualized profitability margins: by company
- 39. Annualized capex and capital intensity: by company
- 40. Annualized capex and R&D spending as % of revenues: by company
- 41. Share of WNO network & IT capex, Annualized: by company
- 42. Total employees: by company
- 43. Annualized per-employee metrics (US$000s): by company
- 44. Net debt (debt minus cash & stock) (US$M): by company
- 45. Top 10 webscale employers in 2Q24: Global market
- 46. Headcount changes in 2Q24 (YoY %): Global market
- 47. Net PP&E: USA vs. RoW (by company)
- 48. Net PP&E: total in $M and % global webscale market (by company)
- 49. Energy consumption, MWh and % webscale total (by company)
- 50. Share of webscale energy consumption, net PP&E, and capex (by company)
- 51. Energy intensity relative to webscale average and select data center-focused CNNOs (by company)
- 52. Energy intensity in webscale sector, 2023: MWh consumed per $M in revenue
- 53. Capex/revenues (annualized): Company vs. Webscale average
- 54. Revenue per employee (US$000s) (annualized): Company vs. Webscale average
- 55. 2017 vs. 2023: company benchmark by KPI (Revenues, R&D, Net profit, Cash from operations, Capex, Free cash flow, Cash & short-term investments, Net PP&E, Total debt)
- 56. 2017 vs. 2023: company benchmark by key ratio (Capex/revenues; R&D/revenues; Net margin; FCF margin)
- 57. Top 8 WNO's share vs. Rest of the market: by KPI (Revenues, R&D, Net profit, Cash from operations, Capex, Free cash flow, Cash & short-term investments, Net PP&E, Total debt)
- 58. Top 8 WNOs benchmarking by Key ratio: Capex/revenues; R&D/revenues; Net margin; FCF margin)
- 59. Total WNO Market Revenues, by region: Latest CY; Latest Quarter; Annual trend (2011-23); Single quarter (2Q15-2Q24 )
- 60. WNO Market: Revenues, single-quarter (YoY % change)
- 61. Regional revenues by operator: Latest CY; Latest Quarter; Annual trend (2011-23); Single quarter (2Q15-2Q24)
- 62. Top 10 operators by region: Latest CY; Latest Quarter
 Apps Run The World - 应用市场分析与买家洞察
 电信网路营运商2024年第一季市场回顾:5G建设完成促使资本投资骤降9.4%,利润率小幅萎缩,电信业者获利受到衝击
 虚拟网路营运商世界市场报告(2024 年)
 营运商中立网路营运商(CNNO)-市场回顾(2023年第4季):
 虚拟网路营运商 (VNO) 的全球市场预测(截至 2030 年):按类型、目标客户、服务、技术、最终用户和地区进行分析
 虚拟网路营运商市场- 按服务(行动虚拟网路营运商(MVNO)、固定虚拟网路营运商(FVNO))、按产品(预付费、后付费)、按最终用户(消费者、企业)、2024 - 2032 年预测
 网路营运商预测(~2028 年):资本支出将在 2023 年下降后恢復,并在 2028 年增长至约 6500 亿美元,生成式人工智慧推动资本支出和员工人数减少
 营运商中立者希望搭乘 GenAI 浪潮 - 2023 年 1 月更新:CNNO 收入预计在 2023 年达到 100B 美元,资本密集度 >35%,因为行业抓住生成式 AI 和 5G 緻密化的机会
 运营商中立部门的2022年的OPEX电费及燃料费对剧增:对许多运营商中立部门经营者来说电费及燃料费是最大的运营成本,占OPEX (ex-D&A) 的最大80%
 职业中性增长在行业整合中放缓2022:年市场收入接近1000亿美元,对运营商行业的健康至关重要,但易受经济压力影响,私募股权公司崛起