


 |
市场调查报告书
商品编码
1885889
非基因改造蛋白水解物市场机会、成长驱动因素、产业趋势分析及预测(2025-2034年)Non-GMO Protein Hydrolysates Market Opportunity, Growth Drivers, Industry Trend Analysis, and Forecast 2025 - 2034 |
||||||
2024 年全球非基因改造蛋白质水解物市值为 4.512 亿美元,预计到 2034 年将以 5.2% 的复合年增长率增长至 7.501 亿美元。
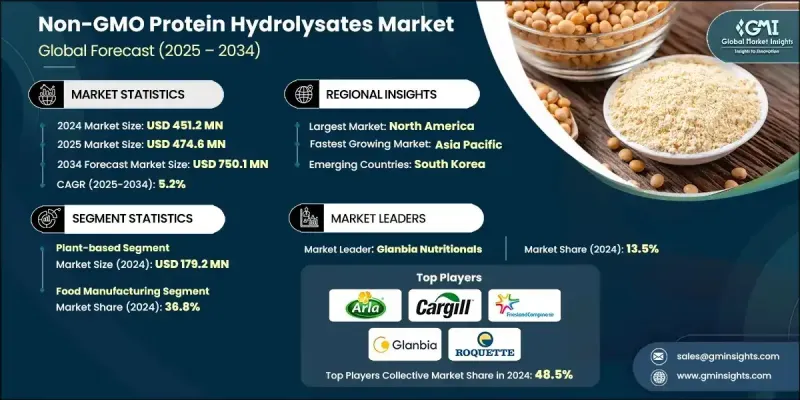
这些水解物源自非基因改造原料,并经过可控水解工艺,以提高其消化率、功能性和与清洁标籤产品标准的兼容性。消费者对天然和非基因改造配方的日益关注,推动了食品饮料、运动营养和膳食补充剂等领域的需求成长。北美是最大的区域市场,这得益于其严格的成分监管和完善的生产体系,能够生产优质水解物。同时,亚太地区继续保持最快的成长速度,这得益于快速的城市化进程、可支配收入的提高以及对食品安全和农业永续性的日益重视。印度和中国等国的政府措施进一步增强了消费者对非基因改造蛋白质成分的信任。食物不耐症和过敏症的增加也促使生产商优先考虑低过敏性和易消化的替代品,而这些替代品很大程度上依赖非基因改造水解物。在运动和积极生活方式营养领域,消费者对非基因改造水解物的需求尤其显着,他们始终在寻找能够提供性能提升且不含合成或基因改造成分的原料。
| 市场范围 | |
|---|---|
| 起始年份 | 2024 |
| 预测年份 | 2025-2034 |
| 起始值 | 4.512亿美元 |
| 预测值 | 7.501亿美元 |
| 复合年增长率 | 5.2% |
2024年,植物性食品市场规模达1.792亿美元,反映消费者对永续来源、非基因改造蛋白质原料的强劲需求。消费者越来越倾向于选择天然且成分透明的产品,因此他们更青睐符合道德规范和清洁标籤理念的植物水解物。
2024 年,食品製造业占了 36.8% 的市场。该行业受益于水解物作为功能性成分的日益广泛应用,这些成分可以增强食品的质地、营养价值和风味,同时满足包装食品中对无过敏原和天然成分日益增长的需求。
预计2025年至2034年间,北美非基因改造蛋白水解物市场将以5.3%的复合年增长率成长。在消费者意识不断增强以及对清洁标籤、低致敏性产品的偏好日益增长的推动下,该地区持续将这些水解物应用于功能性食品、特殊营养品和膳食补充剂产品中。酶水解技术和永续萃取方法的进步正在生产出更高品质的生物活性成分,以满足不断变化的健康趋势。
非基因改造蛋白水解物市场的领导企业包括嘉吉公司 (Cargill Inc.)、泰坦生物科技 (Titan Biotech)、格兰比亚营养品公司 (Glanbia Nutritionals)、洛克特兄弟公司 (Roquette Freres)、柴坦尼亚农业生物科技私人有限公司 (Chaitanya Agro Biotech Pvt. Ltd.)、新香兰肯巴香料公司 (Flavland), Flavers Ltd. Fragrances Inc.)、卡伯里公司 (Carbery)、塔图亚合作乳业有限公司 (Tatua Co-operative Dairy Company Limited) 和阿拉食品配料集团 (Arla Foods Ingredients Group)。这些公司正透过拓展产品线来增强其竞争优势,这些产品线主打清洁标籤、低致敏性和可持续来源的水解物,并针对食品、膳食补充剂和医疗营养应用进行客製化。许多公司正在投资先进的酵素加工技术,以改善风味、溶解度和生物活性胜肽谱,从而实现更高价值的配方。与食品製造商和健康品牌的策略合作正在帮助这些公司建立长期的供应伙伴关係。此外,这些公司也强调严格的品质认证和透明的采购流程,以增强消费者对非基因改造成分的信任。
目录
第一章:方法论与范围
第二章:执行概要
第三章:行业洞察
- 产业生态系分析
- 供应商格局
- 利润率
- 每个阶段的价值增加
- 影响价值链的因素
- 中断
- 产业影响因素
- 成长驱动因素
- 消费者对清洁标籤和非基因改造产品的需求不断增长
- 食物过敏和不耐症的盛行率不断上升
- 运动营养和积极生活方式市场不断成长
- 产业陷阱与挑战
- 生产成本高昂,定价较高
- 非基因改造原料供应有限
- 市场机会
- 动物饲料应用领域的拓展
- 个人化营养领域的新兴应用
- 成长驱动因素
- 成长潜力分析
- 监管环境
- 北美洲
- 欧洲
- 亚太地区
- 拉丁美洲
- 中东和非洲
- 波特的分析
- PESTEL 分析
- 技术与创新格局
- 当前技术趋势
- 新兴技术
- 价格趋势
- 按地区
- 来源
- 未来市场趋势
- 专利格局
- 贸易统计(HS编码)(註:仅提供重点国家的贸易统计资料)
- 主要进口国
- 主要出口国
- 永续性和环境方面
- 永续实践
- 减少废弃物策略
- 生产中的能源效率
- 环保倡议
- 碳足迹考量
第四章:竞争格局
- 介绍
- 公司市占率分析
- 按地区
- 北美洲
- 欧洲
- 亚太地区
- 拉丁美洲
- MEA
- 按地区
- 公司矩阵分析
- 主要市场参与者的竞争分析
- 竞争定位矩阵
- 关键进展
- 併购
- 合作伙伴关係与合作
- 新产品发布
- 扩张计划
第五章:市场估算与预测:依来源划分,2021-2034年
- 主要趋势
- 植物性
- 豌豆蛋白水解物
- 大豆蛋白水解物
- 米蛋白水解物
- 小麦/麸质水解物
- 动物性
- 乳蛋白水解物(乳清蛋白、酪蛋白)
- 肉类蛋白水解物
- 蛋清蛋白水解物
- 海洋
- 鱼蛋白水解物
- 胶原蛋白水解物
- 其他的
第六章:市场估算与预测:依应用领域划分,2021-2034年
- 主要趋势
- 治疗和医疗应用
- 婴幼儿营养
- 成人临床营养
- 特殊医学用途食品
- 消费者营养与健康应用
- 运动与表现营养
- 整体健康与保健
- 食品製造应用
- 加工食品原料
- 饮料原料
- 增强风味和质地
- 动物营养应用
- 伴侣动物饲料
- 牲畜饲料
- 水产饲料
- 其他的
第七章:市场估计与预测:依地区划分,2021-2034年
- 主要趋势
- 北美洲
- 我们
- 加拿大
- 欧洲
- 德国
- 英国
- 法国
- 西班牙
- 义大利
- 欧洲其他地区
- 亚太地区
- 中国
- 印度
- 日本
- 澳洲
- 韩国
- 亚太其他地区
- 拉丁美洲
- 巴西
- 墨西哥
- 阿根廷
- 拉丁美洲其他地区
- 中东和非洲
- 沙乌地阿拉伯
- 南非
- 阿联酋
- 中东和非洲其他地区
第八章:公司简介
- Arla Foods Ingredients Group
- Carbery
- Cargill Inc.
- Chaitanya Agro Biotech Pvt. Ltd.
- FrieslandCampina
- Glanbia Nutritionals
- International Flavors & Fragrances Inc
- Roquette Freres
- Tatua Co-operative Dairy Company Limited
- Titan Biotech
The Global Non-GMO Protein Hydrolysates Market was valued at USD 451.2 million in 2024 and is estimated to grow at a CAGR of 5.2% to reach USD 750.1 million by 2034.
These hydrolysates are produced from non-genetically modified sources and undergo controlled hydrolysis to enhance digestibility, functionality, and compatibility with clean-label product standards. Rising interest in natural and non-GMO formulations is strengthening demand across food and beverage applications, sports nutrition, and dietary supplements. North America represents the largest regional market due to strict ingredient regulations and a well-developed manufacturing framework capable of producing premium-grade hydrolysates. Meanwhile, Asia Pacific continues to grow at the fastest pace, supported by rapid urbanization, higher disposable incomes, and increased focus on food safety and agricultural sustainability. Government measures across countries such as India and China further reinforce consumer trust in non-GMO protein ingredients. The rise in food intolerances and allergies is also influencing producers to prioritize hypoallergenic and easily digestible alternatives, which rely heavily on non-GMO hydrolysates. Interest is especially notable in sports and active lifestyle nutrition, where shoppers consistently seek ingredients that deliver performance benefits without synthetic or genetically modified components.
| Market Scope | |
|---|---|
| Start Year | 2024 |
| Forecast Year | 2025-2034 |
| Start Value | $451.2 Million |
| Forecast Value | $750.1 Million |
| CAGR | 5.2% |
The plant-based category generated USD 179.2 million in 2024, reflecting strong demand for sustainably sourced, GMO-free protein inputs. Growing preference for natural and transparent ingredient lists has led consumers to favor plant-derived hydrolysates that align with ethical and clean-label expectations.
The food manufacturing segment held a 36.8% share in 2024. This segment benefits from increasing use of hydrolysates as functional components that enhance texture, nutritional value, and flavor while meeting rising demand for allergen-friendly and natural ingredients in packaged foods.
North America Non-GMO Protein Hydrolysates Market is projected to grow at a 5.3% CAGR between 2025 and 2034. The region continues to adopt these hydrolysates in functional foods, specialized nutrition, and supplement products, driven by strong consumer awareness and rising preference for clean-label, allergen-conscious options. Advances in enzymatic hydrolysis and sustainable extraction methods are producing higher-quality bioactive ingredients suited to evolving wellness trends.
Leading companies in the Non-GMO Protein Hydrolysates Market include Cargill Inc., Titan Biotech, Glanbia Nutritionals, Roquette Freres, Chaitanya Agro Biotech Pvt. Ltd., FrieslandCampina, International Flavors & Fragrances Inc., Carbery, Tatua Co-operative Dairy Company Limited, and Arla Foods Ingredients Group. Companies are strengthening their competitive position by expanding product lines that feature clean-label, allergen-friendly, and sustainably sourced hydrolysates tailored to food, supplement, and medical nutrition applications. Many firms are investing in advanced enzymatic processing technologies to improve flavor, solubility, and bioactive peptide profiles, enabling higher-value formulations. Strategic collaborations with food manufacturers and wellness brands are helping companies secure long-term supply partnerships. Firms are also emphasizing rigorous quality certification and transparent sourcing practices to reinforce consumer trust in non-GMO ingredients.
Table of Contents
Chapter 1 Methodology & Scope
- 1.1 Market scope and definition
- 1.2 Research design
- 1.2.1 Research approach
- 1.2.2 Data collection methods
- 1.3 Data mining sources
- 1.3.1 Global
- 1.3.2 Regional/Country
- 1.4 Base estimates and calculations
- 1.4.1 Base year calculation
- 1.4.2 Key trends for market estimation
- 1.5 Primary research and validation
- 1.5.1 Primary sources
- 1.6 Forecast model
- 1.7 Research assumptions and limitations
Chapter 2 Executive Summary
- 2.1 Industry 3600 synopsis
- 2.2 Key market trends
- 2.2.1 Source trends
- 2.2.2 Application trends
- 2.2.3 Regional trends
- 2.3 TAM Analysis, 2025-2034
- 2.4 CXO perspectives: strategic imperatives
- 2.4.1 Executive decision points
- 2.4.2 Critical success factors
- 2.5 Future outlook and strategic recommendations
Chapter 3 Industry Insights
- 3.1 Industry ecosystem analysis
- 3.1.1 Supplier landscape
- 3.1.2 Profit margin
- 3.1.3 Value addition at each stage
- 3.1.4 Factor affecting the value chain
- 3.1.5 Disruptions
- 3.2 Industry impact forces
- 3.2.1 Growth drivers
- 3.2.1.1 Rising consumer demand for clean-label & non-GMO products
- 3.2.1.2 Increasing prevalence of food allergies & intolerances
- 3.2.1.3 Growing sports nutrition & active lifestyle market
- 3.2.2 Industry pitfalls and challenges
- 3.2.2.1 High production costs & premium pricing
- 3.2.2.2 Limited raw material availability for non-GMO sources
- 3.2.3 Market opportunities
- 3.2.3.1 Expansion in animal feed applications
- 3.2.3.2 Emerging applications in personalized nutrition
- 3.2.1 Growth drivers
- 3.3 Growth potential analysis
- 3.4 Regulatory landscape
- 3.4.1 North America
- 3.4.2 Europe
- 3.4.3 Asia Pacific
- 3.4.4 Latin America
- 3.4.5 Middle East & Africa
- 3.5 Porter's analysis
- 3.6 PESTEL analysis
- 3.7 Technology and Innovation landscape
- 3.7.1 Current technological trends
- 3.7.2 Emerging technologies
- 3.8 Price trends
- 3.8.1 By region
- 3.8.2 By source
- 3.9 Future market trends
- 3.10 Patent landscape
- 3.11 Trade statistics (HS code) ( Note: the trade statistics will be provided for key countries only)
- 3.11.1 Major importing countries
- 3.11.2 Major exporting countries
- 3.12 Sustainability and environmental aspects
- 3.12.1 Sustainable practices
- 3.12.2 Waste reduction strategies
- 3.12.3 Energy efficiency in production
- 3.12.4 Eco-friendly initiatives
- 3.13 Carbon footprint consideration
Chapter 4 Competitive Landscape, 2024
- 4.1 Introduction
- 4.2 Company market share analysis
- 4.2.1 By region
- 4.2.1.1 North America
- 4.2.1.2 Europe
- 4.2.1.3 Asia Pacific
- 4.2.1.4 LATAM
- 4.2.1.5 MEA
- 4.2.1 By region
- 4.3 Company matrix analysis
- 4.4 Competitive analysis of major market players
- 4.5 Competitive positioning matrix
- 4.6 Key developments
- 4.6.1 Mergers & acquisitions
- 4.6.2 Partnerships & collaborations
- 4.6.3 New product launches
- 4.6.4 Expansion plans
Chapter 5 Market Estimates and Forecast, By Source, 2021-2034 (USD Million) (Kilo Tons)
- 5.1 Key trends
- 5.2 Plant-based
- 5.2.1 Pea protein hydrolysates
- 5.2.2 Soy protein hydrolysates
- 5.2.3 Rice protein hydrolysates
- 5.2.4 Wheat/gluten hydrolysates
- 5.3 Animal-based
- 5.3.1 Milk protein hydrolysates (whey, casein)
- 5.3.2 Meat protein hydrolysates
- 5.3.3 Egg protein hydrolysates
- 5.4 Marine-based
- 5.4.1 Fish protein hydrolysates
- 5.4.2 Collagen hydrolysates
- 5.5 Others
Chapter 6 Market Estimates and Forecast, By Application, 2021-2034 (USD Million) (Kilo Tons)
- 6.1 Key trends
- 6.2 Therapeutic & medical applications
- 6.2.1 Infant & pediatric nutrition
- 6.2.2 Adult clinical nutrition
- 6.2.3 Foods for special medical purposes
- 6.3 Consumer nutrition & wellness applications
- 6.3.1 Sports & performance nutrition
- 6.3.2 General health & wellness
- 6.4 Food manufacturing applications
- 6.4.1 Processed food ingredients
- 6.4.2 Beverage ingredients
- 6.4.3 Flavor & texture enhancement
- 6.5 Animal nutrition applications
- 6.5.1 Companion animal feed
- 6.5.2 Livestock feed
- 6.5.3 Aquaculture feed
- 6.6 Others
Chapter 7 Market Estimates and Forecast, By Region, 2021-2034 (USD Billion) (Kilo Tons)
- 7.1 Key trends
- 7.2 North America
- 7.2.1 U.S.
- 7.2.2 Canada
- 7.3 Europe
- 7.3.1 Germany
- 7.3.2 UK
- 7.3.3 France
- 7.3.4 Spain
- 7.3.5 Italy
- 7.3.6 Rest of Europe
- 7.4 Asia Pacific
- 7.4.1 China
- 7.4.2 India
- 7.4.3 Japan
- 7.4.4 Australia
- 7.4.5 South Korea
- 7.4.6 Rest of Asia Pacific
- 7.5 Latin America
- 7.5.1 Brazil
- 7.5.2 Mexico
- 7.5.3 Argentina
- 7.5.4 Rest of Latin America
- 7.6 Middle East and Africa
- 7.6.1 Saudi Arabia
- 7.6.2 South Africa
- 7.6.3 UAE
- 7.6.4 Rest of Middle East and Africa
Chapter 8 Company Profiles
- 8.1 Arla Foods Ingredients Group
- 8.2 Carbery
- 8.3 Cargill Inc.
- 8.4 Chaitanya Agro Biotech Pvt. Ltd.
- 8.5 FrieslandCampina
- 8.6 Glanbia Nutritionals
- 8.7 International Flavors & Fragrances Inc
- 8.8 Roquette Freres
- 8.9 Tatua Co-operative Dairy Company Limited
- 8.10 Titan Biotech
 蛋白质水解物市场规模、份额及成长分析(依产品类型、形态类型、应用类型及地区划分)-2026-2033年产业预测
 全球蛋白质水解物市场规模、份额、趋势和成长分析报告(2026-2034)
 有机蛋白水解物市场机会、成长驱动因素、产业趋势分析及预测(2025-2034年)单细胞蛋白水解物市场机会、成长驱动因素、产业趋势分析及预测(2025-2034年)精准发酵法製备蛋白水解物市场机会、成长驱动因素、产业趋势分析及预测(2025-2034年)老年营养蛋白水解物市场机会、成长驱动因素、产业趋势分析及预测(2025-2034年)下一代蛋白质水解物市场机会、成长驱动因素、产业趋势分析及预测(2025-2034)
 蛋白质水解物市场-全球产业规模、份额、趋势、机会和预测,按类型、来源、形态、製程、应用、地区和竞争格局划分,2020-2030年预测食品废弃物衍生蛋白水解物市场机会、成长驱动因素、产业趋势分析及预测(2025-2034年)发酵蛋白水解物市场机会、成长驱动因素、产业趋势分析及预测(2025-2034年)