


 |
市场调查报告书
商品编码
1693520
次生大分子营养肥料:市场占有率分析、产业趋势与统计、成长预测(2025-2030)Secondary Macronutrients Fertilizer - Market Share Analysis, Industry Trends & Statistics, Growth Forecasts (2025 - 2030) |
||||||
※ 本网页内容可能与最新版本有所差异。详细情况请与我们联繫。
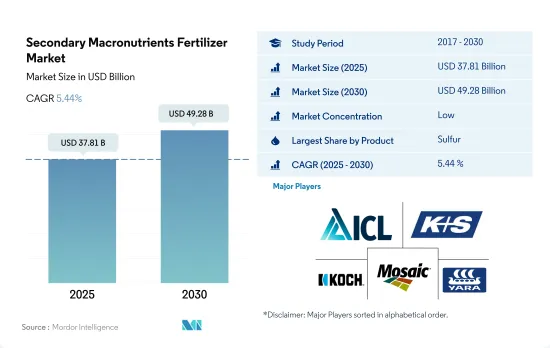
预计 2025 年次要营养素肥料市场规模将达到 378.1 亿美元,到 2030 年将达到 492.8 亿美元,预测期内(2025-2030 年)的复合年增长率为 5.44%。
硫肥的采用率高于其他次要营养元素
- 2021年,硫占全球次要营养元素肥料市场的42.6%。 2021年,欧洲硫磺市场价值约为11.9亿美元。其中特种硫肥的市场占有率约为49.4%,常规硫肥的市场占有率约为50.1%。专用硫肥的采用率高于其他中量营养素。预计预测期结束时特种硫肥市场规模将达 18.2 亿美元。
- 2021 年,镁占全球次要营养元素肥料市场的 48.9% 。田间作物占比最大,为 88.8%,其次是草坪和观赏作物,为 3.9%,园艺作物为 7.3%。耗肥最多的作物是小麦和玉米,总合占土地面积的40.0%。
- 钙占全球次要营养素肥料市场总量的 8.4%,2021 年的价值约为 5.387 亿美元。亚太地区在钙肥市场占据主导地位,约占全球钙肥市场的 41.1%,2021 年的价值为 2.216 亿美元。亚太地区在钙肥市场的主导地位主要是由于土壤酸化,导致钙和镁等碱性阳离子的流失,并被铁和铝错合等酸性元素所取代。
- 由于作物种植面积减少,进而需要提高生产率,因此预测期内对次生大量营养肥料的需求预计会增加。
气候变迁和土壤 pH 值的波动可能会推动市场
- 施用中量营养素肥料对作物产量有正面的影响。随着现代产量作物系统的出现,对钙、镁和硫的需求不断增加,这些元素已被证明在植物生产力中发挥着至关重要的作用。
- 亚太地区在全球二次大宗营养肥料市场中占据主导地位,到 2022 年将占 39.2% 的份额。在该地区,硫占大部分份额,为 63.5%,其次是镁,为 30.0%。水稻是亚太地区最主要的谷物作物,占全球产量和消费量的90%。该地区的土壤缺乏硫,因此需要透过施肥来补充重要的微量元素硫,以促进植物的生长和产量。
- 在 2022 年全球次生大分子营养肥料市场中,欧洲以 26.9% 的份额位居第二。硫磺是2022年最主要的次要营养元素肥料,占市占率的67.4%。俄罗斯成为欧洲市场的主导者,市场占有率19.2%。
- 2022年,南美洲的次要大分子营养元素肥料市场占全球市场的11.5%。最近的干旱和热浪阻碍了该地区土壤的养分供应,促使人们采用二次大量营养肥料来弥补这些缺陷。
- 次要营养素在维持植物营养平衡方面发挥着至关重要的作用,每种营养素都会影响特定的代谢过程。随着人们越来越认识到优化植物营养的重要性,这种动态可能会在未来几年推动市场成长。
中量营养素肥料的全球市场趋势
为满足日益增长的粮食需求,农业部门面临越来越大的压力,预计田间作物的种植面积将会增加。
- 当前全球农业领域面临许多挑战。根据联合国预测,到2050年世界人口将超过90亿。人口成长可能会给农业部门带来过度压力,而由于劳动力短缺和都市化进程加快导致的耕地减少,农业部门的产量已经下降。根据联合国粮食及农业组织预测,2050年,全球70%的人口预计将居住在城市。随着全球可耕地面积减少,农民需要使用更多的肥料来提高作物产量。
- 亚太地区是世界上最大的农产品生产地区。农业对该地区的经济至关重要,约占总劳动力的 20%。该地区以农田作物为主,占作物总面积的95%以上。水稻、小麦和玉米是该地区的主要田间作物,2022年约占总耕地面积的24.3%。
- 北美洲是世界上第二大可耕地。该农场种植多种作物,主要为田间作物。尤其是玉米、棉花、稻米、大豆和小麦,都是美国农业部强调的主要田间作物。 2022年,美国占北美作物种植面积的46.2%。然而,2017年至2019年期间,该国种植面积大幅下降,主要原因是恶劣天气导致德克萨斯和休士顿等地区发生严重洪灾。
硫在植物体内无法移动,需要从早期生长到收穫期间的稳定供应;供应不足会限制产量。
- 2022年全球田间作物中次生大量营养元素的平均施用率为33.73公斤/公顷。同年钙施用量约39.20公斤/公顷,镁施用量约34.51公斤/公顷,硫施用量为27.47公斤/公顷。钙有助于其他必需营养素的吸收。镁是促进植物生长和开花的优良酵素活化剂。植物对次要大量营养素的需求量很小,且不能被主要营养素取代。
- 2022 年平均硫施用量最高的是玉米,为 34.33 公斤/公顷,其次是棉花,为 29.72 公斤/公顷,油菜籽/油菜籽为 27.57 公斤/公顷。硫在植物内部无法移动,因此从生长初期直到收穫都需要稳定的供应。生长过程中任何阶段缺乏硫都会导致产量下降。随着 N、P 和 K 的需求几乎得到满足,其他营养物质的缺乏开始出现。硫是继氮、磷、钾之后的第四大重要营养元素,但通常只需要少量。
- 南美洲、中东和非洲以及亚太地区是次要大量营养素的主要消耗地区,平均施肥量最高,2022 年分别为 39.27 公斤/公顷、32.79 公斤/公顷和 32.74 公斤/公顷。种植者认识到次要大量营养素的重要性,因为它们是植物的重要营养素,可以支持更强的细胞壁,减少擦伤并预防田间作物的疾病。儘管次要大量营养素对产量的限制小于主要大量营养素,但作物仍需要次要大量营养素来优化生产力。
二次大量营养肥料产业概况
中次大营养元素肥料市场较为分散,前五大公司占比为10.61%。该市场的主要企业有:ICL Group Ltd、K+S Aktiengesellschaft、Koch Industries Inc.、The Mosaic Company 和 Yara International ASA(按字母顺序排列)
其他福利
- Excel 格式的市场预测 (ME) 表
- 3个月的分析师支持
目录
第一章执行摘要和主要发现
第二章 报告要约
第三章 引言
- 研究假设和市场定义
- 研究范围
- 调查方法
第四章 产业主要趋势
- 主要作物种植面积
- 田间作物
- 园艺作物
- 平均养分施用量
- 次要宏量营养素
- 田间作物
- 园艺作物
- 次要宏量营养素
- 灌溉农田
- 法律规范
- 价值炼和通路分析
第五章市场区隔
- 类型
- 直的
- 次要营养物质
- 钙
- 镁
- 硫
- 直的
- 应用模式
- 受精
- 叶面喷布
- 土壤
- 作物类型
- 田间作物
- 园艺作物
- 草坪和观赏植物
- 地区
- 亚太地区
- 澳洲
- 孟加拉
- 中国
- 印度
- 印尼
- 日本
- 巴基斯坦
- 菲律宾
- 泰国
- 越南
- 其他亚太地区
- 欧洲
- 法国
- 德国
- 义大利
- 荷兰
- 俄罗斯
- 西班牙
- 乌克兰
- 英国
- 其他欧洲国家
- 中东和非洲
- 奈及利亚
- 沙乌地阿拉伯
- 南非
- 土耳其
- 其他中东和非洲地区
- 北美洲
- 加拿大
- 墨西哥
- 美国
- 北美其他地区
- 南美洲
- 阿根廷
- 巴西
- 南美洲其他地区
- 亚太地区
第六章 竞争格局
- 关键策略趋势
- 市场占有率分析
- 商业状况
- 公司简介
- Coromandel International Ltd.
- Deepak fertilizers & Petrochemicals Corporation Ltd
- Grupa Azoty SA(Compo Expert)
- Haifa Group
- ICL Group Ltd
- K+S Aktiengesellschaft
- Koch Industries Inc.
- The Mosaic Company
- Yara International ASA
第七章:CEO面临的关键策略问题
第 8 章 附录
- 世界概况
- 概述
- 五力分析框架
- 全球价值链分析
- 市场动态(DRO)
- 资讯来源及延伸阅读
- 图片列表
- 关键见解
- 资料包
- 词彙表
The Secondary Macronutrients Fertilizer Market size is estimated at 37.81 billion USD in 2025, and is expected to reach 49.28 billion USD by 2030, growing at a CAGR of 5.44% during the forecast period (2025-2030).
The adoption of sulfur fertilizer is more than other secondary macronutrients
- In 2021, sulfur accounted for 42.6% of the global secondary macronutrient fertilizer market. In 2021, the value of the European sulfur market was about USD 1.19 billion. In this market, specialty sulfur fertilizer accounted for a market share of approximately 49.4%, and conventional sulfur fertilizer accounted for about 50.1%. The adoption of specialty sulfur fertilizer is higher than that of other secondary macronutrients. The specialty sulfur fertilizer market is anticipated to reach USD 1.82 billion by the end of the forecast period.
- Magnesium accounted for 48.9% of the global secondary macronutrient fertilizer market in 2021. Field crops accounted for a maximum share of 88.8%, followed by turf and ornamental crops and horticulture crops, holding shares of 3.9% and 7.3%, respectively. The largest fertilizer-consuming crops are wheat and corn, accounting for a total of 40.0% of the land area.
- Calcium recorded 8.4% of the total value of the global secondary macronutrient fertilizer market, accounting for about USD 538.7 million in 2021. The Asia-Pacific region dominated the calcium fertilizer market and accounted for about 41.1% of the global calcium fertilizer market's value, registering USD 221.6 million in 2021. The dominance of the Asia-Pacific region in the calcium fertilizer market is mainly due to the acidification of soils, which means the loss of base cations, such as calcium and magnesium, and replacement with acidic elements, like iron and aluminum complexes.
- The demand for secondary macronutrient fertilizer is anticipated to grow during the forecast period, as the need for higher productivity is increasing due to the decline in the area under the cultivation of crops.
Climate changes and fluctuation in pH levels in soils may drive the market
- Applying secondary macronutrient fertilizers impacts crop yields positively. The demand for calcium, magnesium, and sulfur has risen in tandem with modern high-yield crop systems, underscoring their pivotal role in plant productivity.
- Asia-Pacific dominates the global secondary macronutrient fertilizer market, capturing 39.2% of its value in 2022. Within the region, sulfur claims the majority share at 63.5%, trailed by magnesium at 30.0%. Rice is the major grown cereal crop in Asia-Pacific, with the region accounting for 90% of global production and consumption. Given the region's sulfur-deficient soils, sulfur, a crucial trace element, is supplemented through fertilization to enhance plant growth and yield.
- Europe secured the second-largest share of the global secondary macronutrient fertilizer market in 2022, with a share of 26.9%. Sulfur, commanding a hefty 67.4% of the market's value, emerged as the leading secondary macronutrient fertilizer in 2022. Russia, with a 19.2% market share, emerged as the dominant player in Europe's market landscape.
- In 2022, the South American secondary macronutrient fertilizer market held an 11.5% share of the global market. Recent droughts and heat waves disrupted nutrient availability in the region's soils, driving up the adoption of secondary macronutrient fertilizers to counteract these deficiencies.
- Secondary macronutrients play a pivotal role in maintaining balanced plant nutrition, with each nutrient influencing specific metabolic processes. This dynamic is poised to fuel the growth of the market in the coming years as the importance of optimized plant nutrition becomes increasingly recognized.
Global Secondary Macronutrients Fertilizer Market Trends
The rising pressure on the agriculture sector to meet the growing demand for food is expected to increase the area under field crop cultivation
- The global agricultural sector is currently facing many challenges. According to the United Nations, the world population may exceed 9 billion by 2050. This population growth may overburden the agricultural sector, which is already experiencing an output loss due to a lack of laborers and the shrinkage of agricultural fields caused by rising urbanization. According to the Food and Agriculture Organization, 70% of the global population is expected to live in cities by 2050. Due to the global loss of arable land, farmers now need to utilize more fertilizers to increase crop yields.
- Asia-Pacific is the world's largest producer of agricultural products. Agriculture is critical to the region's economy, as it employs about 20% of the total available workforce. Field crop cultivation dominates the region, accounting for more than 95% of the total crop area. Rice, wheat, and corn are the major field crops produced in the region, together accounting for about 24.3% of the total crop area in 2022.
- North America ranks as the second-largest arable region across the world. Its farms cultivate a diverse range of crops, with a focus on field crops. Notably, corn, cotton, rice, soybean, and wheat are the prominent field crops, as highlighted by the USDA. In 2022, the United States commanded 46.2% of North America's crop cultivation area. However, the country witnessed a significant drop in crop acreage between 2017 and 2019, primarily due to adverse environmental conditions, leading to severe flooding in regions like Texas and Houston.
A steady supply of sulfur is required from early growth stages until harvest as it is immobile in plants, and any shortage in supply can limit the yield
- The global average application rate of secondary macronutrients in field crops was 33.73 kg/ha in 2022. In the same year, the calcium application rate was about 39.20 kg/hectare, magnesium was about 34.51 kg/hectare, and sulfur application rate was 27.47 kg/hectare. Calcium aids in the absorption of other essential nutrients. Magnesium is an excellent enzyme activator that promotes plant growth and flowering. Plants require only a small amount of secondary macronutrients that cannot be replaced by any primary nutrients.
- In 2022, corn/maize recorded the highest average sulfur application rate of 34.33 kg/ha, followed by cotton at 29.72 kg/ha and rapeseed/canola at 27.57 kg/ha. A steady supply of sulfur is required from early growth stages until harvest as it is immobile in plants. At any stage of growth, a shortage of sulfur can lead to lower yields. As N, P, and K requirements have mostly been met, deficits of other nutrients have started to appear. Sulfur is the fourth most crucial nutrient after N, P, and K but is usually only needed in low quantities.
- South America, the Middle East & Africa, and Asia-Pacific were the major consumers of secondary macronutrients, with the highest average nutrient application rates, accounting for 39.27 kg/ha, 32.79 kg/ha, and 32.74 kg/ha, respectively, in 2022. Growers acknowledged the importance of secondary macronutrients because they are crucial nutrients for plants, support stronger cell walls, lower bruising, and prevent disease in field crops. Although secondary macronutrients are less yield-limiting than primary macronutrients, crops need them at a rate that will optimize productivity.
Secondary Macronutrients Fertilizer Industry Overview
The Secondary Macronutrients Fertilizer Market is fragmented, with the top five companies occupying 10.61%. The major players in this market are ICL Group Ltd, K+S Aktiengesellschaft, Koch Industries Inc., The Mosaic Company and Yara International ASA (sorted alphabetically).
Additional Benefits:
- The market estimate (ME) sheet in Excel format
- 3 months of analyst support
TABLE OF CONTENTS
1 EXECUTIVE SUMMARY & KEY FINDINGS
2 REPORT OFFERS
3 INTRODUCTION
- 3.1 Study Assumptions & Market Definition
- 3.2 Scope of the Study
- 3.3 Research Methodology
4 KEY INDUSTRY TRENDS
- 4.1 Acreage Of Major Crop Types
- 4.1.1 Field Crops
- 4.1.2 Horticultural Crops
- 4.2 Average Nutrient Application Rates
- 4.2.1 Secondary Macronutrients
- 4.2.1.1 Field Crops
- 4.2.1.2 Horticultural Crops
- 4.2.1 Secondary Macronutrients
- 4.3 Agricultural Land Equipped For Irrigation
- 4.4 Regulatory Framework
- 4.5 Value Chain & Distribution Channel Analysis
5 MARKET SEGMENTATION (includes market size in Value in USD and Volume, Forecasts up to 2030 and analysis of growth prospects)
- 5.1 Type
- 5.1.1 Straight
- 5.1.1.1 Secondary Macronutrients
- 5.1.1.1.1 Calcium
- 5.1.1.1.2 Magnesium
- 5.1.1.1.3 Sulfur
- 5.1.1 Straight
- 5.2 Application Mode
- 5.2.1 Fertigation
- 5.2.2 Foliar
- 5.2.3 Soil
- 5.3 Crop Type
- 5.3.1 Field Crops
- 5.3.2 Horticultural Crops
- 5.3.3 Turf & Ornamental
- 5.4 Region
- 5.4.1 Asia-Pacific
- 5.4.1.1 Australia
- 5.4.1.2 Bangladesh
- 5.4.1.3 China
- 5.4.1.4 India
- 5.4.1.5 Indonesia
- 5.4.1.6 Japan
- 5.4.1.7 Pakistan
- 5.4.1.8 Philippines
- 5.4.1.9 Thailand
- 5.4.1.10 Vietnam
- 5.4.1.11 Rest of Asia-Pacific
- 5.4.2 Europe
- 5.4.2.1 France
- 5.4.2.2 Germany
- 5.4.2.3 Italy
- 5.4.2.4 Netherlands
- 5.4.2.5 Russia
- 5.4.2.6 Spain
- 5.4.2.7 Ukraine
- 5.4.2.8 United Kingdom
- 5.4.2.9 Rest of Europe
- 5.4.3 Middle East & Africa
- 5.4.3.1 Nigeria
- 5.4.3.2 Saudi Arabia
- 5.4.3.3 South Africa
- 5.4.3.4 Turkey
- 5.4.3.5 Rest of Middle East & Africa
- 5.4.4 North America
- 5.4.4.1 Canada
- 5.4.4.2 Mexico
- 5.4.4.3 United States
- 5.4.4.4 Rest of North America
- 5.4.5 South America
- 5.4.5.1 Argentina
- 5.4.5.2 Brazil
- 5.4.5.3 Rest of South America
- 5.4.1 Asia-Pacific
6 COMPETITIVE LANDSCAPE
- 6.1 Key Strategic Moves
- 6.2 Market Share Analysis
- 6.3 Company Landscape
- 6.4 Company Profiles
- 6.4.1 Coromandel International Ltd.
- 6.4.2 Deepak fertilizers & Petrochemicals Corporation Ltd
- 6.4.3 Grupa Azoty S.A. (Compo Expert)
- 6.4.4 Haifa Group
- 6.4.5 ICL Group Ltd
- 6.4.6 K+S Aktiengesellschaft
- 6.4.7 Koch Industries Inc.
- 6.4.8 The Mosaic Company
- 6.4.9 Yara International ASA
7 KEY STRATEGIC QUESTIONS FOR FERTILIZER CEOS
8 APPENDIX
- 8.1 Global Overview
- 8.1.1 Overview
- 8.1.2 Porter's Five Forces Framework
- 8.1.3 Global Value Chain Analysis
- 8.1.4 Market Dynamics (DROs)
- 8.2 Sources & References
- 8.3 List of Tables & Figures
- 8.4 Primary Insights
- 8.5 Data Pack
- 8.6 Glossary of Terms
 2025年全球化肥料市场报告2025年全球生物炭肥料市场报告
 2025-2029年全球肥料市场
 中东和非洲肥料:市场占有率分析、行业趋势和统计数据、成长预测(2025-2030 年)中国化肥:市场占有率分析、产业趋势与统计、成长预测(2025-2030年)亚太化肥:市场占有率分析、产业趋势与成长预测(2025-2030 年)北美肥料:市场占有率分析、产业趋势与统计、成长预测(2025-2030)南美肥料:市场占有率分析、行业趋势和成长预测(2025-2030 年)印尼化肥:市场占有率分析、产业趋势与统计、成长预测(2025-2030 年)印度肥料:市场占有率分析、产业趋势与统计、成长预测(2025-2030)