


 |
市场调查报告书
商品编码
1683960
北美室内 LED 照明:市场占有率分析、行业趋势和统计、成长预测(2025-2030 年)North America Indoor LED Lighting - Market Share Analysis, Industry Trends & Statistics, Growth Forecasts (2025 - 2030) |
||||||
※ 本网页内容可能与最新版本有所差异。详细情况请与我们联繫。
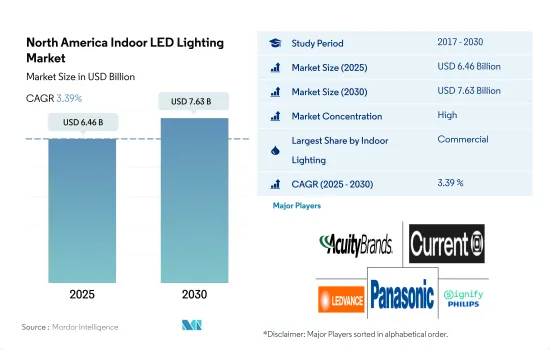
北美室内 LED 照明市场规模预计在 2025 年为 64.6 亿美元,预计到 2030 年将达到 76.3 亿美元,预测期内(2025-2030 年)的复合年增长率为 3.39%。
工业生产需求的不断增长、储存空间需求的不断增长以及办公空间可用性的不断增加正在推动市场需求。
- 从以金额为准来看,商业将在 2023 年占据大部分市场份额,其次是住宅、工业和仓储 (I&W) 和农业。 I&W 的市场占有率预计今年将会增加,而其余部分的市占率预计将略有下降。美国工业面临国内外多重阻力,包括国内消费低迷、半导体市场低迷、工厂关闭以及新冠疫情激增导致的供应链中断。此外,美国2021年工业产值维持不变。 2021年美国工业产值2,4971亿美元,较2020年成长11.55%。
- 2023 年 5 月,美国工业生产年增 0.2%,此前 2023 年 4 月该数据上修为成长 0.4%。采矿业成长 5%,公共产业下降 3.8%,製造业下降 0.3%。墨西哥的製造业产出总合2,307 亿美元,较 2020 年成长 21.44%。因此,该地区工业产量的成长预计将在未来几年增加对室内照明的需求。
- 从 2022 年中期开始,加拿大商业房地产产业将面临加剧的市场波动。金融、科技和生命科学产业正在推动办公室需求,租赁率与 2021 年相比有所上升。建筑、仓储和其他行业的就业人数增加。 2022年12月,加拿大增加了104,000个工作机会。 2022年第四季国内办公室空置率为16.5%,高于2022年第三季及2021年第四季。基于这些案例,预计在不久的将来对办公空间的需求将会增加,从而导致对室内照明产品的需求增加。
预计製造工厂、住宅和零售店数量的增加将推动室内照明的需求
- 从金额和数量来看,到 2023 年美国将占据最大份额,其次是北美。预计未来几年北美其他地区的市场占有率将会下降,而美国的市占率波动性将保持在较低水准。许多北美国家对电动车的需求激增,导致生产能力增加。 2022年3月,越南汽车製造商VinFast计划投资40亿美元在查塔姆县建立全电动SUV工厂。 2023年4月,福特宣布将投资13亿美元在加拿大建立新的製造地。製造设施的增加预计将推动市场对室内 LED 的需求。
- 2022 年,美国拥有最多以零售为重点的新兴企业(15.05%),包括实体店和电子商务营运。餐饮及其他食品相关企业占新兴企业的13.71%。新兴企业的崛起预计将进一步推动该地区对室内 LED 的需求。
- 2020 年至 2022 年,美国家庭数量从 1.2845 亿增加到 1.312 亿。此外,2023 年 5 月通过建筑许可批准的私人住宅数量为 1,491,000 套。这比 2023 年 4 月的 1,417,000 增加了 5.2%。 2023年5月私人住宅开工数为163.1万套。这比 2022 年 5 月的 1,543,000 高出 5.7%。因此,预计住宅和房主数量的增加将进一步增加该地区对室内 LED 的需求。
北美室内 LED 照明市场趋势
私人住宅数量增加和政府政策推动 LED 市场
- 在北美,美国和加拿大是收益和人口最多的城市。截至 2023 年 6 月,北美现有人口为 3.755 亿。到 2020 年,美国将以 3.31 亿人口占据该地区人口的最大份额,其次是加拿大,人口为 3,770 万人。 82.6% 的人口居住在都市区(2019 年为 3.047 亿)。该地区的人口成长率为0.6%。因此,预计人口的成长将导致LED使用量的增加和家庭照明需求的增加。
- 在加拿大和美国,人们的可支配收入更高,这反过来又赋予了人们更强的消费能力,使他们能够为新的生活空间分配更多的资金。 2023年3月加拿大的平均月薪为3,464美元,低于2023年2月的3,500美元。虽然平均月收入略有下降,但作为北美已开发国家,购买力相对于其他国家来说较高。
- 2023年5月,颁发建筑许可证数量为1,491,000份。这比 2023 年 4 月的 1,417,000 增加了 5.2%。 5月份私人住宅开工数为163.1万套。这比 2022 年 5 月售出的 1,543,000 台高出 5.7%,比 4 月修订后的 1,340,000 台高出 21.7%。
- 新法规将最高税收抵免额从《能源政策法》(EPAct)第 179D 条规定的 2022 年每平方英尺 1.88 美元提高到扣除额升级空间每平方英尺 5 美元(儘管最终将升至每平方英尺 2 美元)。目标计划包括室内照明、空调和建筑外部。预计这些案例将推动该地区对 LED 照明的需求激增。
升级和更换旧灯,并增加政府推广使用 LED 照明的倡议
- 住宅、商业和工业用途的电力各占总用电量的约三分之一。 2021 年 3 月,加拿大住宅平均销售价格与去年同期相比上涨了 31.6%。由于历史低利率和对空间的需求,疫情期间对较小地区独户房屋住宅的需求增加。然而,低房屋抵押贷款利率和快速的人口成长正在推动对住宅的高需求。 2021 年 3 月住宅建筑投资连续 11 个月增加,成长 7.6% 至 140 亿加元(109.9 亿美元)。由于建设活动的增加,该地区的 LED 市场正在扩大。
- 商业部门的电力需求往往在8至10小时左右。工业部门的用电量在一天和一年中往往更加稳定。住宅用电需求在7-9小时左右波动。随着美国各地建造越来越多的道路和高速公路,对照明的需求也日益增加。在美国,建造公共高速公路和街道的成本在 2017 年平均每月为 894 亿美元,到 2021 年将达到每月 999 亿美元。因此,各社区正在花费更多资金升级和更换老化的街道照明基础设施,并鼓励使用 LED。
- 加拿大政府已启动多项计划以减少照明能源消耗,例如加拿大能源之星 (ENERGY STAR Canada)。此外,2021年3月,加拿大拉瓦尔市核准了一项计划,将37,000盏灯升级为智慧控制LED灯具。改用 LED 照明预计每年可节省 275 万美元。这些努力将促进该地区LED的普及。
北美室内 LED 照明产业概况
北美室内LED照明市场格局比较集中,前五大厂商的市占率合计达到75.28%。该市场的主要企业是:ACUITY BRANDS, INC.、Current Lighting Solutions, LLC.、LEDVANCE GmbH (MLS)、松下控股公司和 Signify (飞利浦)(按字母顺序排列)。
其他福利
- Excel 格式的市场预测 (ME) 表
- 3 个月的分析师支持
目录
第 1 章执行摘要和主要发现
第二章 报告要约
第 3 章 简介
- 研究假设和市场定义
- 研究范围
- 调查方法
第四章 产业主要趋势
- 人口
- 人均收入
- LED进口总量
- 照明电力消耗量
- 家庭数量
- LED渗透率
- 园艺区
- 法律规范
- 美国
- 价值链与通路分析
第五章 市场区隔
- 室内照明
- 农业照明
- 商业照明
- 办公室
- 零售
- 其他的
- 工业/仓库
- 住宅
- 国家
- 美国
- 北美其他地区
第六章 竞争格局
- 主要策略趋势
- 市场占有率分析
- 业务状况
- 公司简介(包括全球概况、市场层级概况、主要业务部门、财务状况、员工人数、关键资讯、市场排名、市场占有率、产品和服务、最新发展分析)
- ACUITY BRANDS, INC.
- Cree LED(SMART Global Holdings, Inc.)
- Current Lighting Solutions, LLC.
- Dialight
- EGLO Leuchten GmbH
- Feit Electric Company, Inc.
- LEDVANCE GmbH(MLS Co Ltd)
- NVC INTERNATIONAL HOLDINGS LIMITED
- Panasonic Holdings Corporation
- Signify(Philips)
第七章:执行长的关键策略问题
第 8 章 附录
- 世界概况
- 概述
- 五力分析框架
- 全球价值链分析
- 市场动态(DRO)
- 资讯来源和进一步阅读
- 图片列表
- 关键见解
- 资料包
- 词彙表
The North America Indoor LED Lighting Market size is estimated at 6.46 billion USD in 2025, and is expected to reach 7.63 billion USD by 2030, growing at a CAGR of 3.39% during the forecast period (2025-2030).
Increasing demand for industrial production, rising need for storage space, and increasing availability of office space are driving the demand for the market
- In terms of value, in 2023, commercial accounted for the majority of the share, followed by residential, industrial and warehouse (I&W), and agricultural. The market share is expected to gain in I&W and a small reduction in the remaining divisions in years. The US industries faced several internal and external headwinds, such as weak domestic consumption, semiconductor crunch, plant closures, and supply chain disruptions caused by the surge of COVID-19. Further, the United States sustained its industrial production in 2021. In 2021, the United States produced a total of USD 2,497.1 billion, an increase of 11.55% compared to 2020.
- In the United States, industrial production grew by 0.2% Y-o-Y in May 2023, after an upwardly revised rise of 0.4% in April 2023. Mining went up by 5%, utilities dropped by 3.8%, and manufacturing fell by 0.3%. Mexico produced a total of USD 230.07 billion, an increase of manufacturing output of 21.44% compared to 2020. Thus, the growing industrial production in this region is expected to create more demand for Indoor lighting in the coming years.
- The Canadian commercial real estate sector has been facing increasing market volatility since the middle of 2022. The financial, technology, and life sciences sectors are the drivers of demand for office space, with leasing rates increasing compared to 2021. Employment gains were registered in the construction, warehouse, and other sectors. In December 2022, 104 thousand jobs were added in Canada. The availability of national offices in Q4 of 2022 and accounted for 16.5%, which was higher than in Q3 of 2022 and Q4 of 2021. These instances are expected to create more demand for office spaces in the near future, which will result in creating more need for indoor lighting products.
The growing number of manufacturing facilities, house owners, and retail facilities is expected to drive the demand for indoor lighting
- In terms of value and volume, in 2023, the United States accounted for the majority of the share, followed by the Rest of North America. The market share is expected to decline for the Rest of North America and gain for the United States with less fluctuation in the coming years. Demand for EVs surged across many countries in North America, resulting in increasing manufacturing facilities. In March 2022, VinFast, a Vietnamese automaker, planned to establish an all-electric SUV plant in Chatham County with an investment of USD 4 billion. In April 2023, Ford announced its new manufacturing hub in Canada, with an investment of USD 1.3 billion. The increase in manufacturing facilities is expected to create more demand for indoor LEDs in the market.
- In 2022, the largest number of startups in the United States focused on retail (15.05%), including brick-and-mortar stores and an e-commerce business. Restaurants and other food-related businesses account for 13.71% of the startups. The increasing number of startups is expected to create more need for indoor LEDs in the region.
- The number of households in the United States grew from 128.45 million to 131.2 million between 2020 and 2022. Further, the number of privately owned dwelling units authorized by building permits in May 2023 was 1,491,000. This is 5.2% more than the April 2023 rate, which was increased from 1,417,000. The number of privately owned homes started in May 2023 was 1,631,000. This is 5.7% above the May 2022 rate of 1,543,000. Thus, the growing number of households and house owners is expected to create more demand for indoor LEDs in the region.
North America Indoor LED Lighting Market Trends
Increase in private-owned dwellings and government policy to drive the market for LED
- In North America, the US and Canada are the main cities in terms of revenue and population. The current population of Northern America is 375.5 million as of June 2023. The United States occupies a major share of the people in this region, accounting for 331 million, followed by Canada at 37.7 million by 2020. 82.6 % of the population lives in urban areas (304.7 million people in 2019). The population in this region is growing with a 0.6% change. Thus, the increase in population is expected to create more LED penetration and increase the need for illumination in the country.
- In Canada and the US, disposable income is high, resulting in rising spending power of individuals and affording more money on new residential spaces. Canada's monthly earnings stood at USD 3,464 in Mar 2023, reduced from USD 3,500 in Feb 2023. Even though it is showing a slight decline in average monthly earnings, it has a high purchasing value compared to other nations, as it is a developed country in North America.
- The number of privately owned dwelling units authorized by building permits in May 2023 was 1,491,000. This is 5.2% more than the April 2023 rate, which was increased from 1,417,000. The number of privately owned homes started in May was 1,631,000. This is 5.7% above the May 2022 rate of 1,543,000 and is 21.7% higher than the revised April estimate of 1,340,000.
- As per the Energy Policy Act (EPAct) section 179D, the maximum tax deduction jumped to USD 5 per sq. ft. of upgraded space in 2023 under the new regulations, which has USD 1.88 per sq. ft. deductions in 2022 (but is set to rise to USD 2.00 per sq. ft.). Eligible projects include interior lighting, HVAC, and building envelopes. Such instances are expected to surge the demand for LED lighting in the region.
Upgradation and replacement of old lamps, increasing government initiatives to promote the use of LED lights
- Each customer type-residential, commercial, and industrial-uses around one-third of the total amount of electricity. The average selling price of a home in Canada climbed by 31.6% Y-o-Y in March 2021. Demand for detached homes in smaller areas increased during the pandemic due to historically low lending rates and a need for more space. However, low mortgage rates and rapid population increase drive a high demand for new homes. Residential building investment increased for 11 consecutive months in March 2021, up 7.6% to CAD 14.0 billion (USD 10.99 billion). The region's LED market is expanding due to the rise in construction activities.
- Electricity demand in the commercial sector tends to be around 8-10 hours. Electricity use in the industrial sector tends not to fluctuate through the day or year. Electricity demand in the residential sector varies for about 7 to 9 hours. The demand for illumination is also rising as there are more roads and highways across the US. In the US, public highway and street building cost an average of USD 89.4 billion per month on average in 2017 and USD 99.9 billion per month on average in 2021. As a result, communities are spending more money to upgrade or replace their old street lighting infrastructure, encouraging the use of LEDs.
- The Canadian government has launched several programs to cut down on the amount of energy used for lighting, including ENERGY STAR in Canada. Furthermore, in March 2021, the Canadian city of Laval approved a plan to upgrade 37,000 lamps to LED luminaires with smart controls. The switch to LED lighting is anticipated to save USD 2.75 million annually. The adoption of LEDs in the area is facilitated by these efforts.
North America Indoor LED Lighting Industry Overview
The North America Indoor LED Lighting Market is fairly consolidated, with the top five companies occupying 75.28%. The major players in this market are ACUITY BRANDS, INC., Current Lighting Solutions, LLC., LEDVANCE GmbH (MLS Co Ltd), Panasonic Holdings Corporation and Signify (Philips) (sorted alphabetically).
Additional Benefits:
- The market estimate (ME) sheet in Excel format
- 3 months of analyst support
TABLE OF CONTENTS
1 EXECUTIVE SUMMARY & KEY FINDINGS
2 REPORT OFFERS
3 INTRODUCTION
- 3.1 Study Assumptions & Market Definition
- 3.2 Scope of the Study
- 3.3 Research Methodology
4 KEY INDUSTRY TRENDS
- 4.1 Population
- 4.2 Per Capita Income
- 4.3 Total Import Of Leds
- 4.4 Lighting Electricity Consumption
- 4.5 # Of Households
- 4.6 Led Penetration
- 4.7 Horticulture Area
- 4.8 Regulatory Framework
- 4.8.1 United States
- 4.9 Value Chain & Distribution Channel Analysis
5 MARKET SEGMENTATION (includes market size in Value in USD and Volume, Forecasts up to 2030 and analysis of growth prospects)
- 5.1 Indoor Lighting
- 5.1.1 Agricultural Lighting
- 5.1.2 Commercial
- 5.1.2.1 Office
- 5.1.2.2 Retail
- 5.1.2.3 Others
- 5.1.3 Industrial and Warehouse
- 5.1.4 Residential
- 5.2 Country
- 5.2.1 United States
- 5.2.2 Rest of North America
6 COMPETITIVE LANDSCAPE
- 6.1 Key Strategic Moves
- 6.2 Market Share Analysis
- 6.3 Company Landscape
- 6.4 Company Profiles (includes Global level Overview, Market level overview, Core Business Segments, Financials, Headcount, Key Information, Market Rank, Market Share, Products and Services, and analysis of Recent Developments)
- 6.4.1 ACUITY BRANDS, INC.
- 6.4.2 Cree LED (SMART Global Holdings, Inc.)
- 6.4.3 Current Lighting Solutions, LLC.
- 6.4.4 Dialight
- 6.4.5 EGLO Leuchten GmbH
- 6.4.6 Feit Electric Company, Inc.
- 6.4.7 LEDVANCE GmbH (MLS Co Ltd)
- 6.4.8 NVC INTERNATIONAL HOLDINGS LIMITED
- 6.4.9 Panasonic Holdings Corporation
- 6.4.10 Signify (Philips)
7 KEY STRATEGIC QUESTIONS FOR LED CEOS
8 APPENDIX
- 8.1 Global Overview
- 8.1.1 Overview
- 8.1.2 Porter's Five Forces Framework
- 8.1.3 Global Value Chain Analysis
- 8.1.4 Market Dynamics (DROs)
- 8.2 Sources & References
- 8.3 List of Tables & Figures
- 8.4 Primary Insights
- 8.5 Data Pack
- 8.6 Glossary of Terms
 可调光LED轨道灯具市场按类型、光源、安装方式、功率、应用和最终用户划分-全球预测,2026-2032年
 中东和非洲室内 LED 照明:市场占有率分析、行业趋势和统计、成长预测(2025-2030 年)中国室内 LED 照明:市场占有率分析、产业趋势与统计、成长预测(2025-2030 年)亚太室内 LED 照明:市场占有率分析、产业趋势与统计、成长预测(2025-2030 年)南美室内 LED 照明:市场占有率分析、行业趋势和统计、成长预测(2025-2030 年)印度室内 LED 照明:市场占有率分析、行业趋势和统计、成长预测(2025-2030 年)室内 LED 照明:市场占有率分析、行业趋势和统计、成长预测(2025-2030 年)德国室内 LED 照明:市场占有率分析、行业趋势和统计、成长预测(2025-2030 年)日本室内 LED 照明:市场占有率分析、行业趋势和统计、成长预测(2025-2030 年)欧洲室内 LED 照明:市场占有率分析、行业趋势和统计、成长预测(2025-2030 年)