


 |
市场调查报告书
商品编码
1693500
美国微量营养素肥料:市场占有率分析、行业趋势和统计数据、成长预测(2025-2030 年)United States Micronutrient Fertilizer - Market Share Analysis, Industry Trends & Statistics, Growth Forecasts (2025 - 2030) |
||||||
※ 本网页内容可能与最新版本有所差异。详细情况请与我们联繫。
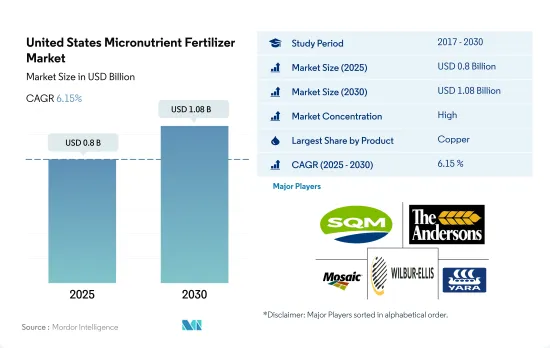
美国微量营养素肥料市场规模预计在 2025 年为 8 亿美元,预计到 2030 年将达到 10.8 亿美元,预测期内(2025-2030 年)的复合年增长率为 6.15%。
土壤缺水现象加剧和均衡营养需求预计将推动市场成长
- 农民对土壤养分缺乏及其对作物健康和产量的影响的认识正在推动美国对微量营养素的需求增加。
- 预计锌将成为微量营养素肥料市场的主导者,到 2022 年将占总市场价值的约 27.3%。预计 2023 年至 2030 年的复合年增长率为 5.2%。尤其是锌缺乏症,在华盛顿的果园、玉米和小麦中普遍存在,导致生长发育不良和叶部疾病。因此,越来越多的种植者开始使用锌肥。
- 对于大多数农作物来说,各种环境和土壤因素限制了植物的铁供应。这种短缺推动了铁肥市场的成长,预计 2023 年至 2030 年期间的复合年增长率为 3.9%。
- 铜对于植物酵素活性、叶绿素合成和种子生产至关重要。小麦、大麦、燕麦和蔬菜等田间作物特别容易受到铜缺乏的影响。由于田间作物在美国农业中占主导地位,预计2023年至2030年期间该领域铜肥的市场价值将以3.7%的复合年增长率增长。
- 微量营养素在植物的许多代谢活动中发挥重要作用,例如细胞壁的形成、花粉的形成、发芽、叶绿素的产生、氮固定以及蛋白质基本部分的合成。微量营养素肥料的需要量很少,但对于平衡作物营养很重要。因此,微量营养素肥料的市场价值预计在 2023 年至 2030 年期间实现 4.0% 的复合年增长率。
美国微量营养素肥料市场趋势
大豆和玉米是美国种植面积最大的两种作物。
- 在美国,人口从2020年的3.359亿增加到2022年的3.382亿。自2000年以来,耕地总面积减少了近5,000万英亩,到2022年达到8.934亿英亩。有限的农业用地表明需要透过使用农业投入来提高农业生产力。人们长期以来一直使用肥料来提高作物的产量。美国四大作物为玉米、棉花、大豆和小麦,2022年这四大作物将占主要作物面积的65.7%以上。
- 大豆和玉米是美国种植面积最大的两种作物。 2022年大豆种植面积最大,占美国耕地面积的25.8%,其次是玉米,占25.7%,小麦占11.1%。这些作物大部分生长在被称为「玉米带」的地区,该地区涵盖印第安纳州西部、伊利诺伊州、爱荷华州、密苏里州、内布拉斯加州东部和堪萨斯州东部。该地区主要产玉米和大豆。根据美国农业部的数据,美国是主要的米出口国,其主要种植区有四个地区:
- 农业投入品製造商正在进行创新,以帮助农民精准施肥。这不仅降低了种植成本,而且提高了效率。美国农田作物领域具有巨大的市场潜力。加上政府不断增加的资金和支持,预计将实现强劲成长。
微量营养素对于作物抵抗生物和生物胁迫至关重要。
- 微量营养素是植物生长所必需的,在作物营养中发挥重要作用。微量营养素肥料含有植物所需的微量元素,例如硼、铜、锰、锌和钴。作物对微量营养素的需求因美国不同地区的土壤条件而异。硼缺乏在东南部的沙质土壤中很常见,因为这种土壤有机质含量低,容易浸出。
- 在美国,田间作物微量营养素的平均施用量为每公顷4.2公斤。 2022 年锰的施用量为每公顷 11.0 公斤,对于提高大豆、小麦、甘蔗和玉米等主要田间作物的产量至关重要。因此,锰将主导微量营养素肥料市场,占2022年总消费量的33.0%。紧随锰之后,铜和锌的施用率分别为每公顷7.2公斤和6.7公斤。这些微量营养素对于作物抵抗生物和生物胁迫至关重要,凸显了透过人工手段解决其缺陷的重要性。
- 2022 年,田间作物领域占据主要份额,占整个微量营养素肥料市场价值的 87.6%,数量占 87.5%。作物,大豆施用量最高,为每公顷4.5公斤。预计向永续农业实践的转变以及维持土壤中微量营养素水平以促进作物正常生长的需求将推动 2023-2030 年美国微量营养素肥料市场的成长。
美国微量营养素肥料产业概况
美国微量营养素肥料市场相当集中,前五大公司占84.13%的市占率。该市场的主要企业有:Sociedad Quimica y Minera de Chile SA、The Andersons Inc.、The Mosaic Company、Wilbur-Ellis Company LLC 和 Yara International ASA(按字母顺序排列)
其他福利
- Excel 格式的市场预测 (ME) 表
- 3个月的分析师支持
目录
第一章执行摘要和主要发现
第二章 报告要约
第三章 引言
- 研究假设和市场定义
- 研究范围
- 调查方法
第四章 产业主要趋势
- 主要作物种植面积
- 田间作物
- 园艺作物
- 平均养分施用量
- 微量营养素
- 田间作物
- 园艺作物
- 微量营养素
- 灌溉农田
- 法律规范
- 价值炼和通路分析
第五章市场区隔
- 产品
- 硼
- 铜
- 铁
- 锰
- 钼
- 锌
- 其他的
- 施肥方式
- 受精
- 叶面喷布
- 土壤
- 作物类型
- 田间作物
- 园艺作物
- 草坪和观赏植物
第六章 竞争格局
- 关键策略趋势
- 市场占有率分析
- 商业状况
- 公司简介
- Haifa Group
- Koch Industries Inc.
- Nouryon
- Sociedad Quimica y Minera de Chile SA
- The Andersons Inc.
- The Mosaic Company
- Wilbur-Ellis Company LLC
- Yara International ASA
第七章:CEO面临的关键策略问题
第 8 章 附录
- 世界概况
- 概述
- 五力分析框架
- 全球价值链分析
- 市场动态(DRO)
- 资讯来源及延伸阅读
- 图片列表
- 关键见解
- 资料包
- 词彙表
The United States Micronutrient Fertilizer Market size is estimated at 0.8 billion USD in 2025, and is expected to reach 1.08 billion USD by 2030, growing at a CAGR of 6.15% during the forecast period (2025-2030).
The growing soil deficiency and the need for balanced nutrition is anticipated to drive the growth of the market
- The awareness among farmers regarding soil nutrient deficiencies and their impact on crop health and yields is driving the rising demand for micronutrients in the United States.
- Zinc emerged as the dominant player in the micronutrient fertilizer market, accounting for approximately 27.3% of the total market value in 2022. It is projected to witness a CAGR of 5.2% from 2023 to 2030. Notably, zinc deficiency is prevalent in Washington orchards, maize, and wheat, leading to stunted growth and leaf disorders. Consequently, growers are increasingly turning to zinc fertilizers.
- In most agricultural crops, various environmental and soil factors limit the availability of iron to plants. This scarcity is expected to fuel the growth of the iron fertilizers market, which is projected to register a CAGR of 3.9% from 2023 to 2030.
- Copper is vital for enzymatic activities, chlorophyll synthesis, and seed production in plants. Field crops like wheat, barley, oats, and vegetables are particularly susceptible to copper deficiency. Given that field crops dominate the agricultural landscape in the United States, the market value of copper fertilizers in this segment is anticipated to register a CAGR of 3.7% during 2023-2030.
- Micronutrients play an important role in many plant metabolic activities, such as cell wall formation, pollen formation, germination, chlorophyll production, nitrogen fixation, and synthesis of essential parts of proteins. Even though micronutrient fertilizers are required in less quantity, they are important for balanced crop nutrition. Hence, the micronutrient fertilizer market's value is anticipated to register a CAGR of 4.0% during 2023-2030.
United States Micronutrient Fertilizer Market Trends
Soybean and corn are the two largest crops grown in the United States
- In the United States, the population increased from 335.9 million in 2020 to 338.2 million in 2022. From 2000 onward, the total farmland area has decreased by almost 50 million acres, reaching a total of 893.4 million acres, as of 2022. The limited farmland indicates the need to increase agricultural productivity with the use of agri inputs. Fertilizers have been used for a long time to increase the productivity of crops. The four major crops in the United States are corn, cotton, soybean, and wheat, which accounted for more than 65.7% of the principal crop acreage in 2022.
- Soybean and corn are the two largest crops grown in the United States. In 2022, soybean had the highest area under cultivation, accounting for 25.8% of the total arable land in the United States, followed by corn at 25.7% and wheat at 11.1%. The majority of these crops are grown in a region known as the "Corn Belt," which covers western Indiana, Illinois, Iowa, Missouri, eastern Nebraska, and Eastern Kansas. The production of corn (maize) and soybeans dominates this area. Additionally, the United States is a major exporter of rice, with most of the cultivation happening in four regions, three of which are in the South and one in California, according to the USDA.
- Manufacturers of farm inputs are innovating to aid farmers in precise fertilizer application. This not only trims cultivation costs but also bolsters efficiency. The field crop sector in the United States holds substantial market potential. Coupled with increased government funding and support, it is poised for positive growth.
Micronutrients are pivotal in equipping crops to combat both biotic and abiotic stresses
- Micronutrients are necessary for plant growth and play a critical role in crop nutrition. Micronutrient fertilizers contain trace amounts of elements such as boron, copper, manganese, zinc, and cobalt, which plants require in small amounts. Micronutrient requirements by the crop vary depending on the soil condition across the United States. Boron deficiency is more common in sandy soils of the southeast, which are low in organic matter content and more susceptible to leaching.
- In the United States, the average application rate for micronutrients in field crops stands at 4.2 kg per hectare. Manganese, with an application rate of 11.0 kg per hectare in 2022, is crucial for boosting the productivity of key field crops such as soybean, wheat, sugarcane, and maize. As a result, manganese dominates the micronutrient fertilizer market, accounting for 33.0% of the total consumption in 2022. Following manganese, copper and zinc have application rates of 7.2 and 6.7 kg per hectare, respectively. These micronutrients are pivotal in equipping crops to combat both biotic and abiotic stresses, underscoring the importance of addressing their deficiencies through artificial means.
- In 2022, the field crops segment held the lion's share, contributing 87.6% in value and 87.5% in volume to the overall micronutrient fertilizer market. Among these crops, soybean led the pack with an application rate of 4.5 kg per hectare. The shifting focus toward sustainable methods of farming and the need to maintain micronutrient levels in the soil for the proper growth of crops are expected to drive the US micronutrient fertilizers market's growth during 2023-2030.
United States Micronutrient Fertilizer Industry Overview
The United States Micronutrient Fertilizer Market is fairly consolidated, with the top five companies occupying 84.13%. The major players in this market are Sociedad Quimica y Minera de Chile SA, The Andersons Inc., The Mosaic Company, Wilbur-Ellis Company LLC and Yara International ASA (sorted alphabetically).
Additional Benefits:
- The market estimate (ME) sheet in Excel format
- 3 months of analyst support
TABLE OF CONTENTS
1 EXECUTIVE SUMMARY & KEY FINDINGS
2 REPORT OFFERS
3 INTRODUCTION
- 3.1 Study Assumptions & Market Definition
- 3.2 Scope of the Study
- 3.3 Research Methodology
4 KEY INDUSTRY TRENDS
- 4.1 Acreage Of Major Crop Types
- 4.1.1 Field Crops
- 4.1.2 Horticultural Crops
- 4.2 Average Nutrient Application Rates
- 4.2.1 Micronutrients
- 4.2.1.1 Field Crops
- 4.2.1.2 Horticultural Crops
- 4.2.1 Micronutrients
- 4.3 Agricultural Land Equipped For Irrigation
- 4.4 Regulatory Framework
- 4.5 Value Chain & Distribution Channel Analysis
5 MARKET SEGMENTATION (includes market size in Value in USD and Volume, Forecasts up to 2030 and analysis of growth prospects)
- 5.1 Product
- 5.1.1 Boron
- 5.1.2 Copper
- 5.1.3 Iron
- 5.1.4 Manganese
- 5.1.5 Molybdenum
- 5.1.6 Zinc
- 5.1.7 Others
- 5.2 Application Mode
- 5.2.1 Fertigation
- 5.2.2 Foliar
- 5.2.3 Soil
- 5.3 Crop Type
- 5.3.1 Field Crops
- 5.3.2 Horticultural Crops
- 5.3.3 Turf & Ornamental
6 COMPETITIVE LANDSCAPE
- 6.1 Key Strategic Moves
- 6.2 Market Share Analysis
- 6.3 Company Landscape
- 6.4 Company Profiles
- 6.4.1 Haifa Group
- 6.4.2 Koch Industries Inc.
- 6.4.3 Nouryon
- 6.4.4 Sociedad Quimica y Minera de Chile SA
- 6.4.5 The Andersons Inc.
- 6.4.6 The Mosaic Company
- 6.4.7 Wilbur-Ellis Company LLC
- 6.4.8 Yara International ASA
7 KEY STRATEGIC QUESTIONS FOR FERTILIZER CEOS
8 APPENDIX
- 8.1 Global Overview
- 8.1.1 Overview
- 8.1.2 Porter's Five Forces Framework
- 8.1.3 Global Value Chain Analysis
- 8.1.4 Market Dynamics (DROs)
- 8.2 Sources & References
- 8.3 List of Tables & Figures
- 8.4 Primary Insights
- 8.5 Data Pack
- 8.6 Glossary of Terms
 2026年全球微量元素肥料市场报告
 微量元素肥料市场报告:趋势、预测与竞争分析(至2031年)
 中东和非洲微量营养素肥料:市场占有率分析、行业趋势、统计数据、成长预测(2025-2030 年)中国微量营养素肥料市场占有率分析、产业趋势与统计、成长预测(2025-2030年)亚太地区微量营养素肥料:市场占有率分析、产业趋势和成长预测(2025-2030 年)北美微量营养素肥料:市场占有率分析、行业趋势和成长预测(2025-2030 年)南美微量营养素肥料:市场占有率分析、行业趋势和成长预测(2025-2030 年)印度微量营养素肥料:市场占有率分析、行业趋势和统计数据、成长预测(2025-2030 年)微量营养素肥料:市场占有率分析、产业趋势与统计、成长预测(2025-2030 年)欧洲微量营养素肥料市场占有率分析、产业趋势与成长预测(2025-2030年)