


 |
市场调查报告书
商品编码
1693528
北美微量营养素肥料:市场占有率分析、行业趋势和成长预测(2025-2030 年)North America Micronutrient Fertilizer - Market Share Analysis, Industry Trends & Statistics, Growth Forecasts (2025 - 2030) |
||||||
※ 本网页内容可能与最新版本有所差异。详细情况请与我们联繫。
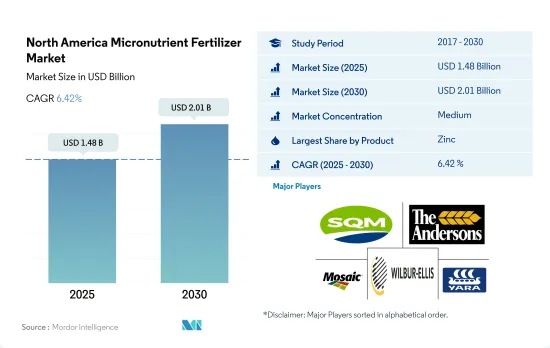
北美微量营养素肥料市场规模预计在 2025 年为 14.8 亿美元,预计到 2030 年将达到 20.1 亿美元,预测期内(2025-2030 年)的复合年增长率为 6.42%。
预计扩大种植和提高品质和产量对微量营养素的需求将推动对微量营养素的需求。
- 微量营养素对于植物的生长至关重要。它对平衡作物营养起着重要作用。任何微量营养素的缺乏都会限制植物的生长。微量营养素肥料含有硼、铜、锰、锌和钴等元素。植物需要少量这些物质。
- 按作物类型划分,2022年田间作物价值最高,为12.6亿美元,消费量为39.92万吨。同期,田间作物约占北美农地面积的88.7%。
- 传统微量营养素肥料占市场占有率的79.0%,2022年价值11.2亿美元。预计到2030年将达到15.7亿美元。特种肥料将占市场份额的21.0%,2022年价值2.987亿美元。预计到2030年底将达到4.351亿美元。
- 2022 年,锌将占北美微量营养素肥料市场的 27.0%,成为价值最大的微量营养素。锌是植物酵素系统的关键组成部分。锌有助于激活各种酵素并促进碳水化合物代谢。锌缺乏在华盛顿州的果园、玉米和小麦中特别常见,主要导致植物发育不良和小叶失调。
- 2022 年,铜将占北美微量营养素肥料市场的 17.3%。加拿大西部普遍存在铜缺乏现象,限制了作物生长并降低了产量潜力。预计 2023 年至 2030 年间铜肥市场将以 5.3% 的复合年增长率成长。
提高土壤肥力和营养缺乏的需求将推动市场成长
- 美国拥有近9880万公顷农田,是北美最大的农业生产国。 2022 年,美国占据北美微量营养素肥料市场的大部分份额,为 56.9%。
- 2022年,美国作物种植面积达1.397亿公顷,与前一年同期比较增加1%。耕地面积的扩大与土壤养分缺乏的增加导致对微量营养素肥料的依赖增加相吻合。
- 加拿大是北美第二大农业用地国,拥有约3,090万公顷农业用地。 2022 年,加拿大在该地区微量营养素肥料市场占有 14.2% 的份额。加拿大超过 88.0% 的农业用地用于种植作物,主要集中在草原地区、魁北克省和安大略省南部。
- 2022 年,墨西哥成为微量营养素肥料市场的重要参与企业,市占率为 26.6%,产量份额为 26.4%。田间作物在墨西哥微量营养素肥料市场中占据主导地位,占总量的88.3%。其次是园艺作物,占 7.0%,草皮和观赏作物占剩余的 4.7%。墨西哥主要的田间作物包括玉米、甘蔗和小麦。
- 2022年,北美其他地区将占微量营养素肥料市场总量的2.4%。多明尼加共和国、萨尔瓦多和尼加拉瓜等该领域的国家依赖进口肥料,并且严重依赖进口农产品。
- 北美微量营养素肥料市场一直保持稳定成长态势,预计未来将持续扩大。推动这一增长的是人们日益认识到微量营养素在确保作物强劲生长方面发挥着至关重要的作用。
北美微量营养素肥料市场趋势
补贴和其他政府支持有助于扩大田间作物
- 北美的农场种植多种作物,主要是田间作物。玉米、棉花、水稻、大豆和小麦是该地区的主要田间作物。美国、加拿大和墨西哥对该地区的农业生产贡献巨大。 2022年,田间作物将占北美总种植面积的约97.6%,其中谷物和油籽占据市场主导地位。
- 从国家来看,美国占市场主导地位,作物总种植面积达 1.357 亿公顷。其中,农田作物和园艺占种植面积的大部分,2022年分别占97.2%和2.8%。然而,2018年至2019年间,该国作物种植面积大幅下降,主要原因是德克萨斯州和休士顿等地发生严重洪涝灾害,环境条件不利。
- 最大的栽培作物是玉米,大部分种植在被称为「玉米带」的地区。玉米带是美国中西部的传统地区,涵盖印第安纳州西部、伊利诺州、爱荷华州、密苏里州、内布拉斯加州东部和堪萨斯州东部的大部分地区,主要作物玉米和大豆。美国也是米的主要出口国。该地区的水稻种植主要集中在四个地区,其中三个在南部,一个在加州。因此,该地区田间作物市场潜力的不断增加,加上政府资金投入和保护力度的加大,预计将积极推动该地区田间作物面积的扩大。
微量营养素缺乏和作物损失增加导致微量营养素施用率增加
- 2022年,锰、铜、锌、铁、硼施用量最高,分别为10.6公斤/公顷、6.9公斤/公顷、6.8公斤/公顷、3.3公斤/公顷、1.5公斤/公顷。大多数微量营养素在作物中的吸收率较低,但其可用性会严重限制植物的重要功能,导致植物异常、生长不良和产量下降。产量、商品价格和投入成本的上升使得农民开始仔细检视粮食生产的潜在障碍,包括微量营养素缺乏。
- 微量元素肥料消费量以小麦、高粱、大豆和棉花为主,玉米和水稻等其他田间作物比例较少。小麦尤其面临严重的铜和锰缺乏问题,铁和锌缺乏也会轻微影响产量。
- 每种作物的微量营养素需求受到当地土壤条件的影响。在美国,东南部的砂质土壤有机质含量低,容易淋溶,通常缺乏硼,与东北部肥沃的黑土不同。同样,加拿大亚伯达省中部的一些田地缺乏种植粮食所必需的铜。
- 墨西哥所有农业土壤都缺锌。然而,这种情况在克雷塔罗州、索诺拉州和锡那罗亚州更为普遍,显示对锌微量营养素肥料的需求增加。北美土壤天然缺乏微量营养素,因此在种植过程中经常需要消耗微量营养素补充剂。
北美微量营养素肥料产业概况
北美微量营养素肥料市场适度整合,前五大公司占63.51%。该市场的主要企业包括 Sociedad Quimica y Minera de Chile SA、The Andersons Inc.、The Mosaic Company、Wilbur-Ellis Company LLC、Yara International ASA 等。
其他福利
- Excel 格式的市场预测 (ME) 表
- 3个月的分析师支持
目录
第一章执行摘要和主要发现
第二章 报告要约
第三章 引言
- 研究假设和市场定义
- 研究范围
- 调查方法
第四章 产业主要趋势
- 主要作物种植面积
- 田间作物
- 园艺作物
- 平均养分施用量
- 微量营养素
- 田间作物
- 园艺作物
- 微量营养素
- 灌溉农田
- 法律规范
- 价值炼和通路分析
第五章市场区隔
- 产品
- 硼
- 铜
- 铁
- 锰
- 钼
- 锌
- 其他的
- 如何申请
- 受精
- 叶面喷布
- 土壤
- 作物类型
- 田间作物
- 园艺作物
- 草坪和观赏植物
- 原产地
- 加拿大
- 墨西哥
- 美国
- 北美其他地区
第六章竞争格局
- 关键策略趋势
- 市场占有率分析
- 商业状况
- 公司简介
- Haifa Group
- Koch Industries Inc.
- Nouryon
- Sociedad Quimica y Minera de Chile SA
- The Andersons Inc.
- The Mosaic Company
- Wilbur-Ellis Company LLC
- Yara International ASA
第七章:CEO面临的关键策略问题
第 8 章 附录
- 世界概况
- 概述
- 五力分析框架
- 全球价值链分析
- 市场动态(DRO)
- 资讯来源及延伸阅读
- 图片列表
- 关键见解
- 数据包
- 词彙表
The North America Micronutrient Fertilizer Market size is estimated at 1.48 billion USD in 2025, and is expected to reach 2.01 billion USD by 2030, growing at a CAGR of 6.42% during the forecast period (2025-2030).
Expansion of cultivation and the need for micronutrients to enhance quality and yield are anticipated to drive the demand for micronutrients
- Micronutrients are essential for plant growth. They play an important role in balanced crop nutrition. The lack of any of the micronutrients may limit plant growth. Micronutrient fertilizers contain elements like boron, copper, manganese, zinc, and cobalt. Plants require these substances in small quantities.
- By crop type, field crops recorded the highest value of USD 1.26 billion and a consumption volume of 399.2 thousand metric tons in 2022. Field crops accounted for about 88.7% of agricultural land in North America during the same period.
- The conventional micronutrient fertilizers segment accounted for 79.0% of the market share and was valued at USD 1.12 billion in 2022. It is anticipated to reach USD 1.57 billion by 2030. The specialty fertilizers segment accounted for 21.0% and was valued at USD 298.7 million in 2022. It is expected to reach USD 435.1 million by the end of 2030.
- In 2022, zinc accounted for 27.0% of the total micronutrient fertilizer market in North America and is the largest valued micronutrient. Zinc is a major component of plant enzyme systems. Zinc aids in the activation of various types of enzymes, boosting carbohydrate metabolism. Zinc deficiency is particularly common in Washington orchards, maize, and wheat, and it primarily causes stunted growth and little leaf disorder.
- Copper accounted for 17.3% of the North American micronutrient fertilizers market in 2022. Copper deficiency is becoming more widespread across Western Canada, limiting the growth of the crop and reducing yield potential because the natural stores of copper have been depleted by plants that take up copper in higher amounts. The copper fertilizer market is anticipated to witness a CAGR of 5.3% during 2023-2030.
The need to improve soil fertility and nutrient deficiency will fuel the growth of the market
- With nearly 98.8 million hectares of agricultural land, the United States dominates as North America's top agriculture producer. In 2022, the US commanded a significant 56.9% share of the North American market for micronutrient fertilizers.
- In 2022, crop cultivation in the US covered 139.7 million hectares, a 1% increase from the previous year. This expansion in cultivated areas has coincided with a growing reliance on micronutrient fertilizers, driven by escalating soil nutrient deficiencies.
- Canada, the second-largest agricultural landowner in North America, boasted around 30.9 million hectares. In 2022, Canada held a 14.2% share of the region's micronutrient fertilizer market. Over 88.0% of Canada's agricultural land is dedicated to crops, with notable concentrations in the Prairies, Quebec, and Southern Ontario.
- In 2022, Mexico emerged as a significant player in the micronutrient fertilizer market, capturing a 26.6% share in market value and 26.4% in volume. Field crops dominated Mexico's micronutrient fertilizer market, accounting for 88.3% of the total volume. Horticulture crops followed at 7.0%, with turf & ornamental crops making up the remaining 4.7%. Key field crops in Mexico include corn, sugarcane, and wheat.
- Other North American countries collectively contributed 2.4% to the total micronutrient fertilizer market value in 2022. Nations like the Dominican Republic, El Salvador, and Nicaragua, in this segment, rely on fertilizer imports and heavily depend on imported agricultural commodities.
- The North American micronutrient fertilizer market is on a steady growth trajectory and is projected to continue expanding in the coming years. This growth is driven by the increasing recognition of micronutrients' pivotal role in ensuring robust crop growth.
North America Micronutrient Fertilizer Market Trends
Government support, such as subsidies, contributed to the expansion of field crops
- A wide array of crops are grown on North American farms, mainly covering field crops. Corn, cotton, rice, soybean, and wheat are some of the dominating field crops across the region. The United States, Canada, and Mexico are major contributors to the region's agricultural output. In 2022, field crops covered around 97.6% of the overall cultivation in North America, with cereals and oilseeds dominating the market.
- By country, the United States dominates the market by covering 135.7 million hectares of the overall area under crop cultivation. Among them, field crops and horticulture cover the majority of the area and accounted for 97.2% and 2.8% in the year 2022. However, between 2018-2019, the country witnessed a significant dip in crop acreages, which was mainly due to unfavorable environmental conditions resulting in heavy floods in areas like Texas and Houston.
- The largest crop cultivated is corn, the majority of which is grown in a region known as the 'Corn Belt'-a traditional area in the Midwestern United States, roughly covering western Indiana, Illinois, Iowa, Missouri, eastern Nebraska, and eastern Kansas, where corn (maize) and soybeans are the dominant crops. The United States is also a major rice exporter. The rice cultivation in the region is mainly concentrated within four regions, with three in the South and one in California. Therefore, the increased market potential for the region's field crop, coupled with increased government funding and protection, is anticipated to positively drive the area under field crop cultivation in the region.
Raising micronutrient deficiencies and crop losses increase micronutrient application rates
- In 2022, the highest application rates were observed for manganese, copper, zinc, iron, and boron, at 10.6 kg/ha, 6.9 kg/ha, 6.8 kg/ha, 3.3 kg/ha, and 1.5 kg/ha, respectively. Although most micronutrients have lower crop uptake, their unavailability can severely limit critical plant functions, leading to abnormalities, stunted growth, and reduced yields. Given the rising yields, commodity prices, and input costs, growers are scrutinizing potential barriers to grain production, including micronutrient deficiencies.
- Wheat, sorghum, soybean, and cotton dominate micronutrient fertilizer consumption, with other field crops like corn and rice playing a smaller role. Wheat, in particular, faces significant deficiencies in copper and manganese, while iron and zinc deficiencies also mildly impact its yield.
- The micronutrient requirements of each crop are influenced by regional soil conditions. In the United States, sandy soils in the southeast, which are low in organic matter and prone to leaching, commonly exhibit boron deficiencies, unlike the fertile black soils in the northeast. Similarly, certain fields in Central Alberta, Canada, face copper deficiencies, which are crucial for cereal cultivation.
- All agricultural soils in Mexico are zinc-deficient. However, this condition is more common in Queretaro, Sonora, and Sinaloa, indicating an increased need for zinc micronutrient fertilizers. North American soil is naturally deficient in micronutrients, leading to increased consumption of micronutrient supplements during cultivation.
North America Micronutrient Fertilizer Industry Overview
The North America Micronutrient Fertilizer Market is moderately consolidated, with the top five companies occupying 63.51%. The major players in this market are Sociedad Quimica y Minera de Chile SA, The Andersons Inc., The Mosaic Company, Wilbur-Ellis Company LLC and Yara International ASA (sorted alphabetically).
Additional Benefits:
- The market estimate (ME) sheet in Excel format
- 3 months of analyst support
TABLE OF CONTENTS
1 EXECUTIVE SUMMARY & KEY FINDINGS
2 REPORT OFFERS
3 INTRODUCTION
- 3.1 Study Assumptions & Market Definition
- 3.2 Scope of the Study
- 3.3 Research Methodology
4 KEY INDUSTRY TRENDS
- 4.1 Acreage Of Major Crop Types
- 4.1.1 Field Crops
- 4.1.2 Horticultural Crops
- 4.2 Average Nutrient Application Rates
- 4.2.1 Micronutrients
- 4.2.1.1 Field Crops
- 4.2.1.2 Horticultural Crops
- 4.2.1 Micronutrients
- 4.3 Agricultural Land Equipped For Irrigation
- 4.4 Regulatory Framework
- 4.5 Value Chain & Distribution Channel Analysis
5 MARKET SEGMENTATION (includes market size in Value in USD and Volume, Forecasts up to 2030 and analysis of growth prospects)
- 5.1 Product
- 5.1.1 Boron
- 5.1.2 Copper
- 5.1.3 Iron
- 5.1.4 Manganese
- 5.1.5 Molybdenum
- 5.1.6 Zinc
- 5.1.7 Others
- 5.2 Application Mode
- 5.2.1 Fertigation
- 5.2.2 Foliar
- 5.2.3 Soil
- 5.3 Crop Type
- 5.3.1 Field Crops
- 5.3.2 Horticultural Crops
- 5.3.3 Turf & Ornamental
- 5.4 Country
- 5.4.1 Canada
- 5.4.2 Mexico
- 5.4.3 United States
- 5.4.4 Rest of North America
6 COMPETITIVE LANDSCAPE
- 6.1 Key Strategic Moves
- 6.2 Market Share Analysis
- 6.3 Company Landscape
- 6.4 Company Profiles
- 6.4.1 Haifa Group
- 6.4.2 Koch Industries Inc.
- 6.4.3 Nouryon
- 6.4.4 Sociedad Quimica y Minera de Chile SA
- 6.4.5 The Andersons Inc.
- 6.4.6 The Mosaic Company
- 6.4.7 Wilbur-Ellis Company LLC
- 6.4.8 Yara International ASA
7 KEY STRATEGIC QUESTIONS FOR FERTILIZER CEOS
8 APPENDIX
- 8.1 Global Overview
- 8.1.1 Overview
- 8.1.2 Porter's Five Forces Framework
- 8.1.3 Global Value Chain Analysis
- 8.1.4 Market Dynamics (DROs)
- 8.2 Sources & References
- 8.3 List of Tables & Figures
- 8.4 Primary Insights
- 8.5 Data Pack
- 8.6 Glossary of Terms
 2026年全球微量元素肥料市场报告
 微量元素肥料市场报告:趋势、预测与竞争分析(至2031年)
 中东和非洲微量营养素肥料:市场占有率分析、行业趋势、统计数据、成长预测(2025-2030 年)中国微量营养素肥料市场占有率分析、产业趋势与统计、成长预测(2025-2030年)亚太地区微量营养素肥料:市场占有率分析、产业趋势和成长预测(2025-2030 年)南美微量营养素肥料:市场占有率分析、行业趋势和成长预测(2025-2030 年)印度微量营养素肥料:市场占有率分析、行业趋势和统计数据、成长预测(2025-2030 年)微量营养素肥料:市场占有率分析、产业趋势与统计、成长预测(2025-2030 年)欧洲微量营养素肥料市场占有率分析、产业趋势与成长预测(2025-2030年)美国微量营养素肥料:市场占有率分析、行业趋势和统计数据、成长预测(2025-2030 年)