


 |
市场调查报告书
商品编码
1693523
微量营养素肥料:市场占有率分析、产业趋势与统计、成长预测(2025-2030 年)Micronutrient Fertilizer - Market Share Analysis, Industry Trends & Statistics, Growth Forecasts (2025 - 2030) |
||||||
※ 本网页内容可能与最新版本有所差异。详细情况请与我们联繫。
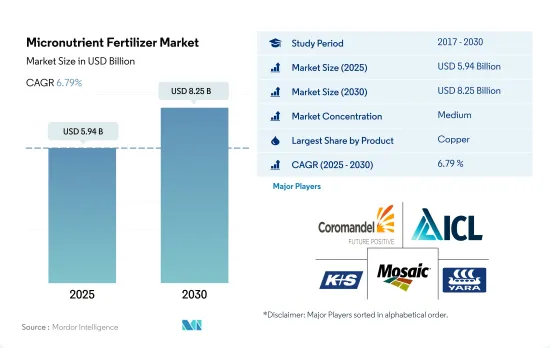
微量营养素肥料市场规模预计在 2025 年为 59.4 亿美元,预计到 2030 年将达到 82.5 亿美元,预测期内(2025-2030 年)的复合年增长率为 6.79%。
土壤中微量营养素缺乏的增加预计将推动微量营养素肥料市场的成长
- 微量营养素在植物的许多代谢活动中发挥着至关重要的作用,例如细胞壁的形成、花粉的形成、发芽、叶绿素的产生、氮的固定和蛋白质基本部分的合成。预计 2023 年至 2030 年期间全球微量营养素肥料市场规模的复合年增长率将达到 6.6%。
- 2022年全球微量营养素肥料市场中,锌的份额为26.6%。在锌肥的价值份额中,常规锌肥约占87.5%,专用锌肥约占12.5%。专用锌肥比传统肥料的优点在于,它能均匀分布在作物上,而且起效快。
- 亚太地区在全球市场占据主导地位,2022 年占 33.3% 的市场规模。微量营养素肥料的分销网络在亚太地区主要国家已建立完善,进一步推动了该地区各种微量营养素肥料产品的市场发展。粮食需求的增加和土壤养分的减少是推动该地区市场成长的一些关键因素。最近的研究表明,锌缺乏症是中国最常见的微量营养素缺乏症。超过 50.0% 的耕地土壤缺锌,限制了农业成长和人类营养改善。
- 全球普遍存在的微量营养素缺乏现象,加上人们对植物健康的兴趣日益浓厚,以及各政府机构和其他组织鼓励改善微量营养素的使用以增强植物和土壤健康,推动着市场的成长。
微量营养素缺乏症的加剧将推动对微量营养素肥料的需求
- 预计在研究期内,全球微量营养素肥料市场将保持稳定成长,到 2022 年市场规模将达到 57 亿美元。 2022 年,亚太地区将占据最大的市场占有率,达到 38.8%,其次是欧洲和北美。
- 印度和中国等国家是主要的微量营养素肥料市场,到2022年分别占市场占有率的13.9%和10.5%。中国作物微量营养素缺乏现像日益严重,导致 2022 年微量营养素肥料消费量增加 31.4%。中国农业部已在国家推荐肥料中添加了 15-30 ZnSO4 公斤/公顷的锌,并且最近将其扩展到水稻和玉米等夏季作物。
- 法国是欧洲最大的微量营养素肥料市场,其次是乌克兰,2022 年市场规模为 2.184 亿美元。园艺作物作物面积将从 2017 年的 1,740 万公顷下降到 2022 年的 1,560 万公顷。不过,预计未来几年这数字将进一步增加。
- 除亚洲外,土壤缺锌、缺铁现像在撒哈拉以南非洲和南美洲西北部也相当普遍。微量营养素肥料的整体益处正得到越来越广泛的接受和认可。 2021 年全球锌出口额为 160 万美元,其中荷兰是该微量营养素的最大出口国,出口额为 275,600 美元。
- 由于全球普遍存在微量营养素缺乏症,铁和锌缺乏症日益成为植物健康关注的问题,并且各政府机构都鼓励增加微量营养素的使用,因此该市场正在不断增长。
微量营养素肥料的全球趋势
为了满足日益增长的粮食需求,农业面临越来越大的压力,预计田间作物的种植面积将会增加。
- 当前全球农业领域面临许多挑战。根据联合国预测,到 2050 年,世界人口可能超过 90 亿。人口成长可能对农业造成过度压力,而由于劳动力短缺和都市化进程加剧导致农地面积减少,农业产量已经下降。根据联合国粮食及农业组织预测,2050年,全球70%的人口预计将居住在城市。随着全球可耕地面积减少,农民需要使用更多的肥料来提高作物产量。
- 亚太地区是世界上最大的农产品生产地区。农业对该地区的经济至关重要,约占总劳动力的 20%。该地区以田间作物种植为主,约占该地区作物总种植面积的95%以上。水稻、小麦和玉米是该地区的主要田间作物,约占2022年总耕地面积的24.3%。
- 北美洲是世界上第二大可耕地。该农场种植多种作物,主要为田间作物。尤其是玉米、棉花、稻米、大豆和小麦,都是美国农业部强调的主要田间作物。 2022年,美国占北美作物种植面积的46.2%。然而,2017年至2019年期间,该国作物种植面积大幅下降,主要原因是恶劣的环境条件导致德克萨斯和休士顿等地区发生严重洪灾。
亚太地区微量营养素平均施用量最高,为5.20公斤/公顷。
- 产量作物养分流失率高,导致微量营养素的需求大幅增加。微量营养素缺乏是影响世界几乎所有地区的问题。 2022年全球田间作物微量营养素平均施用率为3.92公斤/公顷。因此,估计2022年锰、锌、铜将是田间作物施用量较高的大量营养元素,分别为9.53公斤/公顷、6.63公斤/公顷和6.34公斤/公顷。
- 2022 年,平均微量营养素施用率最高的是油菜籽/油菜籽,为 5.20 公斤/公顷,其次是水稻,为 4.42 公斤/公顷,高粱为 4.37 公斤/公顷。不同作物和地区对微量营养素的反应不同。例如,小麦普遍缺乏铜和锰,而亚太地区则发现小麦缺乏硼,钼缺乏。油菜籽/油菜主要缺乏的是锌、锰和铜。
- 2022年微量营养素平均施用量最高的是亚太地区,为5.20公斤/公顷,其次是南美洲,为4.37公斤/公顷,北美洲为4.21公斤/公顷。近年来,随着农民努力提高每公顷种植面积的产量,作物生产中微量营养素的使用量显着增加。需要改善土壤健康和作物生产力,以提高作物产量并满足不断增长的人口的粮食生产需求。因此,全球对微量营养素肥料的需求和农业生产正在显着增长。
微量营养素肥料产业概况
微量营养素肥料市场适度整合,前五大企业占57.38%。该市场的主要企业包括 Coromandel International Ltd.、ICL Group Ltd、K+S Aktiengesellschaft、The Mosaic Company、Yara International ASA 等。
其他福利
- Excel 格式的市场预测 (ME) 表
- 3个月的分析师支持
目录
第一章执行摘要和主要发现
第二章 报告要约
第三章 引言
- 研究假设和市场定义
- 研究范围
- 调查方法
第四章 产业主要趋势
- 主要作物种植面积
- 田间作物
- 园艺作物
- 平均养分施用量
- 微量营养素
- 田间作物
- 园艺作物
- 微量营养素
- 灌溉农田
- 法律规范
- 价值炼和通路分析
第五章市场区隔
- 产品
- 硼
- 铜
- 铁
- 锰
- 钼
- 锌
- 其他的
- 如何申请
- 受精
- 叶面喷布
- 土壤
- 作物类型
- 田间作物
- 园艺作物
- 草坪和观赏植物
- 地区
- 亚太地区
- 澳洲
- 孟加拉
- 中国
- 印度
- 印尼
- 日本
- 巴基斯坦
- 菲律宾
- 泰国
- 越南
- 其他亚太地区
- 欧洲
- 法国
- 德国
- 义大利
- 荷兰
- 俄罗斯
- 西班牙
- 乌克兰
- 英国
- 其他欧洲国家
- 中东和非洲
- 奈及利亚
- 沙乌地阿拉伯
- 南非
- 土耳其
- 其他中东和非洲地区
- 北美洲
- 加拿大
- 墨西哥
- 美国
- 北美其他地区
- 南美洲
- 阿根廷
- 巴西
- 南美洲其他地区
- 亚太地区
第六章竞争格局
- 关键策略趋势
- 市场占有率分析
- 商业状况
- 公司简介
- BMS Micro-Nutrients NV
- Coromandel International Ltd.
- Haifa Group
- ICL Group Ltd
- K+S Aktiengesellschaft
- Koch Industries Inc.
- Nouryon
- The Mosaic Company
- Yara International ASA
第七章:CEO面临的关键策略问题
第 8 章 附录
- 世界概况
- 概述
- 五力分析框架
- 全球价值链分析
- 市场动态(DRO)
- 资讯来源及延伸阅读
- 图片列表
- 关键见解
- 数据包
- 词彙表
The Micronutrient Fertilizer Market size is estimated at 5.94 billion USD in 2025, and is expected to reach 8.25 billion USD by 2030, growing at a CAGR of 6.79% during the forecast period (2025-2030).
The rising micronutrient deficiency in soil is expected to fuel the growth of the micronutrient fertilizer market
- Micronutrients play an important role in many plant metabolic activities, such as cell wall formation, pollen formation, germination, chlorophyll production, nitrogen fixation, and the synthesis of the essential parts of proteins. The global micronutrient fertilizer market value is anticipated to register a CAGR of 6.6% during 2023-2030.
- Zinc accounted for a major share of 26.6% of the global micronutrient fertilizer market value in 2022. Of the total value share held by zinc fertilizers, conventional zinc fertilizers accounted for about 87.5%, and specialty zinc fertilizers accounted for about 12.5%. Specialty zinc fertilizers have the advantage of uniform distribution and fast acting on crops compared to conventional fertilizers.
- The Asia-Pacific region dominated the global market, accounting for 33.3% of the market value share in 2022. The distribution network of micronutrient fertilizers is well-established in the major Asia-Pacific countries, further boosting the market for various micronutrient fertilizer products in the region. The increasing demand for food grains, coupled with decreasing nutrients in the soil, is one of the major factors driving the growth of the market in the region. Recent studies have indicated that zinc deficiency is China's most widespread micronutrient deficiency. More than 50.0% of the arable soils are low in zinc, thereby limiting agricultural growth and improvement in human nutrition.
- Widespread micronutrient deficiencies worldwide are becoming a rising concern for plant health, coupled with increasing encouragement from various government agencies and other organizations to improve the use of micronutrients to enhance plant and soil health, which is driving the growth of the market.
The increase in micronutrient deficiencies increases the demand for micronutrient fertilizers
- The global micronutrient fertilizer market grew at a stable rate during the study period, with a value of USD 5.70 billion in 2022. Asia-Pacific occupied the largest market share of 38.8% in 2022, followed by Europe and North America.
- Countries such as India and China are the major micronutrient fertilizer markets, accounting for 13.9% and 10.5% of the market share in 2022, respectively. The increase in micronutrient deficiency in Chinese crops resulted in 31.4% of micronutrient fertilizer consumption in 2022. The Ministry of Agriculture (MoA) of China added zinc, at a rate of 15-30 ZnSO4 kg/ha, to its national fertilizer recommendation, which was recently extended for summer crops like rice and corn.
- France is the major market for micronutrient fertilizer in Europe, followed by Ukraine, with a market value of USD 218.4 million in 2022. The area under the cultivation of horticultural crops decreased from 17.4 million hectares in 2017 to 15.6 million hectares in 2022. However, the figure is expected to increase further in the following years.
- Apart from Asia, zinc and iron deficiency in the soil is quite widespread in Sub-Saharan Africa and northwest South America. The overall advantages of micronutrient fertilizers are being widely accepted and recognized. The global export value of zinc in 2021 amounted to USD 1.6 million, with the Netherlands as the top exporter of the micronutrients, with a value of USD 275.6 thousand.
- The market is growing because of the widespread micronutrient deficiencies around the world, with iron and zinc deficiencies becoming a rising concern for plant health, and also due to the increasing encouragement from various government agencies to increase the use of micronutrients.
Global Micronutrient Fertilizer Market Trends
The rising pressure on the agriculture industry to meet the growing demand for food is expected to increase the area under field crop cultivation
- The global agricultural sector is currently facing many challenges. According to the UN, the world population may exceed 9 billion by 2050. This population growth may overburden the agricultural industry, which is already experiencing an output loss due to a lack of laborers and the shrinkage of agricultural fields caused by rising urbanization. According to the Food and Agriculture Organization, 70% of the global population is expected to live in cities by 2050. Due to the global loss of arable land, farmers now need to utilize more fertilizers to increase crop yields.
- The Asia-Pacific region is the world's largest producer of agricultural products. Agriculture is critical to the region's economy, as it employs about 20% of the total available workforce. Field crop cultivation dominates the region, accounting for about more than 95% of the total crop area in the region. Rice, wheat, and corn are the major field crops produced in the region, together accounting for about 24.3% of the total crop area in 2022.
- North America ranks as the second-largest arable region globally. Its farms cultivate a diverse range of crops, with a focus on field crops. Notably, corn, cotton, rice, soybean, and wheat are the prominent field crops, as highlighted by the USDA. In 2022, the United States commanded 46.2% of North America's crop cultivation area. However, the country witnessed a significant drop in crop acreage between 2017 and 2019, primarily due to adverse environmental conditions, leading to severe flooding in regions like Texas and Houston.
The Asia-Pacific region accounted for the highest average micronutrient application rate of 5.20 kg/hectare
- Due to high rates of nutrient loss from high-yielding crops, the demand for micronutrients has risen significantly. Micronutrient deficiency is a problem that affects almost all regions across the world. Globally, the average micronutrient application in field crops was 3.92 kg/hectare in 2022. Accordingly, manganese, zinc, and copper were estimated to be major nutrients with higher application rates in field crops in 2022, accounting for 9.53 kg/ha, 6.63 kg/ha, and 6.34 kg/ha, respectively.
- Rapeseed/canola led the pack with the highest average micronutrient application of 5.20 kg/ha in 2022, followed by rice and sorghum at 4.42 kg/ha and 4.37 kg/ha, respectively. Different crops and regions respond differently to micronutrients. For example, copper and manganese deficiencies are common in wheat, while boron deficiency is observed in wheat, and molybdenum is lacking in the Asia-Pacific region. In rapeseed/canola, zinc, manganese, and copper are the primary deficiencies.
- In 2022, Asia-Pacific had the highest average micronutrient application rate of 5.20 kg/ha, followed by South America with 4.37 kg/ha and North America with 4.21kg/ha. Micronutrient use in crop production has increased significantly in recent years as farmers strive to increase yield per planted hectare. To improve soil health and crop productivity and satisfy a growing population, crop yields must increase to meet food production demands. As a result, the global demand for micronutrient fertilizers and agricultural production is experiencing the most significant rise.
Micronutrient Fertilizer Industry Overview
The Micronutrient Fertilizer Market is moderately consolidated, with the top five companies occupying 57.38%. The major players in this market are Coromandel International Ltd., ICL Group Ltd, K+S Aktiengesellschaft, The Mosaic Company and Yara International ASA (sorted alphabetically).
Additional Benefits:
- The market estimate (ME) sheet in Excel format
- 3 months of analyst support
TABLE OF CONTENTS
1 EXECUTIVE SUMMARY & KEY FINDINGS
2 REPORT OFFERS
3 INTRODUCTION
- 3.1 Study Assumptions & Market Definition
- 3.2 Scope of the Study
- 3.3 Research Methodology
4 KEY INDUSTRY TRENDS
- 4.1 Acreage Of Major Crop Types
- 4.1.1 Field Crops
- 4.1.2 Horticultural Crops
- 4.2 Average Nutrient Application Rates
- 4.2.1 Micronutrients
- 4.2.1.1 Field Crops
- 4.2.1.2 Horticultural Crops
- 4.2.1 Micronutrients
- 4.3 Agricultural Land Equipped For Irrigation
- 4.4 Regulatory Framework
- 4.5 Value Chain & Distribution Channel Analysis
5 MARKET SEGMENTATION (includes market size in Value in USD and Volume, Forecasts up to 2030 and analysis of growth prospects)
- 5.1 Product
- 5.1.1 Boron
- 5.1.2 Copper
- 5.1.3 Iron
- 5.1.4 Manganese
- 5.1.5 Molybdenum
- 5.1.6 Zinc
- 5.1.7 Others
- 5.2 Application Mode
- 5.2.1 Fertigation
- 5.2.2 Foliar
- 5.2.3 Soil
- 5.3 Crop Type
- 5.3.1 Field Crops
- 5.3.2 Horticultural Crops
- 5.3.3 Turf & Ornamental
- 5.4 Region
- 5.4.1 Asia-Pacific
- 5.4.1.1 Australia
- 5.4.1.2 Bangladesh
- 5.4.1.3 China
- 5.4.1.4 India
- 5.4.1.5 Indonesia
- 5.4.1.6 Japan
- 5.4.1.7 Pakistan
- 5.4.1.8 Philippines
- 5.4.1.9 Thailand
- 5.4.1.10 Vietnam
- 5.4.1.11 Rest of Asia-Pacific
- 5.4.2 Europe
- 5.4.2.1 France
- 5.4.2.2 Germany
- 5.4.2.3 Italy
- 5.4.2.4 Netherlands
- 5.4.2.5 Russia
- 5.4.2.6 Spain
- 5.4.2.7 Ukraine
- 5.4.2.8 United Kingdom
- 5.4.2.9 Rest of Europe
- 5.4.3 Middle East & Africa
- 5.4.3.1 Nigeria
- 5.4.3.2 Saudi Arabia
- 5.4.3.3 South Africa
- 5.4.3.4 Turkey
- 5.4.3.5 Rest of Middle East & Africa
- 5.4.4 North America
- 5.4.4.1 Canada
- 5.4.4.2 Mexico
- 5.4.4.3 United States
- 5.4.4.4 Rest of North America
- 5.4.5 South America
- 5.4.5.1 Argentina
- 5.4.5.2 Brazil
- 5.4.5.3 Rest of South America
- 5.4.1 Asia-Pacific
6 COMPETITIVE LANDSCAPE
- 6.1 Key Strategic Moves
- 6.2 Market Share Analysis
- 6.3 Company Landscape
- 6.4 Company Profiles
- 6.4.1 BMS Micro-Nutrients NV
- 6.4.2 Coromandel International Ltd.
- 6.4.3 Haifa Group
- 6.4.4 ICL Group Ltd
- 6.4.5 K+S Aktiengesellschaft
- 6.4.6 Koch Industries Inc.
- 6.4.7 Nouryon
- 6.4.8 The Mosaic Company
- 6.4.9 Yara International ASA
7 KEY STRATEGIC QUESTIONS FOR FERTILIZER CEOS
8 APPENDIX
- 8.1 Global Overview
- 8.1.1 Overview
- 8.1.2 Porter's Five Forces Framework
- 8.1.3 Global Value Chain Analysis
- 8.1.4 Market Dynamics (DROs)
- 8.2 Sources & References
- 8.3 List of Tables & Figures
- 8.4 Primary Insights
- 8.5 Data Pack
- 8.6 Glossary of Terms
 2026年全球微量元素肥料市场报告
 微量元素肥料市场报告:趋势、预测与竞争分析(至2031年)
 中东和非洲微量营养素肥料:市场占有率分析、行业趋势、统计数据、成长预测(2025-2030 年)中国微量营养素肥料市场占有率分析、产业趋势与统计、成长预测(2025-2030年)亚太地区微量营养素肥料:市场占有率分析、产业趋势和成长预测(2025-2030 年)北美微量营养素肥料:市场占有率分析、行业趋势和成长预测(2025-2030 年)南美微量营养素肥料:市场占有率分析、行业趋势和成长预测(2025-2030 年)印度微量营养素肥料:市场占有率分析、行业趋势和统计数据、成长预测(2025-2030 年)欧洲微量营养素肥料市场占有率分析、产业趋势与成长预测(2025-2030年)美国微量营养素肥料:市场占有率分析、行业趋势和统计数据、成长预测(2025-2030 年)