


 |
市场调查报告书
商品编码
1693538
非洲微量营养素肥料:市场占有率分析、产业趋势和成长预测(2025-2030 年)Africa Micronutrient Fertilizer - Market Share Analysis, Industry Trends & Statistics, Growth Forecasts (2025 - 2030) |
||||||
价格
※ 本网页内容可能与最新版本有所差异。详细情况请与我们联繫。
简介目录
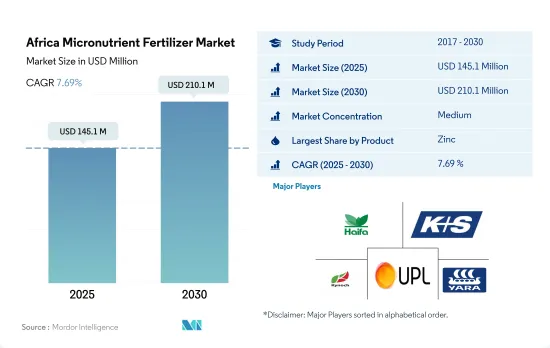
预计 2025 年非洲微量营养素肥料市场规模为 1.451 亿美元,到 2030 年将达到 2.101 亿美元,预测期内(2025-2030 年)的复合年增长率为 7.69%。
该地区土壤微量营养素缺乏可能会推动市场
- 锌是该地区消费最广泛的微量营养素肥料,2022年占总消费量的30.7%。这种肥料因其在提高作物产量方面发挥作用而备受关注。非洲国家在应对营养不良等社会经济挑战的同时,也努力提高生产力。特别是该地区农业土壤普遍缺锌,进一步推高了对锌肥的需求。
- 硼是非洲消费量第二大的微量营养素肥料,消费量将达到 23,000 吨,占市场占有率的 24.8%。它能活化有助于吸收钾等关键营养物质的酶,并在早期根部发育中发挥关键作用,这可以提升市场前景。
- 铁是非洲第三大消费的微量营养素肥料,占2022年总消费量的19.5%和市场价值的11.7%。铁的使用是由于该地区土壤普遍存在营养缺乏现象。
- 锰和铜是常用的微量营养素,主要用于缺乏症状时。 2022年,锰的份额将达到12.1%,铜的份额将达到9.0%。另一方面,钼、钴、氯、镍、硒等微量元素在土壤中含量丰富,但需要量却很少,因此需求量很小。然而,由于土壤品质恶化,这些肥料的施用量正在逐渐增加。
人口成长和粮食不安全加剧推动微量营养素肥料市场
- 2022年,撒哈拉以南非洲地区拥有全球13%的人口和全球约20%的农业用地。儘管有这些优势,该地区仍然面临严重的粮食短缺问题。问题是由于粮食产量有限,主要是缺乏现代机械化、化学肥料利用不足和土壤微量营养素缺乏。
- 2022年,尼日利亚引领微量营养素肥料市场,占总量的26.0%。其中,田间作物占比最大,为98.5%,产量为2.23万吨。园艺作物所占比例仅1.4%。对田间作物的偏好可能是由于该地区的密集耕作方式,这常常导致营养缺乏,需要补充肥料。
- 在 2022 年非洲微量营养素肥料市场中,南非占有 24.4% 的显着价值份额。在南非,传统微量营养素肥料占了91.0%的市场份额,价值5,260万美元。同时,特种微量营养素肥料的份额为 9.0%,价值 640 万美元。传统肥料之所以受欢迎,是因为它们能够有效地快速解决微量营养素缺乏的问题,尤其是透过土壤施用。
- 鑑于该地区耕地面积的扩大和粮食需求的增加,微量营养素肥料的销售量预计将在 2023 年至 2030 年间增长。
非洲微量营养素肥料市场趋势
该地区的农业产量可能翻一番,不断增长的消费需求预计将扩大田间作物的种植面积。
- 非洲的农业生态学区从每年降雨两次的茂密热带雨林到降雨稀少的干旱沙漠。该地区的主要田间作物包括玉米、高粱、小麦和水稻。到2022年,这些作物的种植面积将达到约2.248亿公顷,占该地区农业用地的95%以上。
- 由于玉米库存过剩抑制了价格,南非玉米种植者在2018-19年度将玉米种植面积减少了10%,至210万公顷。结果,该国玉米产量下降了11%,从1300万吨下降到1200万吨,而出口量从250万吨暴跌到100万吨。随着越来越多的农民将土地转为种植作物,尤其是大豆,预计2018-19年度非洲玉米种植面积的下降趋势将持续下去。
- 非洲的高粱生产以尼日利亚为首,紧随其后的是埃塞俄比亚。高粱是尼日利亚主要的谷物作物,占尼日利亚谷物总产量的50%和种植面积的45%。高粱耐旱耐涝,能适应各种土壤条件,已成为非洲旱区首选的主要作物,确保了粮食和收入安全。
- 肯亚、索马利亚和衣索比亚大部分地区面临严重粮食不安全的迫在眉睫的威胁。过去十年,儘管非洲的农业和耕地面积不断扩大,但其粮食进口支出却增加了近两倍。
由于土壤中微量营养素严重缺乏,农民正在增加微量营养素的施用。
- 2022年,锌、铁、硼、锰和铜是消费量最多的微量营养素,分别占30.9%、30.1%、17.3%、16.40%和4.5%。微量营养素对于植物的生长至关重要,因此在作物营养中发挥重要作用。微量营养素缺乏会导致植物异常、生长迟缓和产量下降。水稻、玉米、高粱和小麦是非洲的主要田间作物,2022年田间作物将占微量营养素总消费量的92.6%(49.09万吨)。这些作物的平均养分施用量分别为每公顷4.3公斤、3.6公斤、4.3公斤和4.2公斤。小麦尤其容易面临铜和锰的缺乏,而铁和锌的缺乏对产量的影响较小。
- 奈及利亚在非洲国家中脱颖而出,占农田作物微量营养素肥料消费量的 33.3%,2022 年达到 4.0715 亿美元。紧随其后的是南非,占 0.5%,价值 670 万美元。其余非洲国家则占微量营养素市场的66.6%。预计非洲微量营养素肥料市场将在 2023 年至 2030 年间增长,这得益于向可持续农业实践的转变以及对维持土壤中最佳微量营养素水平对作物生长的重要性的认识。
- 随着农民努力提高每公顷的产量,作物生产中微量营养素的使用量大幅增加。微量营养素缺乏的普遍性加上对作物需求的不断增加,促使农民采用更多的微量营养素来改善土壤健康和提高作物产量。
非洲微量营养素肥料产业概况
非洲微量营养素肥料市场适度整合,前五大公司占48.12%。该市场的主要企业包括海法集团、K+S Aktiengesellschaft、Kynoch Fertilizer、UPL Limited、Yara International ASA 等。
其他福利
- Excel 格式的市场预测 (ME) 表
- 3个月的分析师支持
目录
第一章执行摘要和主要发现
第二章 报告要约
第三章 引言
- 研究假设和市场定义
- 研究范围
- 调查方法
第四章 产业主要趋势
- 主要作物种植面积
- 田间作物
- 园艺作物
- 平均养分施用量
- 微量营养素
- 田间作物
- 园艺作物
- 微量营养素
- 灌溉农田
- 法律规范
- 价值炼和通路分析
第五章市场区隔
- 产品
- 硼
- 铜
- 铁
- 锰
- 钼
- 锌
- 其他的
- 如何申请
- 受精
- 叶面喷布
- 土壤
- 作物类型
- 田间作物
- 园艺作物
- 草坪和观赏植物
- 原产地
- 奈及利亚
- 南非
- 其他非洲国家
第六章竞争格局
- 关键策略趋势
- 市场占有率分析
- 商业状况
- 公司简介
- Gavilon South Africa(MacroSource, LLC)
- Haifa Group
- K+S Aktiengesellschaft
- Kynoch Fertilizer
- UPL Limited
- Yara International ASA
第七章 CEO 的关键策略问题
第 8 章 附录
- 世界概况
- 概述
- 五力分析框架
- 全球价值链分析
- 市场动态(DRO)
- 资讯来源及延伸阅读
- 图片列表
- 关键见解
- 数据包
- 词彙表
简介目录
Product Code: 92603
The Africa Micronutrient Fertilizer Market size is estimated at 145.1 million USD in 2025, and is expected to reach 210.1 million USD by 2030, growing at a CAGR of 7.69% during the forecast period (2025-2030).
Micronutrient deficiencies in the region's soils may drive the market
- Zinc, the most widely consumed micronutrient fertilizer in the region, accounted for 30.7% of the total consumption in the year 2022. Its prominence is attributed to its role in enhancing crop yields. African countries grappling with socio-economic challenges, such as malnutrition, are striving to boost productivity. Notably, zinc deficiency is prevalent in the region's agricultural soils, further driving up the demand for zinc fertilizers.
- Boron, the second most consumed micronutrient fertilizer in Africa, saw a volume consumption of 23.0 thousand metric tons in the year 2022, capturing a 24.8% market share. It plays a crucial role in early-stage root development and activating enzymes that aid in the uptake of major nutrients like potassium, potentially bolstering its market prospects.
- Iron, the third most consumed micronutrient fertilizer in Africa, constituted 19.5% of the total consumption and 11.7% of the market value in the year 2022. Its usage is propelled by prevalent nutrient deficiencies in the region's soils.
- Manganese and copper are commonly employed micronutrients, primarily used when deficiency symptoms arise. In 2022, manganese and copper accounted for shares of 12.1% and 9.0%, respectively. On the other hand, micronutrients like molybdenum, cobalt, chlorine, nickel, and selenium, though abundant in the soil, are less in demand due to their lower requirements. However, with soil quality deteriorating, there is a gradual uptick in the application of these fertilizers.
Growing population and increasing food insecurity concerns propel the micronutrient fertilizer market
- In 2022, the Sub-Saharan African region, home to 13% of the global population, boasted around 20% of the world's agricultural land. Despite this advantage, the region grapples with significant food insecurity. This issue stems from limited food production, largely due to a lack of modern mechanization, underutilization of fertilizers, and prevalent soil micronutrient deficiencies.
- In 2022, Nigeria led the way in the micronutrient fertilizer market, accounting for 26.0% of the total volume. Field crops dominated the fertilizer landscape, claiming a whopping 98.5% share, equivalent to 22.3 thousand metric tons. Horticulture crops trailed behind with a modest 1.4% market share. This preference for field crops can be attributed to the region's intensive agricultural practices, which often lead to nutrient deficiencies necessitating fertilizer supplementation.
- South Africa held a significant value share of 24.4% in the African micronutrient fertilizer market in 2022. Within South Africa, conventional micronutrient fertilizers commanded a lion's share of 91.0%, valued at USD 52.6 million. Specialty micronutrient fertilizers, on the other hand, held a 9.0% share, amounting to USD 6.4 million. The popularity of conventional fertilizers can be attributed to their efficacy in swiftly addressing micronutrient deficiencies, especially through soil application.
- Given the expanding cultivation areas and the region's escalating food demand, the sales of micronutrient fertilizers are poised for growth during 2023-2030.
Africa Micronutrient Fertilizer Market Trends
The region has the potential to double its agricultural production, and the area under field crops is expected to expand due to the rising consumption demand
- The agroecological zones in Africa span from dense rainforests with bi-annual rainfall to arid deserts with minimal precipitation. Key field crops in the region encompass corn, sorghum, wheat, and rice. In 2022, the cultivation area for these crops reached approximately 224.8 million hectares, constituting over 95% of the agricultural land in the region.
- In response to a surplus of corn stocks that led to price suppression, South African corn farmers scaled back their planting by 10% to 2.1 million hectares in the 2018-19 season. Consequently, corn production in the country dipped by 11% from 13 million to 12 million tonnes, and exports plummeted from 2.5 million to 1 million tonnes. This downward trend in corn cultivation is expected to continue in Africa for 2018-2019 as more producers pivot their fields toward oilseed crops, especially soybeans.
- Nigeria takes the lead in sorghum production in Africa, and Ethiopia is closely followed. Sorghum dominates as the primary cereal crop, accounting for 50% of the total output and occupying 45% of Nigeria's cereal cropland. With its resilience to drought and waterlogging and adaptability to diverse soil conditions, sorghum emerges as the preferred staple crop in Africa's arid regions, ensuring both food and income security.
- Kenya, Somalia, and significant parts of Ethiopia face an imminent threat of severe food shortages. Over the past decade, Africa's spending on food imports has nearly tripled despite a consistent expansion in its agricultural industry and cultivated land.
High micronutrient deficiencies in soil have encouraged farmers to apply more micronutrients
- In 2022, zinc, iron, boron, manganese, and copper were the most consumed micronutrients, accounting for 30.9%, 30.1%, 17.3%, 16.40%, and 4.5%, respectively. Micronutrients play a crucial role in crop nutrition, as they are essential for plant growth. Insufficient levels of any micronutrient can lead to plant abnormalities, stunted growth, and reduced yields. Rice, maize, sorghum, and wheat are the primary field crops in Africa, with field crops accounting for 92.6% (490.9 thousand metric tons) of the total micronutrient consumption in 2022. The average nutrient application rates for these crops are 4.3, 3.6, 4.3, and 4.2 kg per hectare, respectively. Wheat, in particular, faces deficiencies in copper and manganese, with slight yield impacts from iron and zinc deficiencies.
- Nigeria stands out among African nations, representing 33.3% of the micronutrient fertilizer consumption in the field crop segment, valued at USD 407.15 million in 2022. South Africa follows with a 0.5% share, valued at USD 6.7 million. The remaining African countries account for the remaining 66.6% of the micronutrient market. The African micronutrient fertilizers market is poised for growth during 2023-2030, driven by a shift toward sustainable farming practices and the recognition of the importance of maintaining optimal micronutrient levels in the soil for crop growth.
- As farmers strive for higher yields per hectare, the use of micronutrients in crop production has seen a significant surge. The prevalence of micronutrient deficiencies, coupled with the rising demand for crops, has prompted farmers to adopt more micronutrients to improve soil health and boost crop productivity.
Africa Micronutrient Fertilizer Industry Overview
The Africa Micronutrient Fertilizer Market is moderately consolidated, with the top five companies occupying 48.12%. The major players in this market are Haifa Group, K+S Aktiengesellschaft, Kynoch Fertilizer, UPL Limited and Yara International ASA (sorted alphabetically).
Additional Benefits:
- The market estimate (ME) sheet in Excel format
- 3 months of analyst support
TABLE OF CONTENTS
1 EXECUTIVE SUMMARY & KEY FINDINGS
2 REPORT OFFERS
3 INTRODUCTION
- 3.1 Study Assumptions & Market Definition
- 3.2 Scope of the Study
- 3.3 Research Methodology
4 KEY INDUSTRY TRENDS
- 4.1 Acreage Of Major Crop Types
- 4.1.1 Field Crops
- 4.1.2 Horticultural Crops
- 4.2 Average Nutrient Application Rates
- 4.2.1 Micronutrients
- 4.2.1.1 Field Crops
- 4.2.1.2 Horticultural Crops
- 4.2.1 Micronutrients
- 4.3 Agricultural Land Equipped For Irrigation
- 4.4 Regulatory Framework
- 4.5 Value Chain & Distribution Channel Analysis
5 MARKET SEGMENTATION (includes market size in Value in USD and Volume, Forecasts up to 2030 and analysis of growth prospects)
- 5.1 Product
- 5.1.1 Boron
- 5.1.2 Copper
- 5.1.3 Iron
- 5.1.4 Manganese
- 5.1.5 Molybdenum
- 5.1.6 Zinc
- 5.1.7 Others
- 5.2 Application Mode
- 5.2.1 Fertigation
- 5.2.2 Foliar
- 5.2.3 Soil
- 5.3 Crop Type
- 5.3.1 Field Crops
- 5.3.2 Horticultural Crops
- 5.3.3 Turf & Ornamental
- 5.4 Country
- 5.4.1 Nigeria
- 5.4.2 South Africa
- 5.4.3 Rest of Africa
6 COMPETITIVE LANDSCAPE
- 6.1 Key Strategic Moves
- 6.2 Market Share Analysis
- 6.3 Company Landscape
- 6.4 Company Profiles
- 6.4.1 Gavilon South Africa (MacroSource, LLC)
- 6.4.2 Haifa Group
- 6.4.3 K+S Aktiengesellschaft
- 6.4.4 Kynoch Fertilizer
- 6.4.5 UPL Limited
- 6.4.6 Yara International ASA
7 KEY STRATEGIC QUESTIONS FOR FERTILIZER CEOS
8 APPENDIX
- 8.1 Global Overview
- 8.1.1 Overview
- 8.1.2 Porter's Five Forces Framework
- 8.1.3 Global Value Chain Analysis
- 8.1.4 Market Dynamics (DROs)
- 8.2 Sources & References
- 8.3 List of Tables & Figures
- 8.4 Primary Insights
- 8.5 Data Pack
- 8.6 Glossary of Terms
02-2729-4219
+886-2-2729-4219
 2026年全球微量元素肥料市场报告
 微量元素肥料市场报告:趋势、预测与竞争分析(至2031年)
 中东和非洲微量营养素肥料:市场占有率分析、行业趋势、统计数据、成长预测(2025-2030 年)中国微量营养素肥料市场占有率分析、产业趋势与统计、成长预测(2025-2030年)亚太地区微量营养素肥料:市场占有率分析、产业趋势和成长预测(2025-2030 年)北美微量营养素肥料:市场占有率分析、行业趋势和成长预测(2025-2030 年)南美微量营养素肥料:市场占有率分析、行业趋势和成长预测(2025-2030 年)印度微量营养素肥料:市场占有率分析、行业趋势和统计数据、成长预测(2025-2030 年)微量营养素肥料:市场占有率分析、产业趋势与统计、成长预测(2025-2030 年)欧洲微量营养素肥料市场占有率分析、产业趋势与成长预测(2025-2030年)
▼