


 |
市场调查报告书
商品编码
1693506
中国微量营养素肥料市场占有率分析、产业趋势与统计、成长预测(2025-2030年)China Micronutrient Fertilizer - Market Share Analysis, Industry Trends & Statistics, Growth Forecasts (2025 - 2030) |
||||||
※ 本网页内容可能与最新版本有所差异。详细情况请与我们联繫。
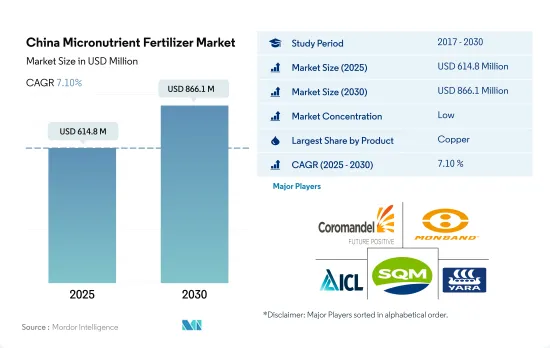
预计 2025 年中国微量营养素肥料市场规模为 6.148 亿美元,到 2030 年将达到 8.661 亿美元,预测期内(2025-2030 年)的复合年增长率为 7.10%。
为了提高生产力而对微量营养素的需求不断增加可能会推动市场成长。
- 土壤微量营养素缺乏是全国普遍的问题。有些微量营养素由于流动性较差,在地壳中较为丰富。它们导致作物缺乏微量营养素。
- 铜是国内作物生产常用的微量营养肥料。它约占 2022 年微量营养素肥料市场总量的 27.6%。铜 (Cu) 是植物所需的少量微量营养素之一。它是光合作用所必需的,对于植物呼吸至关重要,并有助于植物代谢蛋白质和碳水化合物。铜可以增强蔬菜和花卉的颜色,并在蛋白质的形成中发挥重要作用。
- 中国大部分土壤含有充足的铜。但对于蔬菜作物来说,平均铜施用量比2022年田间作物的平均铜施用量高出0.2%。由于铜是植物体内不可移动的元素,因此铜缺乏的症状首先出现在植物的幼嫩部分。
- 锌是该国消费量最大的微量营养素,到 2022 年将占据第二大市场占有率,达到 25.49%。植物对锌的需求量非常小。大多数植物的正常锌含量在 20 至 100 ppm 之间。然而,这种少量的锌作为酵素的辅因子和蛋白质的结构成分在植物中发挥重要作用。
- 生产力提高、产量增加以及为不断增长的人口维持粮食和营养安全的需求等因素可能会推动市场在 2023 年至 2030 年期间以 6.9% 的复合年增长率增长,而先进肥料的出现也可能促进微量营养素的消费。
中国微肥市场趋势
耕地面积的扩大是由于粮食需求的增加以及该国实现主粮自给自足的目标。
- 中国田间作物种植面积将从2018年的1.266亿公顷略微增加到2022年的1.278亿公顷,占耕地总面积的70.8%。 2022年,玉米将占田间作物的34.2%,其次是水稻,占23.6%,小麦占18.3%。耕地面积的增加将增加中国对化肥的需求。
- 中国农田作物日历围绕着两个季节:春夏季(四月至九月)和冬季。春季作物包括早玉米、早稻、早小麦、棉花等,冬季作物包括冬小麦、油菜等。但人们关注的焦点是大米和玉米,这两种作物占中国粮食产量的三分之一。中国是世界最大的稻米生产国,预计2022年稻米种植面积将达3,000万公顷,稻米产量将达2.1亿吨。水稻主产区分布在黑龙江、湖南、江西、湖北、江苏、四川、广西、广东、湖南等地。玉米方面,预计2022-2023年中国玉米产量为2.772亿吨,较上年度大幅增加460万吨,受惠于玉米丰收。黑龙江、吉林、内蒙古等东北三省是玉米生产大省。
- 中国的生长季节主要在春季,但六月和七月气候炎热。米,数百万人的主食,正遭受这种后果。炎热的气温和稀少的降雨加剧了土壤矿物质的缺乏,因此需要增加施肥量。这些干旱条件也导致作物产量下降。
在中国,油菜籽和菜籽比其他田间作物吸收的微量营养素含量更高。
- 微量营养素在作物营养和生长中起着重要作用,其缺乏会对产量重大影响。田间作物微肥平均施用量一般为5.2公斤/公顷。尤其是锰,它是地壳中第 11 种最丰富的微量营养素,但 2022 年的施用率最高,为 9.8 公斤/公顷。然而,当土壤 pH 值升至 7 以上时,就会发生化学和微生物氧化,从而固定植物可利用的 Mn2+。这会导致植物缺锰。
- 2022年,锰之后是铜,施用量为7.3公斤/公顷,其次是锌,施用量为4.1公斤/公顷,铁为3.3公斤/公顷。
- 在中国,菜籽因其微量营养素施用量高于其他田间作物而脱颖而出。考虑到微量营养素缺乏对油产量有显着影响,平均每公顷油菜籽施用10.79公斤微量营养素。值得注意的是,叶面喷布锰和钼可使种子油含量增加 1%。
- 土壤中微量营养素的缺乏可能是由于过量施用磷酸盐和其他自然因素造成的。磷酸盐尤其会限制作物对铁、锌和铜的吸收。中国采取了减少磷肥施用量、增加锌肥施用量的策略来提高田间作物产量。
- 微量营养素肥料的最佳施用可以提高植物从土壤中吸收主要营养素的效率,并减少蔬菜作物的整体肥料需求。
中国微肥产业概况
中国微肥市场分散,前五大企业市占率合计为27.14%。该市场的主要企业包括 Coromandel International Ltd.、河北蒙邦水溶性肥料、ICL Group Ltd、Sociedad Quimica y Minera de Chile SA、Yara International ASA 等。
其他福利
- Excel 格式的市场预测 (ME) 表
- 3个月的分析师支持
目录
第一章执行摘要和主要发现
第二章 报告要约
第三章 引言
- 研究假设和市场定义
- 研究范围
- 调查方法
第四章 产业主要趋势
- 主要作物种植面积
- 田间作物
- 园艺作物
- 平均养分施用量
- 微量营养素
- 田间作物
- 园艺作物
- 微量营养素
- 灌溉农田
- 法律规范
- 价值炼和通路分析
第五章市场区隔
- 产品
- 硼
- 铜
- 铁
- 锰
- 钼
- 锌
- 其他的
- 应用模式
- 受精
- 叶面喷布
- 土壤
- 作物类型
- 田间作物
- 园艺作物
- 草坪和观赏植物
第六章竞争格局
- 关键策略趋势
- 市场占有率分析
- 商业状况
- 公司简介
- Coromandel International Ltd.
- Grupa Azoty SA(Compo Expert)
- Haifa Group
- Hebei Monband Water Soluble Fertilizer Co. Ltd
- ICL Group Ltd
- Sociedad Quimica y Minera de Chile SA
- Yara International ASA
第七章 CEO 的关键策略问题
第 8 章 附录
- 世界概况
- 概述
- 五力分析框架
- 全球价值链分析
- 市场动态(DRO)
- 资讯来源及延伸阅读
- 图片列表
- 关键见解
- 数据包
- 词彙表
The China Micronutrient Fertilizer Market size is estimated at 614.8 million USD in 2025, and is expected to reach 866.1 million USD by 2030, growing at a CAGR of 7.10% during the forecast period (2025-2030).
The rising requirement of micronutrients to enhance the productivity may boost the growth of the market
- Micronutrient deficiency in soils is a widespread problem across the country. Some of the micronutrients are abundant on the earth's crust due to their immobile nature. They cause micronutrient deficiencies in crops.
- Copper is the common micronutrient fertilizer used in crop production in the country. It accounted for about 27.6% of the total micronutrient fertilizer market value in 2022. One of the micronutrients that plants require in small amounts is copper (Cu). It is necessary for photosynthesis, essential for plant respiration, and helps the plant metabolize proteins and carbohydrates. Copper enhances the color of vegetables as well as the color of flowers and plays a key role in protein formation.
- Most of the soils in China have an adequate amount of copper. However, in vegetable crops, the average copper nutrient application rate was 0.2% higher than the average copper application rate in field crops in 2022. Because copper is an immobile element in plants, symptoms of copper deficiency appear first in the plant's younger sections.
- Zinc is the most consumed micronutrient in the country, accounting for the second largest market share by the value of 25.49% in 2022. Zinc is needed in very small amounts by plants. The normal concentration of Zn in most plants is between 20 to 100 ppm. However, this small amount of Zn plays a key role in plants as an enzyme co-factor and a structural component in proteins.
- Due to factors like the requirement for increased productivity and output, as well as the necessity to maintain food and nutritional security for the area's constantly expanding population, the market may expand during 2023-2030 with a CAGR of 6.9%, and the emergence of advanced fertilizers may also contribute to micronutrient consumption.
China Micronutrient Fertilizer Market Trends
The expansion of the cultivation area is driven by increasing demand for food and the country's goal to achieve self-sufficiency in staple food
- China's cultivation area for field crops expanded marginally from 126.6 million ha in 2018 to 127.8 million ha in 2022, representing 70.8% of the total cultivated land. In 2022, Corn dominated the field crop landscape, commanding a 34.2% share, trailed by rice at 23.6% and wheat at 18.3%. This increase in cultivation area is poised to drive up fertilizer demand in the nation.
- China's field crop calendar revolves around two seasons: spring/summer (April-September) and winter. Spring crops encompass early corn, early rice, early wheat, and cotton, while winter crops center around winter wheat and rapeseed. Yet, it's rice and corn that take the spotlight, contributing to a third of China's grain output. As the world's leading rice producer, China dedicated 30 million hectares to rice farming in 2022, yielding a bountiful 210 million tons. Key rice-growing regions span Heilongjiang, Hunan, Jiangxi, Hubei, Jiangsu, Sichuan, Guangxi, Guangdong, and Yunan. Looking at corn, China was set to produce 277.2 million tons in 2022-2023, a 4.6 million ton surge from the previous year, buoyed by a robust harvest. The Northeast provinces of Heilongjiang, Jilin, and Inner Mongolia stand out as the corn powerhouses.
- While spring dominates China's cropping season, it grapples with heat spikes in June and July. Rice, a dietary staple for millions, bears the brunt. These scorching temperatures, coupled with meager rainfall, exacerbate mineral depletion in the soil, necessitating higher fertilizer application. Such arid conditions can also curtail crop yields.
In China, rapeseed or canola is applied with large amounts of micronutrients compared to other field crops
- Micronutrients play a vital role in crop nutrition and growth, and their deficiency significantly impacts yields. Field crops typically receive an average application rate of 5.2 kg/hectare for micronutrient fertilizers. Among these, manganese takes the lead, with an application rate of 9.8 kg/hectare in 2022, despite being the eleventh most abundant micronutrient in the earth's crust. However, when the soil pH reaches seven or higher, chemical and microbial oxidation occur, leading to the immobilization of plant-available Mn2+. This, in turn, triggers manganese deficiency in plants.
- Following manganese, copper took the market lead with an application rate of 7.3 kg/hectare, trailed by zinc at 4.1 kg/hectare, and iron at 3.3 kg/hectare in 2022.
- In China, rapeseed or canola stands out for its higher micronutrient application rates compared to other field crops. It receives an average of 10.79 kg/hectare of micronutrient fertilizers, given the significant impact of micronutrient deficiency on oil yield. Notably, foliar application of manganese and molybdenum has shown a 1% increase in oil content in the seeds.
- Micronutrient deficiencies in soil can arise from excessive phosphate fertilization and other natural factors. Phosphate, in particular, can limit the availability of iron, zinc, and copper to crops. In China, a strategy was adopted to enhance field crop yields by reducing phosphate fertilization while simultaneously increasing zinc fertilization.
- Optimally applying micronutrient fertilizers can enhance plant efficiency in absorbing primary nutrients from the soil, thereby reducing the overall fertilizer requirement in vegetable crops.
China Micronutrient Fertilizer Industry Overview
The China Micronutrient Fertilizer Market is fragmented, with the top five companies occupying 27.14%. The major players in this market are Coromandel International Ltd., Hebei Monband Water Soluble Fertilizer Co. Ltd, ICL Group Ltd, Sociedad Quimica y Minera de Chile SA and Yara International ASA (sorted alphabetically).
Additional Benefits:
- The market estimate (ME) sheet in Excel format
- 3 months of analyst support
TABLE OF CONTENTS
1 EXECUTIVE SUMMARY & KEY FINDINGS
2 REPORT OFFERS
3 INTRODUCTION
- 3.1 Study Assumptions & Market Definition
- 3.2 Scope of the Study
- 3.3 Research Methodology
4 KEY INDUSTRY TRENDS
- 4.1 Acreage Of Major Crop Types
- 4.1.1 Field Crops
- 4.1.2 Horticultural Crops
- 4.2 Average Nutrient Application Rates
- 4.2.1 Micronutrients
- 4.2.1.1 Field Crops
- 4.2.1.2 Horticultural Crops
- 4.2.1 Micronutrients
- 4.3 Agricultural Land Equipped For Irrigation
- 4.4 Regulatory Framework
- 4.5 Value Chain & Distribution Channel Analysis
5 MARKET SEGMENTATION (includes market size in Value in USD and Volume, Forecasts up to 2030 and analysis of growth prospects)
- 5.1 Product
- 5.1.1 Boron
- 5.1.2 Copper
- 5.1.3 Iron
- 5.1.4 Manganese
- 5.1.5 Molybdenum
- 5.1.6 Zinc
- 5.1.7 Others
- 5.2 Application Mode
- 5.2.1 Fertigation
- 5.2.2 Foliar
- 5.2.3 Soil
- 5.3 Crop Type
- 5.3.1 Field Crops
- 5.3.2 Horticultural Crops
- 5.3.3 Turf & Ornamental
6 COMPETITIVE LANDSCAPE
- 6.1 Key Strategic Moves
- 6.2 Market Share Analysis
- 6.3 Company Landscape
- 6.4 Company Profiles
- 6.4.1 Coromandel International Ltd.
- 6.4.2 Grupa Azoty S.A. (Compo Expert)
- 6.4.3 Haifa Group
- 6.4.4 Hebei Monband Water Soluble Fertilizer Co. Ltd
- 6.4.5 ICL Group Ltd
- 6.4.6 Sociedad Quimica y Minera de Chile SA
- 6.4.7 Yara International ASA
7 KEY STRATEGIC QUESTIONS FOR FERTILIZER CEOS
8 APPENDIX
- 8.1 Global Overview
- 8.1.1 Overview
- 8.1.2 Porter's Five Forces Framework
- 8.1.3 Global Value Chain Analysis
- 8.1.4 Market Dynamics (DROs)
- 8.2 Sources & References
- 8.3 List of Tables & Figures
- 8.4 Primary Insights
- 8.5 Data Pack
- 8.6 Glossary of Terms
 2026年全球微量元素肥料市场报告
 微量元素肥料市场报告:趋势、预测与竞争分析(至2031年)
 中东和非洲微量营养素肥料:市场占有率分析、行业趋势、统计数据、成长预测(2025-2030 年)亚太地区微量营养素肥料:市场占有率分析、产业趋势和成长预测(2025-2030 年)北美微量营养素肥料:市场占有率分析、行业趋势和成长预测(2025-2030 年)南美微量营养素肥料:市场占有率分析、行业趋势和成长预测(2025-2030 年)印度微量营养素肥料:市场占有率分析、行业趋势和统计数据、成长预测(2025-2030 年)微量营养素肥料:市场占有率分析、产业趋势与统计、成长预测(2025-2030 年)欧洲微量营养素肥料市场占有率分析、产业趋势与成长预测(2025-2030年)美国微量营养素肥料:市场占有率分析、行业趋势和统计数据、成长预测(2025-2030 年)