


 |
市场调查报告书
商品编码
1693534
亚太地区微量营养素肥料:市场占有率分析、产业趋势和成长预测(2025-2030 年)Asia-Pacific Micronutrient Fertilizer - Market Share Analysis, Industry Trends & Statistics, Growth Forecasts (2025 - 2030) |
||||||
※ 本网页内容可能与最新版本有所差异。详细情况请与我们联繫。
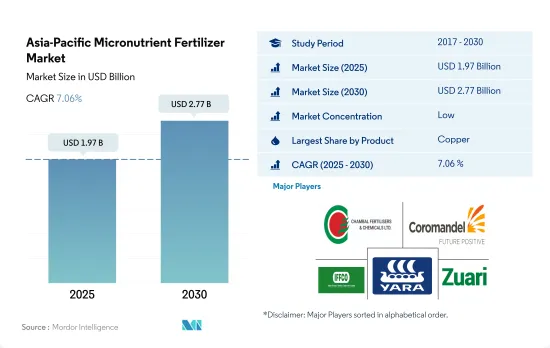
亚太地区微量营养素肥料市场规模预计在 2025 年为 19.7 亿美元,预计到 2030 年将达到 27.7 亿美元,预测期内(2025-2030 年)的复合年增长率为 7.06%。
人们对农业生产的认识和重视程度不断提高可能会推动该地区的市场发展。
- 硼是该地区消费量最大的微量营养素,2022 年的消费量份额为 26.5%。硼的消耗主要归因于该地区的土壤,土壤含水量低、氮含量高,限制了植物对硼的吸收,增加了硼微量营养素的可用性。
- 在亚太地区,锌的消费量市场占有率位居第二,占比为 26.2%,2022 年消费量为 159,100 吨。由于锌在植物生长发育中起着至关重要的作用,预计未来几年需求将继续增加。
- 2022年,铜将占亚太地区微量营养素市场的28.6%。它是一种重要的微量营养素,但所需的量很少。它在植物发育过程中的许多重要反应中起催化剂的作用,并在蛋白质的形成中起关键作用。
- 铁是该地区第三大微量营养素消费量国,占2022年所有微量营养素的20.8%。铁在植物生长发育中起着重要作用,因为它含有许多酶,并能作为叶绿素形成的催化剂。土壤缺铁现象的加剧预计将推动市场的成长。
- 因此,由于对更高产量和生产率的需求,以及农民对微量营养素在作物种植中的重要性的认识不断提高等因素,预计该地区的微量营养素市场在 2023 年至 2030 年期间的复合年增长率将达到 6.8%。
农民对营养缺乏和营养不良问题的认识不断提高,可能会推动市场
- 2022 年,印度和中国成为亚太地区微量营养素肥料市场的主导参与企业,分别占 41.7% 和 31.7% 的市场占有率。科学与环境中心 (CSE) 强调了印度土壤的缺陷,并发现硼、铁和锌最为突出,分别占 47%、37% 和 39%。儘管印度缺乏优质的铜和锰,但这使其成为该地区的主要市场。
- 中国政府意识到过量使用化学肥料的严重性,推出了「化肥使用量零成长行动计画」。该法规不鼓励使用含有微量营养素变异体的肥料。因此,微量营养素的成长率,尤其是农田作物领域的成长率保持在 3.8% 的温和水平。
- 研究一直强调韩国、马来西亚和台湾等国家普遍存在硼缺乏现象。这种缺陷在火山、酸性和石灰性土壤中尤其明显,对花生、大豆、木瓜和柑橘类水果等作物造成严重影响。因此,硼微量营养素肥料市场正在蓬勃发展。
- 亚太食品与肥料技术中心研究发现,叶面喷布0.5%硫酸亚铁、0.1%硫酸锰、0.1%硫酸铜等微量元素肥,可有效缓解作物缺素症状。
- 由于迫切需要确保粮食安全,预计2023年至2030年间亚太地区对微量营养素肥料的需求将以6.8%的复合年增长率强劲增长。
亚太地区微量营养素肥料市场趋势
随着主要作物种植面积大幅扩大,肥料市场预计将成长
- 在亚太地区,田间作物占耕地总面积的95%以上。水稻、小麦和玉米是该地区的主要田间作物,占2022年总耕地面积的38%左右。预计耕地面积的增加将增加该国对化肥的需求。
- 亚太地区包括中国、印度、巴基斯坦和澳大利亚,是世界上最大的小麦生产区之一。中国和印度分别是世界上最大的小麦生产国和消费国。小麦是该地区的主要主食之一,推动了需求和消费的成长。其中,2018年至2022年,小麦种植面积将增加63.86万公顷。 2022年,中国小麦产量为1.38亿吨,成为全球最大小麦生产国,印度小麦产量为1.03亿吨。
- 水稻是该地区最大的田间作物。到2022年,光是耕地面积就将占到农业用地总面积的约16.44%。水稻是亚洲和太平洋大部分地区的主食。预计2022年中国米产量为1.47亿吨,印度米产量为1.24亿吨。印度的消费量预计将达到 1.09 亿吨,出口量将达到 1,950 万吨,位居世界第一。
- 国内外对田间作物的需求迅速增长,促进了田间作物面积的扩大。预计耕地面积的大幅增加将在2023年至2030年期间对亚太地区化肥市场产生直接正面的影响。
2022 年油菜籽/油菜籽的平均养分施用量最高,达 9.2 公斤/公顷。
- 近年来,由于产量作物养分流失速度加快,对微量营养素的需求不断增长。微量营养素缺乏症在亚太地区普遍存在,该地区是受此类缺乏症影响的主要地区之一。锌、锰和铜是主要施用于田间作物的养分类型,预计到2022年将分别占12公斤/公顷、9.1公斤/公顷和7.2公斤/公顷。
- 新兴国家的农业相关人员对使用微量营养素肥料的好处缺乏认识,以及购买这些肥料的成本高昂,是限制该地区微量营养素肥料增长的因素。
- 依作物类型划分,2022 年平均养分施用量最高的是油菜籽/油菜籽,为 9.2 公斤/公顷,其次是玉米/玉米,为 6.7 公斤/公顷,水稻为 5.4 公斤/公顷。特定微量营养素的影响因作物和地区而异。例如,小麦主要缺乏的微量营养素是铜和锰。中国、印度和日本等国的小麦都被发现缺乏硼和钼。同样,油菜籽/油菜籽主要缺乏的是锌、锰和铜。
- 近年来,随着农民希望从每公顷种植面积中获得更多产量,微量营养素在作物生产中的受欢迎程度迅速增长。微量营养素缺乏程度高以及对作物的需求不断增加,导致农民采用更多的微量营养素来改善土壤健康并提高作物产量。
亚太地区微量营养素肥料产业概况
亚太地区微量营养素肥料市场细分化,前五大公司占28.85%。该市场的主要企业有 Chambal Fertilizers & Chemicals Ltd、Coromandel International Ltd.、Indian Farmers Fertiliser Cooperative Limited、Yara International ASA、Zuari Agro Chemicals Ltd 等。
其他福利
- Excel 格式的市场预测 (ME) 表
- 3个月的分析师支持
目录
第一章执行摘要和主要发现
第二章 报告要约
第三章 引言
- 研究假设和市场定义
- 研究范围
- 调查方法
第四章 产业主要趋势
- 主要作物种植面积
- 田间作物
- 园艺作物
- 平均养分施用量
- 微量营养素
- 田间作物
- 园艺作物
- 微量营养素
- 灌溉农田
- 法律规范
- 价值炼和通路分析
第五章市场区隔
- 产品
- 硼
- 铜
- 铁
- 锰
- 钼
- 锌
- 其他的
- 如何申请
- 受精
- 叶面喷布
- 土壤
- 作物类型
- 田间作物
- 园艺作物
- 草坪和观赏植物
- 原产地
- 澳洲
- 孟加拉
- 中国
- 印度
- 印尼
- 日本
- 巴基斯坦
- 菲律宾
- 泰国
- 越南
- 其他亚太地区
第六章竞争格局
- 关键策略趋势
- 市场占有率分析
- 商业状况
- 公司简介
- Chambal Fertilizers & Chemicals Ltd
- Coromandel International Ltd.
- Grupa Azoty SA(Compo Expert)
- Haifa Group
- ICL Group Ltd
- Indian Farmers Fertiliser Cooperative Limited
- Yara International ASA
- Zuari Agro Chemicals Ltd
第七章 CEO 的关键策略问题
第 8 章 附录
- 世界概况
- 概述
- 五力分析框架
- 全球价值链分析
- 市场动态(DRO)
- 资讯来源及延伸阅读
- 图片列表
- 关键见解
- 数据包
- 词彙表
The Asia-Pacific Micronutrient Fertilizer Market size is estimated at 1.97 billion USD in 2025, and is expected to reach 2.77 billion USD by 2030, growing at a CAGR of 7.06% during the forecast period (2025-2030).
Growing awareness and their importance in the agriculture production may drive the market in the region
- Boron was the most consumed micronutrient in the region, with a consumption volume share of 26.5% in 2022. The majority of boron consumption is attributed to the region's soils, which have reduced water content and higher nitrogen levels that limit boron uptake by plants, leading to increased utilization of boron micronutrients.
- In Asia-Pacific, zinc held the second-largest market share in terms of consumption, with a share of 26.2% and a volume of 159.1 thousand metric tons in 2022. The demand for zinc is anticipated to continue rising in the coming years due to its vital role in the growth and development of plants.
- Copper accounted for 28.6% of the Asia-Pacific micronutrient market's value in the region in 2022. It is an important micronutrient needed in small quantities. It acts as a catalyst in many important plant reactions during growth and plays a key role in protein formation.
- Iron was the third most-consumed micronutrient fertilizer in the region, accounting for a 20.8% share among all micronutrients in 2022. Iron plays an important role in a plant's growth and development as it contains many enzymes and acts as a catalyst in chlorophyll formation. The growing iron deficiency in the soil is expected to fuel the growth of the market.
- Hence, owing to factors like the need for higher yield and productivity and the growing knowledge among farmers about their importance in crop cultivation, the market for micronutrients in the region is anticipated to grow between 2023 and 2030 with a value CAGR of 6.8%.
Nutrient deficiencies and growing awareness among farmers regarding malnutrition problems may drive the market
- In 2022, India and China emerged as the dominant players in the Asia-Pacific micronutrient fertilizer market, capturing 41.7% and 31.7% of the market share, respectively. The Centre for Science and Environment (CSE) highlighted India's soil deficiencies, with boron, iron, and zinc being the most prominent, at 47%, 37%, and 39% respectively. This makes India the leading market in the region, although it fares better in terms of copper and manganese deficiencies.
- Recognizing the gravity of fertilizer overuse, the Chinese government introduced the "Action Plan for the Zero Increase of Fertilizer Use." This regulation has curtailed the usage of fertilizers, including micronutrient variants. Consequently, the growth rate of micronutrients, especially in the field crops segment, has been limited to a modest CAGR of 3.8%.
- Studies have consistently highlighted the prevalence of boron deficiency in countries like Korea, Malaysia, and Taiwan. This deficiency is particularly pronounced in volcanic, acidic, and calcareous soils, significantly impacting crops like peanuts, soybeans, papaya, and citrus. As a result, the market for boron micronutrient fertilizers has witnessed a surge.
- The Food and Fertilizer Technology Centre for the Asian and Pacific Region has observed that applying micronutrients through the foliar mode, such as 0.5% iron sulfate, manganese sulfate, and 0.1% copper sulfate, at the recommended dosages, effectively mitigates crop deficiency symptoms.
- Given the imperative of ensuring food security, the demand for micronutrient fertilizers in Asia-Pacific is projected to register a robust CAGR of 6.8% during 2023-2030.
Asia-Pacific Micronutrient Fertilizer Market Trends
The significant expansion in the cultivation of major growing crops is anticipated to boost the growth of the fertilizers market
- Field crop cultivation dominates the Asia-Pacific region, accounting for more than 95% of the total crop area. Rice, wheat, and corn are the major field crops produced in the region, together accounting for about 38% of the total crop area in 2022. The rising area under cultivation is expected to increase the need for fertilizer usage in the country.
- The Asia-Pacific region, which include China, India, Pakistan, and Australia, is among the world's largest wheat producers. China and India are also the world's largest wheat producers and consumers. Wheat is one of the major staple foods of this region, driving the increase increase in demand and consumption. Notably, the area under wheat cultivation increased by 638.6 thousand ha from 2018 to 2022. In 2022, China accounted for the production of 138 million metric tons of wheat, making it the largest wheat producer in the world, and India recorded wheat production of 103 million metric tons.
- Rice is the largest cultivated field crop in the region. Its cultivation alone accounted for about 16.44% of the total agricultural land in 2022. Rice is the staple food of Asia and most parts of the Pacific region. China was projected to produce 147 million tons of rice, and India was expected to harvest 124 million tons of rice in 2022. India was also expected to consume 109 million tons while exporting a world-leading 19.5 million tons.
- The surge in both domestic and international demand for field crops has prompted an expansion in the cultivation area dedicated to these crops. This significant increase in cultivated land is expected to have a direct and positive impact on the Asia-Pacific fertilizer market throughout the 2023-2030 period.
Rapeseed/canola accounted for the highest average nutrient application rate of 9.2 kg/hectare in 2022
- The demand for micronutrients has grown in recent years due to the accelerated rates of nutrient removal in high-yielding crops. Micronutrient deficiency is widespread in Asia-Pacific, which is one of the major regions affected by this deficiency. Zinc, manganese, and copper are estimated to be the major types of nutrients applied largely for field crops, accounting for 12 kg/hectare, 9.1 kg/hectare, and 7.2 kg/hectare, respectively, in 2022.
- The lack of awareness about the benefits of using micronutrient fertilizers among the farming community in developing countries and the high cost associated with the purchase of these fertilizers are some of the factors limiting the growth of micronutrient fertilizers in the region.
- By crop type, rapeseed/canola accounted for the highest average nutrient application rate of 9.2 kg/hectare in 2022, followed by corn/maize and rice, accounting for 6.7 kg/hectare and 5.4 kg/hectare, respectively. The impact of specific micronutrients differs among crops and across the region. For instance, in the case of wheat, the major micronutrient deficiencies are copper and manganese. In countries like China, India, and Japan, boron and molybdenum are identified as deficient in wheat. Similarly, in rapeseed/canola, the major deficiencies are zinc, manganese, and copper.
- As farmers aim to get more out of every planted hectare, the popularity of micronutrients in the production of crops has increased rapidly in the recent past. High micronutrient deficiency and increasing demand for crops have encouraged farmers to adopt more micronutrients to increase soil health and enhance crop productivity.
Asia-Pacific Micronutrient Fertilizer Industry Overview
The Asia-Pacific Micronutrient Fertilizer Market is fragmented, with the top five companies occupying 28.85%. The major players in this market are Chambal Fertilizers & Chemicals Ltd, Coromandel International Ltd., Indian Farmers Fertiliser Cooperative Limited, Yara International ASA and Zuari Agro Chemicals Ltd (sorted alphabetically).
Additional Benefits:
- The market estimate (ME) sheet in Excel format
- 3 months of analyst support
TABLE OF CONTENTS
1 EXECUTIVE SUMMARY & KEY FINDINGS
2 REPORT OFFERS
3 INTRODUCTION
- 3.1 Study Assumptions & Market Definition
- 3.2 Scope of the Study
- 3.3 Research Methodology
4 KEY INDUSTRY TRENDS
- 4.1 Acreage Of Major Crop Types
- 4.1.1 Field Crops
- 4.1.2 Horticultural Crops
- 4.2 Average Nutrient Application Rates
- 4.2.1 Micronutrients
- 4.2.1.1 Field Crops
- 4.2.1.2 Horticultural Crops
- 4.2.1 Micronutrients
- 4.3 Agricultural Land Equipped For Irrigation
- 4.4 Regulatory Framework
- 4.5 Value Chain & Distribution Channel Analysis
5 MARKET SEGMENTATION (includes market size in Value in USD and Volume, Forecasts up to 2030 and analysis of growth prospects)
- 5.1 Product
- 5.1.1 Boron
- 5.1.2 Copper
- 5.1.3 Iron
- 5.1.4 Manganese
- 5.1.5 Molybdenum
- 5.1.6 Zinc
- 5.1.7 Others
- 5.2 Application Mode
- 5.2.1 Fertigation
- 5.2.2 Foliar
- 5.2.3 Soil
- 5.3 Crop Type
- 5.3.1 Field Crops
- 5.3.2 Horticultural Crops
- 5.3.3 Turf & Ornamental
- 5.4 Country
- 5.4.1 Australia
- 5.4.2 Bangladesh
- 5.4.3 China
- 5.4.4 India
- 5.4.5 Indonesia
- 5.4.6 Japan
- 5.4.7 Pakistan
- 5.4.8 Philippines
- 5.4.9 Thailand
- 5.4.10 Vietnam
- 5.4.11 Rest of Asia-Pacific
6 COMPETITIVE LANDSCAPE
- 6.1 Key Strategic Moves
- 6.2 Market Share Analysis
- 6.3 Company Landscape
- 6.4 Company Profiles
- 6.4.1 Chambal Fertilizers & Chemicals Ltd
- 6.4.2 Coromandel International Ltd.
- 6.4.3 Grupa Azoty S.A. (Compo Expert)
- 6.4.4 Haifa Group
- 6.4.5 ICL Group Ltd
- 6.4.6 Indian Farmers Fertiliser Cooperative Limited
- 6.4.7 Yara International ASA
- 6.4.8 Zuari Agro Chemicals Ltd
7 KEY STRATEGIC QUESTIONS FOR FERTILIZER CEOS
8 APPENDIX
- 8.1 Global Overview
- 8.1.1 Overview
- 8.1.2 Porter's Five Forces Framework
- 8.1.3 Global Value Chain Analysis
- 8.1.4 Market Dynamics (DROs)
- 8.2 Sources & References
- 8.3 List of Tables & Figures
- 8.4 Primary Insights
- 8.5 Data Pack
- 8.6 Glossary of Terms
 2026年全球微量元素肥料市场报告
 微量元素肥料市场报告:趋势、预测与竞争分析(至2031年)
 中东和非洲微量营养素肥料:市场占有率分析、行业趋势、统计数据、成长预测(2025-2030 年)中国微量营养素肥料市场占有率分析、产业趋势与统计、成长预测(2025-2030年)北美微量营养素肥料:市场占有率分析、行业趋势和成长预测(2025-2030 年)南美微量营养素肥料:市场占有率分析、行业趋势和成长预测(2025-2030 年)印度微量营养素肥料:市场占有率分析、行业趋势和统计数据、成长预测(2025-2030 年)微量营养素肥料:市场占有率分析、产业趋势与统计、成长预测(2025-2030 年)欧洲微量营养素肥料市场占有率分析、产业趋势与成长预测(2025-2030年)美国微量营养素肥料:市场占有率分析、行业趋势和统计数据、成长预测(2025-2030 年)