


 |
市场调查报告书
商品编码
1693530
欧洲微量营养素肥料市场占有率分析、产业趋势与成长预测(2025-2030年)Europe Micronutrient Fertilizer - Market Share Analysis, Industry Trends & Statistics, Growth Forecasts (2025 - 2030) |
||||||
※ 本网页内容可能与最新版本有所差异。详细情况请与我们联繫。
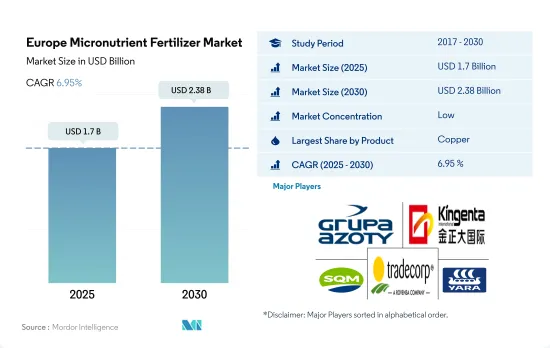
欧洲微量营养素肥料市场规模预计在 2025 年为 17 亿美元,预计到 2030 年将达到 23.8 亿美元,预测期内(2025-2030 年)的复合年增长率为 6.95%。
锌在该地区微量营养素肥料市场占据主导地位
- 俄罗斯在欧洲微量营养素肥料领域占据主导地位,占欧洲微量营养素肥料市场的24.2%。此外,预计 2023 年至 2030 年间复合年增长率将达到 7.0%。
- 从形式来看,特种微量营养素市场将在2022年达到最大份额,占市场份额的62.6%,其中87.0%主要用于田间作物。随着科技的不断进步,专用肥料的使用主要用于田间作物。常规肥料微量营养素市场占37.3%,田间作物占88.8%。
- 根据营养类型,锌在该地区微量营养素肥料市场中占据主导地位,占2022年市场价值的29.2%。锌是植物酵素系统的关键组成部分。锌有助于活化各种酶,促进碳水化合物代谢,其次是铜(26.4%)和钼(15.7%)。叶面喷布微量营养素肥料是该地区的主流,占2022年市值的65.0%,其次是施肥,占34.9%。
- 植物和土壤中的微量营养素缺乏现象正在稳步增加,并成为欧盟的焦点。预计在 2023-2030 年期间,土壤健康状况恶化、高价值作物种植面积稳步增加、对更高生产率的需求、对先进肥料的认识不断提高及其采用率不断提高等因素将推动区域微量营养素肥料市场的发展。
法国是欧洲最大的微量营养素肥料市场。
- 2022 年,法国在欧洲微量营养素肥料市场占据首位,占 14.1% 的显着价值份额,相当于 2.184 亿美元。法国农民越来越意识到土壤中微量营养素缺乏的重要性,导致对微量营养素肥料的需求激增。
- 俄罗斯已成为欧洲领先的微量营养素肥料市场,2022 年的市场占有率为 1.493 亿美元,占 9.6%。在微量营养素中,锌基肥料占据俄罗斯市场的主导地位,占总量的28.2%。
- 乌克兰占欧洲微量营养素肥料市场的13.8%,2022年市场规模为2.141亿美元。同年该国微量营养素肥料消费量为61,200吨。值得注意的是,儘管面临新冠疫情的挑战,乌克兰市场仍维持持续成长。
- 欧洲微量营养素肥料的消费可能会面临热浪和持续的能源危机的阻力。然而,随着农民对先进技术和肥料(尤其是专用微量营养素)的接受度不断提高,市场也有望持续成长。
- 预计欧洲微量营养素肥料市场将受到土壤健康恶化、高价值作物种植扩张、追求提高生产力和增加肥料供应等因素的推动。
欧洲微量营养素肥料市场趋势
田间作物的种植面积一直在稳步增加,以满足国内和出口的需求。
- 在欧洲,油菜、小麦、黑麦、小黑小麦等田间作物是主要的冬季作物,而玉米、向日葵、水稻和大豆则是夏季作物。大麦有冬季和春季两种品种,分布广泛。欧洲主粮作物的种植面积一直在稳定增加,主要原因是人口成长和粮食需求增加。 2017年田间作物将达78,500公顷,2022年将增加至108,000公顷。
- 2022年欧盟普通小麦产量预估为2.827亿吨,相当于谷物总产量的54.0%。这比2020年增加了1,100万吨,成长了9.3%。这一增长反映了收穫面积的增加(增长 5.6%,达到 2,180 万公顷)以及表观产量的提高。
- 2019年至2022年,该地区的收穫面积减少了34%。儘管整体种植面积下降,但玉米种植面积增加了 11%,小麦种植面积增加了 2%,而同期其他田间作物的种植面积则减少。 2023年至2030年间,预计农民将增加化肥使用量,以提高产量并减轻近年来收穫面积整体下降的影响。
- 因此,农民面临越来越大的压力,需要提高产量和作物产量以满足日益增长的需求,而且随着田间作物总种植面积的增加,预计肥料市场将在 2023 年至 2030 年间大幅增长。
锌是该地区使用最广泛的微量营养素肥料。
- 欧洲土壤微量营养素缺乏症是由于淋溶流失、过多降雨和土壤剖面较浅等因素造成的。 2022年,欧洲田间作物微量营养素的平均施用率为3.85公斤/公顷。 2022年,锌、铜、铁、锰、硼将占最大的市场规模,份额分别为38.28%、25.09%、13.68%、11.68%、4.168%、0.021%。锰的平均施用量为9.33公斤/公顷,占该地区微量营养素肥料总消费量的11.68%。锰缺乏严重阻碍了大豆、小麦、甘蔗和玉米等主要田间作物的生产。
- 在作物中,小麦、高粱、大豆和棉花是微量营养素肥料的主要消耗作物,玉米和水稻比例较小。 2022年,小麦位居榜首,消耗锰11.54公斤/公顷,锌5.87公斤/公顷,铜6.60公斤/公顷。锌成为该地区使用最广泛的微量营养素肥料,占2022年总消费量的38.28%,平均施用率为5.72公斤/公顷。其次是铜、铁和硼,平均施用量分别为6.31公斤/公顷、3.70公斤/公顷和1.50公斤/公顷。
- 微量营养素在为作物提供均衡营养方面发挥重要作用,其缺乏会影响作物的生长。因此,欧洲微量营养素肥料市场正在成长,这在很大程度上是由于土壤中微量营养素缺乏现象的日益普遍。
欧洲微量营养素肥料产业概况
欧洲微量营养素肥料市场细分,前五大公司占21.44%。市场的主要企业包括 Grupa Azoty SA(Compo Expert)、Kingenta Ecoological Engineering Group、Sociedad Quimica y Minera de Chile SA、Trade Corporation International 和 Yara International ASA。
其他福利
- Excel 格式的市场预测 (ME) 表
- 3个月的分析师支持
目录
第一章执行摘要和主要发现
第二章 报告要约
第三章 引言
- 研究假设和市场定义
- 研究范围
- 调查方法
第四章 产业主要趋势
- 主要作物种植面积
- 田间作物
- 园艺作物
- 平均养分施用量
- 微量营养素
- 田间作物
- 园艺作物
- 微量营养素
- 灌溉农田
- 法律规范
- 价值炼和通路分析
第五章市场区隔
- 产品
- 硼
- 铜
- 铁
- 锰
- 钼
- 锌
- 其他的
- 如何申请
- 受精
- 叶面喷布
- 土壤
- 作物类型
- 田间作物
- 园艺作物
- 草坪和观赏植物
- 原产地
- 法国
- 德国
- 义大利
- 荷兰
- 俄罗斯
- 西班牙
- 乌克兰
- 英国
- 其他欧洲国家
第六章 竞争格局
- 关键策略趋势
- 市场占有率分析
- 商业状况
- 公司简介
- AGLUKON Spezialduenger GmbH & Co.
- Fertiberia
- Grupa Azoty SA(Compo Expert)
- Haifa Group
- Kingenta Ecological Engineering Group Co., Ltd.
- Sociedad Quimica y Minera de Chile SA
- Trade Corporation International
- Valagro
- Verdesian Life Sciences
- Yara International ASA
第七章:CEO面临的关键策略问题
第 8 章 附录
- 世界概况
- 概述
- 五力分析框架
- 全球价值链分析
- 市场动态(DRO)
- 资讯来源及延伸阅读
- 图片列表
- 关键见解
- 数据包
- 词彙表
The Europe Micronutrient Fertilizer Market size is estimated at 1.7 billion USD in 2025, and is expected to reach 2.38 billion USD by 2030, growing at a CAGR of 6.95% during the forecast period (2025-2030).
Zinc dominates the micronutrient fertilizers market in the region
- In Europe, Russia accounted for the majority of micronutrient fertilizers, holding 24.2% of the value of Europe's micronutrient fertilizer market. Moreover, it is anticipated to register a CAGR of 7.0% between 2023 and 2030.
- By form, the specialty type micronutrient market was the largest in 2022, accounting for 62.6% of the market value, and was majorly applied to field crops at 87.0%. With increased technological and scientific advancements, specialty fertilizer applications are primarily used for field crops. The conventional type fertilizer micronutrient market accounted for 37.3%, and this fertilizer application was majorly applied to field crops at 88.8%.
- By nutrient type, zinc dominated the micronutrient fertilizers market in the region, accounting for 29.2% of the market value in 2022. Zinc is a major component of plant enzyme systems. Zinc aids in the activation of various types of enzymes, boosting carbohydrate metabolism, followed by copper at 26.4%, and molybdenum accounting for 15.7%. Micronutrient fertilizers are mostly applied through foliar application in the region, accounting for 65.0% of the market value in 2022, followed by fertigation at 34.9%.
- Micronutrient deficiency in plants and soil has been steadily increasing and has become a major cause of concern in the European Union. Factors such as depleting soil health, steadily increasing area under high-value crops, the requirement for higher productivity, and improved awareness about advanced fertilizers and their increasing adoption are expected to drive the regional market for micronutrient fertilizers between 2023 and 2030.
France is the largest micronutrient fertilizer market in the European region.
- In 2022, France held the top spot in the Europe's micronutrient fertilizer market, commanding a significant 14.1% value share, equivalent to USD 218.4 million. French farmers are increasingly recognizing the significance of micronutrient deficiencies in their soils, leading to a surge in demand for these fertilizers.
- Russia emerged as the leading micronutrient fertilizer market in Europe, capturing a market share of 9.6% and a value of USD 149.3 million in 2022. Among the micronutrients, zinc-based fertilizers dominated the Russian market, comprising 28.2% of the total volume.
- Ukraine accounted for 13.8% of the European micronutrient fertilizer market, valued at USD 214.1 million in 2022. The country consumed 61.2 thousand metric tons of these fertilizers in the same year. Notably, the Ukrainian market has exhibited consistent growth, even amidst the challenges posed by the COVID-19 pandemic.
- Europe's micronutrient fertilizer consumption might face headwinds from heatwaves and an ongoing energy crisis. However, the market is poised for growth, driven by farmers' increasing embrace of advanced technologies and fertilizers, particularly specialty micronutrient variants.
- The European micronutrient fertilizer market is set to be propelled by factors such as deteriorating soil health, expanding cultivation of high-value crops, the pursuit of enhanced productivity, and the growing availability of fertilizers.
Europe Micronutrient Fertilizer Market Trends
The cultivation area of field crops is steadily rising to meet domestic needs and export demand
- Field crops, such as rapeseed, wheat, rye, and triticale, are the main winter crops in Europe, while maize, sunflowers, rice, and soybean are summer crops. Both winter and spring types of barley are widely available. The area harvested under major food crops in Europe has been steadily increasing, primarily due to the growing population and increasing demand for food grains. Field crops accounted for 78.5 thousand ha in 2017, which increased to 108 thousand ha in 2022.
- The European Union harvested 282.7 million tons of common wheat in 2022, the equivalent of 54.0% of all cereal grains harvested. This was 11.0 million tons more than in 2020, an increase of 9.3%. This upturn reflected a rise in the area harvested (up 5.6% to 21.8 million hectares) and improved apparent yields.
- Between 2019 and 2022, there was a notable 34% decline in the harvested area within the region. Despite this overall reduction, the areas dedicated to corn/maize and wheat cultivation experienced increases of 11% and 2%, respectively, while the acreages for other field crops decreased during the same period. It is anticipated that farmers will augment their fertilizer usage during the 2023-2030 period, aiming to enhance yields and mitigate the impact of the overall decrease in harvested areas observed in recent years.
- Therefore, with rising pressure on farmers to improve yield and grain production to meet the growing demand and with the overall field crop cultivation area increasing, the fertilizer market is expected to grow significantly during the 2023-2030.
Zinc has become the most used micronutrient fertilizer in the region
- Micronutrient deficiencies in European soils stem from factors such as leaching losses, excessive rainfall, and shallow soil profiles. In 2022, the average application of micronutrients for field crops in Europe stood at 3.85 kg/hectare. In 2022, zinc, copper, iron, manganese, and boron commanded the highest market values, with shares of 38.28%, 25.09%, 13.68%, 11.68%, 4.168%, and 0.021%, respectively. Manganese, with an average application rate of 9.33 kg/ha, led the pack, accounting for 11.68% of the total micronutrient fertilizer consumption in the region. Its scarcity severely hampers the production of key field crops like soy, wheat, sugarcane, and maize.
- Among the crops, wheat, sorghum, soybean, and cotton were the major consumers of micronutrient fertilizers, while corn and rice had a smaller share. In 2022, wheat topped the charts, consuming 11.54 kg/ha of manganese, 5.87 kg/ha of zinc, and 6.60 kg/ha of copper. Zinc emerged as the most widely used micronutrient fertilizer in the region, accounting for 38.28% of the total consumption in 2022, with an average application rate of 5.72 kg/ha. Copper, iron, and boron followed with average application rates of 6.31, 3.70, and 1.50 kg/ha, respectively.
- Micronutrients play a crucial role in providing balanced nutrition to crops, and their deficiency can hinder crop growth. As a result, the market for micronutrient fertilizers in Europe is witnessing growth, significantly fueled by the escalating prevalence of soil micronutrient deficiencies.
Europe Micronutrient Fertilizer Industry Overview
The Europe Micronutrient Fertilizer Market is fragmented, with the top five companies occupying 21.44%. The major players in this market are Grupa Azoty S.A. (Compo Expert), Kingenta Ecological Engineering Group Co., Ltd., Sociedad Quimica y Minera de Chile SA, Trade Corporation International and Yara International ASA (sorted alphabetically).
Additional Benefits:
- The market estimate (ME) sheet in Excel format
- 3 months of analyst support
TABLE OF CONTENTS
1 EXECUTIVE SUMMARY & KEY FINDINGS
2 REPORT OFFERS
3 INTRODUCTION
- 3.1 Study Assumptions & Market Definition
- 3.2 Scope of the Study
- 3.3 Research Methodology
4 KEY INDUSTRY TRENDS
- 4.1 Acreage Of Major Crop Types
- 4.1.1 Field Crops
- 4.1.2 Horticultural Crops
- 4.2 Average Nutrient Application Rates
- 4.2.1 Micronutrients
- 4.2.1.1 Field Crops
- 4.2.1.2 Horticultural Crops
- 4.2.1 Micronutrients
- 4.3 Agricultural Land Equipped For Irrigation
- 4.4 Regulatory Framework
- 4.5 Value Chain & Distribution Channel Analysis
5 MARKET SEGMENTATION (includes market size in Value in USD and Volume, Forecasts up to 2030 and analysis of growth prospects)
- 5.1 Product
- 5.1.1 Boron
- 5.1.2 Copper
- 5.1.3 Iron
- 5.1.4 Manganese
- 5.1.5 Molybdenum
- 5.1.6 Zinc
- 5.1.7 Others
- 5.2 Application Mode
- 5.2.1 Fertigation
- 5.2.2 Foliar
- 5.2.3 Soil
- 5.3 Crop Type
- 5.3.1 Field Crops
- 5.3.2 Horticultural Crops
- 5.3.3 Turf & Ornamental
- 5.4 Country
- 5.4.1 France
- 5.4.2 Germany
- 5.4.3 Italy
- 5.4.4 Netherlands
- 5.4.5 Russia
- 5.4.6 Spain
- 5.4.7 Ukraine
- 5.4.8 United Kingdom
- 5.4.9 Rest of Europe
6 COMPETITIVE LANDSCAPE
- 6.1 Key Strategic Moves
- 6.2 Market Share Analysis
- 6.3 Company Landscape
- 6.4 Company Profiles
- 6.4.1 AGLUKON Spezialduenger GmbH & Co.
- 6.4.2 Fertiberia
- 6.4.3 Grupa Azoty S.A. (Compo Expert)
- 6.4.4 Haifa Group
- 6.4.5 Kingenta Ecological Engineering Group Co., Ltd.
- 6.4.6 Sociedad Quimica y Minera de Chile SA
- 6.4.7 Trade Corporation International
- 6.4.8 Valagro
- 6.4.9 Verdesian Life Sciences
- 6.4.10 Yara International ASA
7 KEY STRATEGIC QUESTIONS FOR FERTILIZER CEOS
8 APPENDIX
- 8.1 Global Overview
- 8.1.1 Overview
- 8.1.2 Porter's Five Forces Framework
- 8.1.3 Global Value Chain Analysis
- 8.1.4 Market Dynamics (DROs)
- 8.2 Sources & References
- 8.3 List of Tables & Figures
- 8.4 Primary Insights
- 8.5 Data Pack
- 8.6 Glossary of Terms
 2026年全球微量元素肥料市场报告
 微量元素肥料市场报告:趋势、预测与竞争分析(至2031年)
 中东和非洲微量营养素肥料:市场占有率分析、行业趋势、统计数据、成长预测(2025-2030 年)中国微量营养素肥料市场占有率分析、产业趋势与统计、成长预测(2025-2030年)亚太地区微量营养素肥料:市场占有率分析、产业趋势和成长预测(2025-2030 年)北美微量营养素肥料:市场占有率分析、行业趋势和成长预测(2025-2030 年)南美微量营养素肥料:市场占有率分析、行业趋势和成长预测(2025-2030 年)印度微量营养素肥料:市场占有率分析、行业趋势和统计数据、成长预测(2025-2030 年)微量营养素肥料:市场占有率分析、产业趋势与统计、成长预测(2025-2030 年)美国微量营养素肥料:市场占有率分析、行业趋势和统计数据、成长预测(2025-2030 年)