


 |
市场调查报告书
商品编码
1907302
印尼货运与物流:市场占有率分析、产业趋势、统计及成长预测(2026-2031)Indonesia Freight And Logistics - Market Share Analysis, Industry Trends & Statistics, Growth Forecasts (2026 - 2031) |
||||||
※ 本网页内容可能与最新版本有所差异。详细情况请与我们联繫。
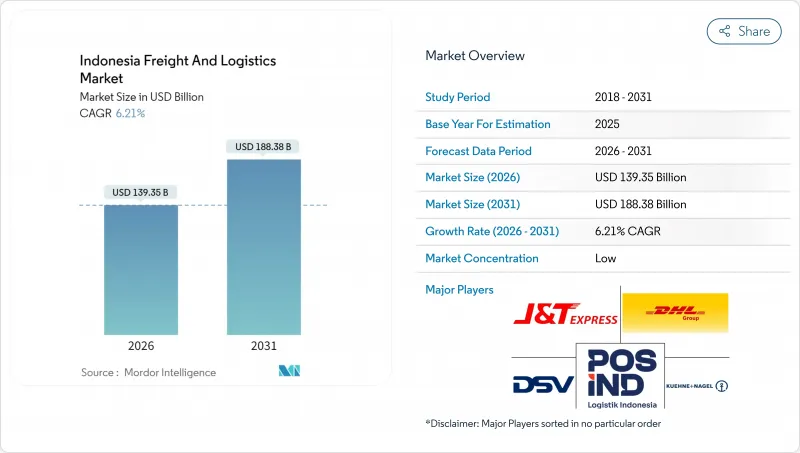
预计到 2026 年,印尼的货物和物流市场规模将达到 1,393.5 亿美元。
这意味着从 2025 年的 1,312 亿美元成长到 2031 年的 1,883.8 亿美元,2026 年至 2031 年的年复合成长率(CAGR)为 6.21%。
印尼电子商务的快速成长、2700公里新建收费公路的建设以及出口导向製造业产出的成长,都在推动该国的经济成长。同时,大型企划正将业务范围扩展到爪哇岛以外的地区。对国家物流生态系统(NLE)等数位化平台的投资,正在缩短清关时间、降低行政成本,进而提升印尼货运和物流市场的结构性效率。此外,低温运输设施的扩建、航空货运能力的提升以及多模态网路的升级,也为营运商提供了差异化服务的途径。在竞争激烈的市场环境中,那些能够利用数据驱动的路线优化和即时视觉化工具来应对严重的都市区拥堵、燃油价格波动以及法规重迭等挑战的技术型供应商更胜一筹。
印尼货运及物流市场趋势及洞察
电子商务的快速发展和小包裹运输量的快速增长
快速的数位化正推动线上零售交易以每年15%的速度成长,直至2025年,这将为最后一公里配送网路带来前所未有的小小包裹量。 J&T Express和JNE等小包裹递送(CEP)专家正在扩展其自动化枢纽和收货点生态系统,以有效处理这一物流流量。虽然订单主要集中在爪哇岛人口稠密的大都会区,但随着数位支付的普及,区域性城市的订单量也出现了两位数的增长。在雅加达都市区,道路拥塞限制了平均配送速度,仅为10-15公里/小时,从而增加了单位成本。这促使营运商向微型仓配、摩托车配送网路和人工智慧驱动的路线规划转型。拥有详细地址资料库和动态路线规划能力的营运商享有成本优势,而传统的货运代理商则正努力改造其大批量货运处理流程,以适应消费者的配送需求。
大型企划基础建设项目(收费公路、港口、机场)
国家战略计划计划已投资4000亿美元用于公路、港口和机场建设,使爪哇岛各工业中心之间的运输时间缩短了高达40%。超过2700公里的新建收费公路将内陆工厂与主要港口连接起来,INAPORTNET港口数位化也缩短了海关停留时间。望加锡港升级为主要枢纽,开闢了一条新的东部出口走廊,有助于缓解爪哇岛的交通拥堵。互联互通的改善使货运公司能够重新设计多模态路线,减少库存积压,并促进低温运输向渔业区域的扩展。随着配套的内陆铁路支线和工业运作,各项效益将逐步积累,而一些先行者已经开始根据干线可靠性的提高重新优化仓库选址。
严重的都市区拥挤和最后一公里瓶颈
雅加达尖峰时段的平均车速仍维持在每小时10-15公里,导致最后一公里配送费用居高不下,最高可达配送成本的50%。快递业者正试图透过引入隔夜送达、微型配送中心和摩托车快递员等方式来缓解拥堵,但这些措施增加了劳动力管理的复杂性。对温度敏感的货物在交通拥堵中容易变质,迫使托运人选择有送达时间保证的加值服务。政府采取的单双号限行等措施对面临调度挑战的货车来说,缓解效果有限。随着电商小包裹量的成长,除非城市物流分区和非道路装卸法规得到改进,否则壅塞成本预计将会更加严重。
细分市场分析
到2025年,以汽车、电子和纺织业为主导的製造业将占印尼货物和物流市场需求的28.45%。强劲的出口导向需要对保税物流中心、港口和机场进行准时交付。同时,由于中产阶级消费的成长,预计2026年至2031年批发零售业将以6.64%的复合年增长率成长,迫使物流公司建构多地点配送网路。农业、林业和渔业将维持与大宗商品出口相关的稳定规模,而由于基础设施投资的增加,建筑物流正在蓬勃发展。
批发和零售客户对全国范围内的当日达或次日达服务需求日益增长,这推动了区域配送中心和强大的干线运输网络的需求。随着製造业推动循环经济目标并增加退货和回收的逆向物流流程,印尼货运和物流业的服务组合正变得日益多元化。
截至2025年,货运代理业务占印尼货运和物流市场的58.95%。儘管规模较小,但宅配(CEP)业务的成长速度超过了其他业务,在2026年至2031年间,其复合年增长率(CAGR)预计将达到7.12%,这主要得益于B2C货运的成长。货运代理业务在多模态协调中继续发挥至关重要的作用,尤其是在连接工业园区和出口港口的陆海联运链中。随着支援全通路功能的库存管理服务模式日益普及,仓储服务的收入也稳定成长。其他服务,例如报关和供应链咨询,则受益于日益复杂的监管环境和贸易数位化。
电子商务交易量每年增长15%,推动了宅配(CEP)的快速成长,这需要高密度的配送网路和高效的分拣处理能力。自动化枢纽降低了单件包裹的配送成本,并实现了当日送达。货运代理商正投资建造宅配柜,并与叫车服务公司合作,以保持竞争力。同时,仓库业者正在维修转运区以适应小包裹分类的需求,这推动了印尼货运和物流市场的整合。
其他福利:
- Excel格式的市场预测(ME)表
- 3个月的分析师支持
目录
第一章 引言
- 研究假设和市场定义
- 调查范围
第二章调查方法
第三章执行摘要
第四章 市场情势
- 市场概览
- 人口统计数据
- 按经济活动分類的GDP分配
- 按经济活动分類的GDP成长
- 通货膨胀
- 经济表现及概览
- 电子商务产业的趋势
- 製造业趋势
- 运输和仓储业GDP
- 出口趋势
- 进口趋势
- 燃油价格
- 卡车运输营运成本
- 卡车运输车队规模(按类型)
- 主要卡车供应商
- 物流绩效
- 透过交通方式分享
- 海运船队运力
- 班轮运输连接
- 停靠港口和演出
- 货运费率趋势
- 货物运输量趋势
- 基础设施
- 法律规范(公路和铁路)
- 法律规范(海事和航空)
- 价值炼和通路分析
- 市场驱动因素
- 电子商务和小包裹处理量快速成长
- 大型企划基础建设项目(收费公路、港口、机场)
- 製造业及出口(汽车、电子设备、纺织品)的復苏
- 国内消费增加及中产阶级支出增加
- 国家物流生态系(NLE)数位平台简介
- 水产养殖和水产品出口对低温运输的需求
- 市场限制
- 严重的都市区拥挤和最后一公里瓶颈
- 监管碎片化和许可证重迭
- 燃油价格波动剧烈
- 物流技术人员短缺
- 市场创新
- 波特五力分析
- 新进入者的威胁
- 买方的议价能力
- 供应商的议价能力
- 替代品的威胁
- 竞争对手之间的竞争
第五章 市场规模与成长预测
- 终端用户产业
- 农业、渔业、林业
- 建设业
- 製造业
- 石油天然气、采矿和采石
- 批发和零售
- 其他的
- 物流职能
- 宅配、速递和小包裹(CEP)
- 按目的地
- 国内的
- 国际的
- 按目的地
- 货运代理
- 透过交通工具
- 航空
- 海路和内河航道
- 其他的
- 透过交通工具
- 货物运输
- 透过交通工具
- 航空
- 管道
- 铁路
- 路
- 海路和内河航道
- 透过交通工具
- 仓储
- 透过温度控制
- 非温控型
- 温度控制
- 透过温度控制
- 其他服务
- 宅配、速递和小包裹(CEP)
第六章 竞争情势
- 市场集中度
- 关键策略倡议
- 市占率分析
- 公司简介
- DHL Group
- DSV A/S(Including DB Schenker)
- Expeditors International of Washington, Inc.
- FedEx
- J&T Express
- Kuehne+Nagel
- Linfox Pty Ltd.
- LOGWIN
- Ninja Van(Including Ninja Express)
- NYK(Nippon Yusen Kaisha)Line
- Pancaran Group
- PT ABM Investama TBK(including CKB Logistics)
- PT Bina Sinar Amity(BSA Logistics Indonesia)
- PT Cardig International
- PT Citrabati Logistik International
- PT Dunia Express Transindo
- PT Jalur Nugraha Ekakurir(JNE Express)
- PT Kamadjaja Logistics
- PT Lautan Luas TBK
- PT Pandu Siwi Group(Pandu Logistics)
- PT Perusahaan Perdagangan Indonesia(including BGR Indonesia)
- PT Pos Indonesia(Persero)
- PT Repex Wahana(RPX)
- PT Samudera Indonesia Tangguh
- PT Satria Antaran Prima TBK(SAPX Express)
- PT Siba Surya
- PT Soechi Lines Tbk
- Puninar Logistics
- SF Express(KEX-SF)
- Sinotrans, Ltd.
- United Parcel Service of America, Inc.(UPS)
第七章 市场机会与未来展望
The Indonesia freight and logistics market size in 2026 is estimated at USD 139.35 billion, growing from 2025 value of USD 131.20 billion with 2031 projections showing USD 188.38 billion, growing at 6.21% CAGR over 2026-2031.
The archipelago's e-commerce boom, the rollout of 2,700 km of new toll roads, and rising export manufacturing output collectively accelerate growth, while infrastructure megaprojects widen geographic coverage beyond Java. Investment in digital platforms such as the National Logistics Ecosystem (NLE) shortens customs clearance times and lowers administrative costs, giving the Indonesia freight and logistics market a structural efficiency lift. Simultaneously, cold-chain facility build-outs, Air freight capacity additions, and multimodal network upgrades provide operators with routes to higher service differentiation. Competitive dynamics favor technology-enabled providers that can navigate severe urban congestion, volatile fuel prices, and overlapping regulations with data-driven route optimization and real-time visibility tools.
Indonesia Freight And Logistics Market Trends and Insights
E-Commerce Boom and Parcel-Volume Surge
Rapid digitization lifts online retail transactions by 15% annually to 2025, funneling unprecedented small-parcel volumes into last-mile networks. CEP specialists such as J&T Express and JNE scale automated hubs and pickup-point ecosystems to handle the flow efficiently. Java's dense conurbations dominate order originations, yet tier-2 cities now post double-digit volume gains as digital payments proliferate. Congested urban arteries in Jakarta limit average delivery speeds to 10-15 km/h, inflating per-package costs and pushing operators toward micro-fulfillment, two-wheeler fleets, and AI-driven route planning. Players with granular address databases and dynamic routing enjoy cost advantages, while traditional freight forwarders scramble to retrofit bulk-cargo processes for consumer-level deliveries.
Infrastructure Megaprojects (Toll Roads, Ports, Airports)
The National Strategic Projects program channels USD 400 billion into roads, ports, and airports, slicing transit times between Java's industrial hubs by as much as 40%. Over 2,700 km of new tollways integrate inland factories with main ports, while INAPORTNET port digitalization shaves customs dwell times. Makassar Port's elevation to major-hub status creates new eastern export corridors that dilute Java congestion. Enhanced connectivity allows freight forwarders to redesign multimodal routes, lowering inventory buffers and facilitating cold-chain expansion into fisheries regions. Benefits accrue gradually as supporting hinterland rail spurs and industrial estates come online, but early adopters already re-optimize warehouse footprints around improved linehaul reliability.
Severe Urban Congestion and Last-Mile Bottlenecks
Jakarta's average peak-hour speed hovers at 10-15 km/h, inflating last-mile fees that can reach 50% of delivery cost. CEP providers deploy night deliveries, micro-depots, and motorcycle couriers to sidestep gridlock, yet these workarounds add labor complexity. Temperature-sensitive goods risk spoilage when idling in traffic, pushing shippers toward premium guaranteed-time services. Government measures such as odd-even license plate schemes offer marginal relief for commercial trucks that lack schedule flexibility. As e-commerce parcel volumes rise, congestion costs are expected to intensify unless city logistics zoning and off-street loading regulations evolve.
Other drivers and restraints analyzed in the detailed report include:
- Manufacturing-Export Rebound (Autos, Electronics, Textiles)
- Rising Domestic Consumption and Middle-Class Spending
- Fragmented Regulations and Overlapping Licenses
For complete list of drivers and restraints, kindly check the Table Of Contents.
Segment Analysis
Manufacturing generated 28.45% of Indonesia freight and logistics market demand in 2025, driven by automotive, electronics, and textiles. High export orientation demands bonded logistics centers and just-in-time deliveries to ports and airports. Wholesale and Retail Trade, however, expands at a 6.64% CAGR (2026-2031) as middle-class consumption proliferates, forcing logistics firms to design multi-node distribution architectures. Agriculture, Fishing, and Forestry maintain steady volumes tied to commodity exports, while Construction logistics climb with infrastructure capex.
Wholesale and Retail Trade clients increasingly stipulate same-day or next-day delivery for nationwide orders, escalating the need for regional fulfillment centers and robust line-haul linkages. Manufacturing shippers adopt circular-economy objectives, adding reverse-logistics flows for returns and recycling, further diversifying service portfolios within the Indonesia freight and logistics industry.
Freight Transport contributed a 58.95% share to the Indonesia freight and logistics market in 2025. CEP, though smaller, posts a 7.12% CAGR (2026-2031) on the back of rising B2C shipments, overtaking other functions in growth velocity. Freight Forwarding remains indispensable for multimodal coordination, especially on sea-road chains linking industrial estates to export ports. Warehousing and Storage revenue scales steadily as firms adopt inventory-as-a-service models to support omnichannel fulfillment. Other Services, such as customs brokerage and supply-chain consulting, benefit from regulatory complexity and trade digitalization.
CEP's surge stems from 15% annual e-commerce transaction growth, necessitating dense delivery networks and high sortation throughput. Automated hubs reduce cost-per-package and enable same-day delivery promises. Freight Transport operators invest in parcel lockers and collaboration with ride-hailing fleets to retain relevance. Meanwhile, warehouse operators retrofit cross-dock areas for parcel flow, underscoring functional convergence within the Indonesia freight and logistics market.
The Indonesia Freight and Logistics Market Report is Segmented by End User Industry (Agriculture, Fishing, and Forestry, Construction, Manufacturing, Oil and Gas, Mining and Quarrying, Wholesale and Retail Trade, and Others), Logistics Function (Courier, Express, and Parcel (CEP), Freight Forwarding, Freight Transport, Warehousing and Storage, and Other Services). The Market Forecasts are Provided in Terms of Value (USD).
List of Companies Covered in this Report:
- DHL Group
- DSV A/S (Including DB Schenker)
- Expeditors International of Washington, Inc.
- FedEx
- J&T Express
- Kuehne+Nagel
- Linfox Pty Ltd.
- LOGWIN
- Ninja Van (Including Ninja Express)
- NYK (Nippon Yusen Kaisha) Line
- Pancaran Group
- PT ABM Investama TBK (including CKB Logistics)
- PT Bina Sinar Amity (BSA Logistics Indonesia)
- PT Cardig International
- PT Citrabati Logistik International
- PT Dunia Express Transindo
- PT Jalur Nugraha Ekakurir (JNE Express)
- PT Kamadjaja Logistics
- PT Lautan Luas TBK
- PT Pandu Siwi Group (Pandu Logistics)
- PT Perusahaan Perdagangan Indonesia (including BGR Indonesia)
- PT Pos Indonesia (Persero)
- PT Repex Wahana (RPX)
- PT Samudera Indonesia Tangguh
- PT Satria Antaran Prima TBK (SAPX Express)
- PT Siba Surya
- PT Soechi Lines Tbk
- Puninar Logistics
- SF Express (KEX-SF)
- Sinotrans, Ltd.
- United Parcel Service of America, Inc. (UPS)
Additional Benefits:
- The market estimate (ME) sheet in Excel format
- 3 months of analyst support
TABLE OF CONTENTS
1 Introduction
- 1.1 Study Assumptions and Market Definition
- 1.2 Scope of the Study
2 Research Methodology
3 Executive Summary
4 Market Landscape
- 4.1 Market Overview
- 4.2 Demographics
- 4.3 GDP Distribution by Economic Activity
- 4.4 GDP Growth by Economic Activity
- 4.5 Inflation
- 4.6 Economic Performance and Profile
- 4.6.1 Trends in E-Commerce Industry
- 4.6.2 Trends in Manufacturing Industry
- 4.7 Transport and Storage Sector GDP
- 4.8 Export Trends
- 4.9 Import Trends
- 4.10 Fuel Price
- 4.11 Trucking Operational Costs
- 4.12 Trucking Fleet Size By Type
- 4.13 Major Truck Suppliers
- 4.14 Logistics Performance
- 4.15 Modal Share
- 4.16 Maritime Fleet Load Carrying Capacity
- 4.17 Liner Shipping Connectivity
- 4.18 Port Calls And Performance
- 4.19 Freight Pricing Trends
- 4.20 Freight Tonnage Trends
- 4.21 Infrastructure
- 4.22 Regulatory Framework (Road and Rail)
- 4.23 Regulatory Framework (Sea and Air)
- 4.24 Value Chain and Distribution Channel Analysis
- 4.25 Market Drivers
- 4.25.1 E-Commerce Boom and Parcel-Volume Surge
- 4.25.2 Infrastructure Megaprojects (Toll Roads, Ports, Airports)
- 4.25.3 Manufacturing-Export Rebound (Autos, Electronics, Textiles)
- 4.25.4 Rising Domestic Consumption and Middle-Class Spending
- 4.25.5 National Logistics Ecosystem (NLE) Digital Platform Rollout
- 4.25.6 Cold-Chain Demand from Aquaculture and Seafood Exports
- 4.26 Market Restraints
- 4.26.1 Severe Urban Congestion and Last-Mile Bottlenecks
- 4.26.2 Fragmented Regulations and Overlapping Licenses
- 4.26.3 High Fuel-Price Volatility
- 4.26.4 Shortage of Logistics-Tech Talent
- 4.27 Technology Innovations in the Market
- 4.28 Porter's Five Forces Analysis
- 4.28.1 Threat of New Entrants
- 4.28.2 Bargaining Power of Buyers
- 4.28.3 Bargaining Power of Suppliers
- 4.28.4 Threat of Substitutes
- 4.28.5 Competitive Rivalry
5 Market Size and Growth Forecasts (Value, USD)
- 5.1 End User Industry
- 5.1.1 Agriculture, Fishing, and Forestry
- 5.1.2 Construction
- 5.1.3 Manufacturing
- 5.1.4 Oil and Gas, Mining and Quarrying
- 5.1.5 Wholesale and Retail Trade
- 5.1.6 Others
- 5.2 Logistics Function
- 5.2.1 Courier, Express, and Parcel (CEP)
- 5.2.1.1 By Destination Type
- 5.2.1.1.1 Domestic
- 5.2.1.1.2 International
- 5.2.1.1 By Destination Type
- 5.2.2 Freight Forwarding
- 5.2.2.1 By Mode of Transport
- 5.2.2.1.1 Air
- 5.2.2.1.2 Sea and Inland Waterways
- 5.2.2.1.3 Others
- 5.2.2.1 By Mode of Transport
- 5.2.3 Freight Transport
- 5.2.3.1 By Mode of Transport
- 5.2.3.1.1 Air
- 5.2.3.1.2 Pipelines
- 5.2.3.1.3 Rail
- 5.2.3.1.4 Road
- 5.2.3.1.5 Sea and Inland Waterways
- 5.2.3.1 By Mode of Transport
- 5.2.4 Warehousing and Storage
- 5.2.4.1 By Temperature Control
- 5.2.4.1.1 Non-Temperature Controlled
- 5.2.4.1.2 Temperature Controlled
- 5.2.4.1 By Temperature Control
- 5.2.5 Other Services
- 5.2.1 Courier, Express, and Parcel (CEP)
6 Competitive Landscape
- 6.1 Market Concentration
- 6.2 Key Strategic Moves
- 6.3 Market Share Analysis
- 6.4 Company Profiles (Includes Global Level Overview, Market Level Overview, Core Segments, Financials as Available, Strategic Information, Market Rank/Share for Key Companies, Products and Services, and Recent Developments)
- 6.4.1 DHL Group
- 6.4.2 DSV A/S (Including DB Schenker)
- 6.4.3 Expeditors International of Washington, Inc.
- 6.4.4 FedEx
- 6.4.5 J&T Express
- 6.4.6 Kuehne+Nagel
- 6.4.7 Linfox Pty Ltd.
- 6.4.8 LOGWIN
- 6.4.9 Ninja Van (Including Ninja Express)
- 6.4.10 NYK (Nippon Yusen Kaisha) Line
- 6.4.11 Pancaran Group
- 6.4.12 PT ABM Investama TBK (including CKB Logistics)
- 6.4.13 PT Bina Sinar Amity (BSA Logistics Indonesia)
- 6.4.14 PT Cardig International
- 6.4.15 PT Citrabati Logistik International
- 6.4.16 PT Dunia Express Transindo
- 6.4.17 PT Jalur Nugraha Ekakurir (JNE Express)
- 6.4.18 PT Kamadjaja Logistics
- 6.4.19 PT Lautan Luas TBK
- 6.4.20 PT Pandu Siwi Group (Pandu Logistics)
- 6.4.21 PT Perusahaan Perdagangan Indonesia (including BGR Indonesia)
- 6.4.22 PT Pos Indonesia (Persero)
- 6.4.23 PT Repex Wahana (RPX)
- 6.4.24 PT Samudera Indonesia Tangguh
- 6.4.25 PT Satria Antaran Prima TBK (SAPX Express)
- 6.4.26 PT Siba Surya
- 6.4.27 PT Soechi Lines Tbk
- 6.4.28 Puninar Logistics
- 6.4.29 SF Express (KEX-SF)
- 6.4.30 Sinotrans, Ltd.
- 6.4.31 United Parcel Service of America, Inc. (UPS)
7 Market Opportunities and Future Outlook
- 7.1 White-space and Unmet-Need Assessment
 2026-2030年全球货运物流市场
 中东和非洲货运物流市场:市场份额分析、行业趋势、统计数据和成长预测(2026-2031 年)义大利货运与物流:市场占有率分析、产业趋势、统计数据与成长预测(2026-2031)北美货运与物流:市场占有率分析、产业趋势与统计、成长预测(2026-2031)德国货运和物流市场:市场份额分析、行业趋势、统计数据和成长预测(2026-2031 年)日本货运物流市场:市场占有率分析、产业趋势与统计、成长预测(2026-2031年)欧洲货运与物流:市场份额分析、行业趋势、统计数据和成长预测(2026-2031 年)法国货运与物流:市场占有率分析、产业趋势、统计数据与成长预测(2026-2031)马来西亚货运与物流:市场占有率分析、产业趋势、统计数据与成长预测(2026-2031)
 日本货运物流市场规模、份额、趋势及预测(按类型、最终用户及地区划分),2026-2034年